Dietary intake and biochemical, hematologic, and immune status of vegans compared with nonvegetarians
Bạn đang xem bản rút gọn của tài liệu. Xem và tải ngay bản đầy đủ của tài liệu tại đây (126.31 KB, 8 trang )
Dietary intake and biochemical, hematologic, and immune status
of vegans compared with nonvegetarians1,2
Ella H Haddad, Lee S Berk, James D Kettering, Richard W Hubbard, and Warren R Peters
KEY WORDS
Vegans, dietary intake, iron, zinc, folate,
vitamin B-12, methylmalonic acid, immunocompetence
and -phytate content of plant-based foods has prompted questions
about the iron and zinc adequacy of the diet (9–11). Adherence to
largely vegan diets may compromise the immune status of individuals, including those living in developed countries (12).
This study was undertaken to assess the nutritional status of
adults consuming only plant foods with respect to vitamin B-12,
iron, zinc, and immune indicators. To do so, dietary intake and
selected biochemical and hematologic measures in a group of
vegans were compared with those of a similar group consuming
nonvegetarian diets.
SUBJECTS AND METHODS
Subjects
Forty-five healthy adult volunteers were selected for the study.
Participants were either students at Loma Linda University or
employees of health-care facilities in the local area. To be included,
participants had to 1) be between the ages of 20 and 60 y, 2) be
within 120% of ideal body weight, and 3) have followed a consistent dietary pattern for ≥ 1 y. Potential subjects were screened
to exclude those with metabolic disease, those taking medications known to influence nutritional status, those who exercised
> 7 h/wk, those who smoked, or those who consumed more than
the equivalent of 1 alcoholic drink/d. The study was approved by
the Institutional Review Board of Loma Linda University and
informed consent was obtained from the subjects at enrollment.
Dietary intake
INTRODUCTION
An extensive body of research documents the health benefits
of vegetarian dietary practices and the lower incidence of
chronic disease, especially heart disease, in vegetarians. Much of
the data are derived from investigations in which Seventh-day
Adventist vegetarians, most of whom consume a lactoovovegetarian diet, were examined. Strict vegetarian or vegan diets,
which exclude all foods of animal origin, are increasingly being
adopted. The adequacy and nutritional effect of diets based
entirely on plant foods is still under investigation.
The early studies on vegan diets in adults concluded that daily
intakes are nutritionally sufficient in protein and most vitamins
except for vitamin B-12 (1–6). Since then, metabolic and neuropsychiatric abnormalities suggestive of vitamin B-12 deficiency have been observed in vegans (7, 8). Also, the high-fiber
586S
Subjects were taught how to keep accurate food records. The
first day of the record consisted of a 24-h recall completed by
a trained interviewer to instruct participants in the degree of
detail needed for the record. Participants recorded the type and
quantity of food and beverages consumed for 2 weekdays and
1 weekend day; in total, 4-d food intake and supplement use
1
From the Department of Nutrition, School of Public Health; the Department of Medical Technology, School of Allied Health Professions; the
Departments of Microbiology and Pathology and Human Anatomy, School of
Medicine; and the Center for Health Promotion, Loma Linda University, CA.
2
Address reprint request to EH Haddad, the Department of Nutrition,
School of Public Health, Loma Linda University, Loma Linda, CA 92350.
E-mail:
Am J Clin Nutr 1999;70(suppl):586S–93S. Printed in USA. © 1999 American Society for Clinical Nutrition
Downloaded from www.ajcn.org by on September 16, 2008
ABSTRACT
Dietary and nutritional status of individuals
habitually consuming a vegan diet was evaluated by biochemical,
hematologic, and immunologic measures in comparison with a
nonvegetarian group. On the basis of 4-d dietary records, the intake
of female and male vegans tended to be lower in fat, saturated fat,
monounsaturated fat, and cholesterol and higher in dietary fiber than
that of vegetarians. With computed food and supplement intakes,
vegan diets provided significantly higher amounts of ascorbate,
folate, magnesium, copper, and manganese in both female and male
participants. The body mass index (BMI; in kg/m2) of the vegans
was significantly lower than that of the nonvegetarians and 9 of the
25 vegans had a BMI <19. Serum ferritin concentrations were
significantly lower in vegan men but iron and zinc status did not
differ between the sexes. Mean serum vitamin B-12 and methylmalonic acid concentrations did not differ; however, 10 of the 25 vegans
showed a vitamin B-12 deficit manifested by macrocytosis,
circulating vitamin B-12 concentrations < 150 pmol/L, or serum
methylmalonic acid >376 nmol/L. Vegans had significantly lower
leukocyte, lymphocyte, and platelet counts and lower concentrations
of complement factor 3 and blood urea nitrogen but higher serum
albumin concentrations. Vegans did not differ from nonvegetarians
in functional immunocompetence assessed as mitogen stimulation
or natural killer cell cytotoxic activity.
Am J Clin Nutr 1999;
70(suppl):586S–93S.
NUTRITIONAL STATUS OF VEGANS AND NONVEGETARIANS
TABLE 1
Characteristics of vegan and nonvegetarian subjects
Nonvegetarians
(n = 20)
Vegans
(n = 25)
33.5 ± 8.21
25.5 ± 3.1
36.0 ± 8.1
20.5 ± 2.52
145 ± 145
607 ± 607
150 ± 225
628 ± 941
4.80 ± 0.95
1.50 ± 0.40
1.20 ± 0.60
0
0
7
1
4.30 ± 0.90
1.20 ± 0.30
1.00 ± 0.40
12.1 (1–25)3
4.2 (1–37)
4
6
0
9
Age (y)
BMI (kg/m2)
Exercise
(kcal/d)
(kJ/d)
Blood lipids (mmol/L)
Total cholesterol
HDL cholesterol
Triacylglycerol
Duration of vegetarian diet (y)
Duration of vegan diet (y)
Multivitamin-mineral supplement users
Single-nutrient (calcium, iron, or
vitamin C) supplement users
Vitamin B-12 supplement users
1–
x ± SD.
2
Significantly different from nonvegetarians, P < 0.001 (t test).
x ; range in parentheses.
3–
Clinical and biochemical measures
Fasting, peripheral venous blood samples were collected in
the morning between 0700 and 0900 by venipuncture. Complete
blood counts, a chemistry panel, a serum immunoglobulin analysis, and a complement fraction analysis were performed by the
Loma Linda University Medical Center Clinical Laboratory
according to standardized procedures.
Serum ferritin was analyzed with an enzyme immunoassay kit
(Milenia NKFE1; Diagnostic Products Corporation, Los Angeles)
by using a microplate reader (model 2380; Bio-Tek, Winooski,
VT). Serum folic acid and vitamin B-12 concentrations were determined by simultaneous radioassays (Quantaphase-II, 1911040;
Bio-Rad Laboratories, Richmond, CA) using a gamma counter
(model LB1213; EGNG Berthold, Wildbad, Germany). Trace
element–free tubes (Becton Dickinson, Rutherfold, NJ) were
used to collect blood for plasma zinc analysis by atomic absorption spectrophotometry (model AA-475; Varian, Sunneyvale, CA)
(13). Standard reference material (bovine serum standard reference material no. 1598, National Institute of Standards and
Technology, Gaithersburg, MD) was used to check the accuracy
and precision of the determinations. Serum methylmalonic acid,
2-methylcitrate homocysteine, and cystathionine were measured
by gas chromatography–mass spectrometry at Metabolite Laboratories, Inc, at the University of Colorado Health Sciences Center, Denver (14, 15).
Mitogen assay and natural killer cell activity
Lymphocytes for blastogenic response tests and killer cell
assays were isolated from blood with heparin by using FicollPaque (Pharmacia Fine Chemicals, Piscataway, NJ) and resuspended in RPMI-1640 culture medium (Gibco, Grand Island,
NY). Lymphocyte proliferation was measured by [3H]thymidine
incorporation after stimulation with phytohemagglutinin, concanavalin A and pokeweed mitogens (16). The stimulation index
(SI) was calculated as follows: SI = [cpm (mitogen stimulated)/cpm (control)].
Natural killer cytolytic activity was determined in peripheral
blood mononuclear cells by using K562 target cells in a 51Cr
release assay (17). The percentage of 51Cr release or percentage
lysis at multiple effector-to-target ratios was determined by using
the following equation: [(sample Ϫ spontaneous) cpm]/[(maximum Ϫ spontaneous) cpm] ϫ 100. Cytotoxicity was expressed as
lytic units (LU) and these were defined as the number of cells
required to cause 20% target cell lysis calculated by an exponentially fit equation and expressed as LU/106 peripheral blood
mononuclear leukocytes.
Statistical methods
Statistical analyses were done by using SPSS for WINDOWS
(Statistical Package for the Social Sciences, version 6.0 1996;
SPSS, Inc, Chicago). Group means and SDs were calculated.
Independent-sample t tests were conducted to evaluate differences between the vegan and nonvegetarian groups. Multiple
regression was used to evaluate the influence of diet, age, or
body mass index (BMI; in kg/m2) on selected immune measures.
RESULTS
Twenty-five vegans (10 men, 15 women) and 20 nonvegetarians (10 men, 10 women) who met the eligibility criteria were
included in the study. Subject characteristics are summarized in
Table 1. Vegans were defined as those who excluded meat, fish,
poultry, dairy products, and eggs from their diets whereas nonvegetarians regularly included all food categories. There were no
significant differences between the 2 groups in age, physical
activity level, or blood lipid concentrations. The vegan group,
however, had a significantly lower BMI than the nonvegetarian
group. The average number of years of vegan diet was 4.2 with
a range of 1–25 y. Most of the vegans had followed a vegetarian
diet before becoming vegans. The average number of years of
following vegetarian dietary practices was 12.1 y with a range of
1–37 y. Of the 20 nonvegetarians, 7 regularly used multivitaminmineral supplements, compared with 4 of 25 in the vegan group.
One nonvegetarian and 6 vegans took single-nutrient supplements of iron, calcium, or vitamin C. None of the nonvegetarians
took a separate vitamin B-12 supplement, whereas 9 of the 25
vegans reported that they did so.
Dietary pattern and nutrient intake
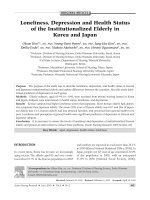
The food pattern of the vegans compared with that of the nonvegetarians is shown in Figure 1. Vegans consumed no flesh foods
and practically no dairy foods or eggs. Vegans, however, consumed
more servings per day of grains and breads, vegetables, fruit,
legumes, and nuts and seeds. Only vegans consumed soymilk, tofu,
and meat analogs. Meat analogs are commercially available foods
prepared from soy protein, wheat gluten, legumes, and other ingredients and designed to substitute for meat in the diet.
Results from 4 d of food records were averaged for each person and used for group comparisons as shown in Table 2. The
intake of female vegans compared with that of female nonvegetarians was significantly lower in protein, total fat, saturated fat,
and monounsaturated fat both in quantity and as a percentage of
energy. Female vegans consumed more dietary fiber and less
Downloaded from www.ajcn.org by on September 16, 2008
records were obtained from each participant.. Food records were
analyzed by using NUTRITIONIST IV software (version 2.01
1993; N-Squared Computing, Salem, OR). Vitamin and mineral
supplement use was documented and evaluated as appropriate.
587S
588S
HADDAD ET AL
dietary cholesterol. Nutrient values of food intake and of food
plus supplement intake were computed. Foods consumed by
female vegans provided significantly higher amounts of ascorbate, thiamine, folate, magnesium, and copper, and lower
amounts of vitamin B-12. When supplement use was included,
intakes of ascorbate, thiamine, folate, magnesium, and copper
remained significantly different, but that of vitamin B-12 did not.
The intakes of male vegans showed similar trends with percentage energy as fat, saturated fat, percentage energy as saturated fat,
percentage energy as monounsaturated fat, and dietary cholesterol being lower, and dietary fiber being higher than that of
male nonvegetarians. The diets of male vegans provided significantly higher amounts of vitamin A, ascorbate, thiamine, vitamin B-6, folic acid, magnesium, iron, copper, manganese, and
dietary fiber, and lower amounts of vitamin B-12. When supplements were included, significantly higher intakes were observed
for ascorbate, folate, magnesium, copper, and manganese in male
vegans.
Iron and zinc
Biomarkers for vitamin B-12 and folate status are shown in
Table 4. Mean serum vitamin B-12 and methylmalonic acid concentrations did not differ significantly between groups. However,
of 25 vegan participants, 2 had macrocytosis (mean red cell volume ≥98 fL), 3 had circulating concentrations of vitamin B-12
< 150 pmol/L, and 5 had methylmalonic acid concentrations
> 376 nmol/L, which is the critical cutoff point that represents
3 SDs above the population mean.
The vegan group had a significantly lower mean serum
2-methylcitric acid concentration than did the nonvegetarian
group. As expected, vegans also had significantly higher mean
serum folate concentrations.
Immune variables and immunocompetence
White blood cell counts and immune status measures in nonvegetarian and vegan participants are shown in Table 5. The
vegan group had significantly lower numbers of leukocytes, lymphocytes, and platelets and lower complement factor 3. Mean
albumin concentration was significantly higher in the vegan
group and blood urea nitrogen was significantly lower. There
were no significant differences between the groups in natural
killer cell activity or in the mitogen stimulation indexes.
Multiple regression coefficients for diet (vegan = 1, nonvegetarian = 2), BMI, and age as predictors for leukocyte count, lymphocyte count, and complement factor 3 concentration are shown
in Table 6. These variables were entered because they were
found to contribute significantly to the variation in one or more
of these measures in initial univariate analysis. A second analysis was conducted to evaluate whether BMI or age were significant predictors over and above the effect of diet. The change in
FIGURE 1. Food patterns of vegan (ᮀ) compared with nonvegetarian () diets based on 4-d food records. The number of servings of meat, bread,
vegetable, fruit, and milk were computed by using NUTRITIONIST IV (version 2.01). Serving of legumes, nuts, seeds, analogs (meat substitutes), and
tofu were computed manually on the basis of the serving sizes shown.
Downloaded from www.ajcn.org by on September 16, 2008
Hematologic and zinc nutritional status indicators in male and
female vegans compared with nonvegetarians are shown in Table 3.
Male vegans had a significantly greater mean cell volume and
lower ferritin concentration than did nonvegetarians. Low hemoglobin concentrations were observed only in female participants
with 1 of the 10 nonvegetarian and 2 of the 15 vegan females having a concentration ≤ 120 g/L, which suggests borderline iron deficiency anemia. Plasma ferritin is a sensitive indicator of iron storage and a value ≤ 12 g/L indicates depletion of iron stores (18).
The compromised iron stores of female subjects, as reflected in
plasma ferritin results, showed that 2 of the 10 nonvegetarians and
4 of the 15 vegans had concentrations ≤ 12 g/L.
Vitamin B-12 and folate
NUTRITIONAL STATUS OF VEGANS AND NONVEGETARIANS
589S
TABLE 2
Estimated mean nutrient intakes of nonvegetarian and vegan females and males based on 4-d food records1
Females
Nonvegetarian
(n = 10)
Males
Vegan
(n = 15)
Nonvegetarian
(n = 10)
2–4
Significantly different from the nonvegetarian group of the same sex: 2 P < 0.001, 3 P < 0.05, 4 P < 0.01.
9.29 ± 2.17
75 ± 18
13 ± 2
67 ± 14
26 ± 44
13 ± 74
5 ± 22
23 ± 8
9 ± 33
21 ± 8
9±3
48 ± 112
3 ± 42
2040 ± 16603
2040 ± 1660
21 ± 9
21 ± 9
240 ± 1253
240 ± 1253
3.47 ± 2.053
3.47 ± 2.05
1.85 ± 0.87
1.85 ± 0.87
26.3 ± 9.2
26.3 ± 9.2
3.21 ± 1.334
3.21 ± 1.33
640 ± 2502
640 ± 2503
2.9 ± 3.9
5.0 ± 4.4
715 ± 395
840 ± 750
605 ± 1704
605 ± 7024
26.4 ± 12.32
43.4 ± 41.2
12.2 ± 4.7
12.2 ± 4.7
3.1 ± 0.92
3.1 ± 0.93
5.6 ± 2.04
5.6 ± 2.03
Downloaded from www.ajcn.org by on September 16, 2008
Energy (MJ/d)
8.24 ± 2.18
7.09 ± 1.82
9.04 ± 2.76
Protein
(g/d)
74 ± 14
52 ± 132
85 ± 23
(% of energy)
15 ± 3
12 ± 13
16 ± 6
Fat
(g/d)
76 ± 27
52 ± 203
80 ± 24
(% energy)
34 ± 5
25 ± 72
32 ± 5
Saturated fat
(g/d)
27 ± 12
12 ± 74
25 ± 8
(% energy)
12 ± 3
6 ± 42
10 ± 2
MUFA
(g/d)
30 ± 13
19 ± 103
31 ± 10
(% energy)
14 ± 3
10 ± 43
13 ± 3
PUFA
(g/d)
15 ± 6
14 ± 5
16 ± 6
(% energy)
7±2
8±2
7±1
Dietary Fiber (g)
15 ± 6
38 ± 112
20 ± 7
Cholesterol (mg)
235 ± 65
20 ± 302
260 ± 120
Vitamin A (RE)
Food
1310 ± 955
2210 ± 3920
875 ± 460
Food + supplements
1475 ± 905
2420 ± 3965
1200 ± 715
Vitamin E (TE)
Food
23 ± 12
17 ± 7
18 ± 8
Food + supplements
25 ± 11
19 ± 8
21 ± 10
Ascorbate (mg)
Food
115 ± 60
230 ± 1503
120 ± 55
Food + supplements
125 ± 60
275 ± 2303
140 ± 75
Thiamine (mg)
Food
1.40 ± 0.42
1.97 ± 0.643
1.62 ± 0.67
Food + supplements
1.63 ± 0.59
2.28 ± 0.773
2.11 ± 1.25
Riboflavin (mg)
Food
1.65 ± 0.51
1.36 ± 0.29
1.67 ± 0.63
Food + supplements
1.92 ± 0.56
1.72 ± 0.70
2.23 ± 1.37
Niacin (mg)
Food
22.7 ± 8.5
17.3 ± 4.7
24.2 ± 7.2
Food + supplements
25.8 ± 8.2
21.5 ± 8.0
30.7 ± 13.7
Vitamin B-6 (mg)
Food
1.68 ± 0.49
2.17 ± 0.75
1.74 ± 0.48
Food + supplements
2.00 ± 0.56
2.59 ± 0.95
2.39 ± 1.20
Folate (g)
Food
240 ± 115
435 ± 1554
275 ± 175
Food + supplements
300 ± 140
520 ± 2054
400 ± 275
Vitamin B12 (g)
Food
4.6 ± 2.9
1.4 ± 1.22
3.3 ± 1.5
Food + supplements
5.7 ± 3.0
6.0 ± 5.1
5.3 ± 3.6
Calcium (mg)
Food
830 ± 375
590 ± 195
670 ± 325
Food + supplements
855 ± 355
710 ± 280
720 ± 375
Magnesium (mg)
Food
300 ± 120
420 ± 1253
330 ± 70
Food + supplements
315 ± 105
440 ± 1303
365 ± 100
Iron (mg)
Food
15.3 ± 9.1
17.6 ± 6.1
15.0 ± 5.7
Food + supplements
20.2 ± 11.6
22.6 ± 10.0
20.9 ± 13.2
Zinc (mg)
Food
10.9 ± 4.6
7.7 ± 1.9
10.1 ± 1.8
Food + supplements
13.2 ± 5.2
10.8 ± 6.4
15.0 ± 8.8
Copper (mg)
Food
1.5 ± 0.8
2.2 ± 0.63
1.3 ± 0.3
Food + supplements
1.8 ± 0.8
2.6 ± 0.93
2.0 ± 1.2
Manganese (mg)
Food
2.3 ± 1.3
4.1 ± 2.53
2.8 ± 1.6
Food + supplements
2.7 ± 1.4
4.7 ± 3.03
3.6 ± 2.1
1–
x ± SD. MUFA, monounsaturated fatty acids; PUFA, polyunsaturated fatty acids; RE, retinol equivalents; TE, tocopherol equivalents.
Vegan
(n = 10)
590S
HADDAD ET AL
TABLE 3
Iron and zinc nutritional status indicators in male and female vegans compared with nonvegetarians
Males
Hemoglobin (g/L)
Subjects with hemoglobin ≤ 120 g/L
Hematocrit
Mean cell volume (fL)
Ferritin (g/L)
Subjects with ferritin ≤ 12 g/L
Plasma zinc (mol/L)
1–
x ± SD.
2
Females
Nonvegetarians
(n = 10)
Vegans
(n = 10)
Nonvegetarians
(n = 10)
Vegans
(n = 15)
156 ± 71
0
0.45 ± 0.02
88.2 ± 2.6
141 ± 93
0
16.2 ± 2.6
154 ± 7
0
0.45 ± 0.02
91.5 ± 3.82
72 ± 322
0
15.1 ± 2.7
133 ± 10
1
0.40 ± 0.02
90.1 ± 4.0
22 ± 13
2
13.8 ± 1.1
132 ± 10
2
0.39 ± 0.03
90.7 ± 4.4
27 ± 16
4
13.7 ± 1.4
Significantly different from nonvegetarians, P < 0.05.
DISCUSSION
The objective of this study was to assess the nutritional status
of vegans compared with that of nonvegetarians. Interpretation
of the findings must consider the relative body weights of the
participants in the groups. Although severely overweight individuals were excluded from the study, the mean BMI of the vegans was significantly lower than that of the nonvegetarians. Of
the 25 vegan participants, 9 had BMIs < 19. The reported energy
intakes calculated from 4-d records were lower in the female
vegans and higher in the male vegans than in nonvegetarians of
the respective sex, but the differences were not significant. Leanness in vegans may be due to reduced food intake not reflected
in the 4-d records, habitually low fat intake, or other factors.
Dietary intake data obtained in this study were similar to those
observed by others who have assessed vegan diets (20–25).
According to the 4-d records, the protein contents of the vegan
diets of women were significantly lower than those of the nonvegetarians, and 10 of the 25 vegan women failed to meet the
recommended dietary allowance of 0.8 g/kg body wt for daily
protein intake. Diets based entirely on plant foods tend to be
lower in total fat, saturated fat, monounsaturated fat, and cholesterol. They also tend to be higher in dietary fiber and most nutrients, including many of the mineral elements, except for vitamin
B-12. Although plant foods do not contain vitamin B-12, some
of the vegan participants consumed food items fortified with
vitamin B-12, such as ready-to-eat breakfast cereal, soymilk, and
meat analogs, or took vitamin B-12 supplements.
Iron
One concern with vegetarian diets has been the possibility of
iron deficiency and consequent anemia. Iron bioavailability from
foods of plant origin is low compared with that from meat. Inorganic iron binds to phytates, tannins, and phosphates in plant foods
and these may have an inhibitory effect on iron absorption (26). On
the other hand, vegetarian diets provide ample quantities of vitamin
C, which is known to enhance the absorption of iron (27).
Vegan men had a relatively high intake of dietary iron but
their mean ferritin concentrations were significantly lower than
those of nonvegetarians. This is consistent with other studies that
showed hemoglobin to be within the normal range and ferritin
concentrations to be lower in male vegetarians (28, 29). In population studies, lower ferritin concentrations have been associated with a lower risk of heart disease (30) and may be thought
of as a beneficial consequence of vegetarian and vegan diets. Our
results show that marginal iron status is a potential problem for
women whether they follow vegan or nonvegetarian diets.
Zinc
The vegan diet has the potential to be low in zinc. In the
United States, 65% of dietary zinc comes from animal products
such as meat, poultry eggs, oysters, and other seafood. Vegan
diets contain large amounts of fiber and phytate and it was found
that the crude fiber intake of vegetarian diets negatively correlated with plasma zinc (10). Freeland-Graves et al (31, 32) found
that vegan women had low dietary intake of zinc and although
their serum zinc concentration was lower than that of nonvegetarians, the difference was not significant. Anderson et al (28)
examined Canadian Seventh-day Adventist lactoovovegetarian
women and found that plant foods provided 77% of their zinc
intake and their serum zinc concentrations were not significantly
different from those of nonvegetarians.
There is no agreement on the best way to assess zinc status.
Plasma zinc concentrations of vegans in this study tended to be
lower than those of nonvegetarians, however, not significantly
so. Because the dietary intakes of the 2 groups were approximately equal, the data are consistent with lower absorption of
zinc from plant foods. The vegans in this study did not appear to
have impaired zinc status.
Vitamin B-12
Vitamin B-12 is present only in animal foods; diets based
entirely on plant foods are devoid of the vitamin unless they are
supplemented or contaminated. Depletion of vitamin B-12 stores is
thought to be rare in healthy young- and middle-aged individuals
who adopt vegan diets, and, even if no dietary source is consumed,
depletion may take many years to occur if at all. Although the average time subjects consumed a vegan diet was 4.2 y in this study, the
data showed that 10 of the 25 vegans had at least one indicator of
Downloaded from www.ajcn.org by on September 16, 2008
variance explained by the addition of a variable in the regression
analysis is defined as ⌬R2. After diet was controlled for, only age
was a significant predictor of lymphocyte count. BMI did not
account for a significant proportion of the variance seen in
leukocyte count or complement factor 3 concentrations. These
results suggest that individuals with similar BMIs are more
likely to have lower leukocyte counts and complement 3 concentrations if they are following a vegan diet.
NUTRITIONAL STATUS OF VEGANS AND NONVEGETARIANS
TABLE 4
Vitamin B-12 and folate status
Status indicator
Serum component
Vitamin B-12 (pmol/L)
Folate (nmol/L)
Methylmalonic acid (nmol/L)
2-Methylcitric acid (nmol/L)
Total homocysteine (mol/L)
Cystathionine (nmol/L)
Subjects with indicators of vitamin B-12 deficit
Serum vitamin B-12 < 150 pmol/L
Serum methylmalonic acid > 376 nmol/L3
Mean cell volume > 98 fL
1–
x ± SD.
Nonvegetarians Vegans
(n = 20)
(n = 25)
313 ± 991
25 ± 10
262 ± 53
165 ± 31
8.0 ± 1.9
124 ± 41
312 ± 125
38 ± 152
316 ± 152
140 ± 302
7.9 ± 1.5
105 ± 54
0
0
0
3
5
2
2
Significantly different from nonvegetarians, P < 0.01.
Methylmalonic acid > 376 nmol/L is 3 SDs above the population
mean (19).
3
TABLE 5
White blood cell counts and immune status indicators in nonvegetarians
and vegans1
White blood cell counts (ϫ 109/L)
Leukocytes
Lymphocytes
Neutrophils
Monocytes
Eosinophils
Basophils
Platelets
Albumin (g/L)
Blood urea nitrogen (mmol/L)
Immune globulins (g/L)
Immunoglobulin G
Immunoglobulin A
Immunoglobulin M
Complement factors (g/L)
Complement factor 3
Complement factor 4
Complement factor 50
C-reative protein
Natural killer cell cytotoxic activity
20:1, Effector-to-target ratio (% lysis)
Lytic units (LU/106 cells)
Mitogen stimulation (SI)4
Phytohemagglutinin
Concanavalin A
Pokeweed
1–
x ± SD.
Nonvegetarians
(n = 20)
Vegans
(n = 25)
5.83 ± 1.51
1.90 ± 0.59
3.47 ± 1.02
0.24 ± 0.08
0.17 ± 0.09
0.05 ± 0.03
270 ± 55
46.9 ± 3.8
4.78 ± 1.0
4.96 ± 0.912
1.56 ± 0.392
3.04 ± 0.83
0.19 ± 0.09
0.14 ± 0.10
0.04 ± 0.02
235 ± 602
49.3 ± 2.92
4.03 ± 1.02
13.5 ± 2.2
29.0 ± 1.3
18.5 ± 9.5
13.6 ± 2.9
23.0 ± 7.0
20.0 ± 8.5
0.75 ± 0.11
0.27 ± 0.08
202 ± 74
0.282 ± 0.10
0.63 ± 0.093
0.23 ± 0.08
195 ± 61
0.286 ± 0.13
31.6 ± 10.7
15.5 ± 11.9
33.5 ± 17.9
16.6 ± 17.8
80 ± 45
60 ± 33
13 ± 7
106 ± 70
73 ± 51
16 ±13
2,3
4
Significanlty different from nonvegetarians: 2 P < 0.05, 3 P < 0.001.
SI, stimulation index = [cpm (mitogen stimulated)/cpm (control)].
did not regularly consume vitamin B-12–fortified foods or supplements. It is important to emphasize that several indicators
must be evaluated to assess status because individuals respond
differently to low intakes. Serum vitamin B-12 concentrations are
helpful in diagnosis of vitamin B-12 deficiency but serum
methylmalonic acid concentration is a sensitive and specific early
indicator of deficit.
Immune status
Results of this study showed lower leukocyte, lymphocyte,
and platelet counts and complement factor 3 concentrations in
vegans than in nonvegetarians. Similar reductions in these measures have been observed in protein-energy malnutrition (36–38)
and as a consequence of energy restriction for the purposes of
weight control (39).
The vegan group had significantly higher mean serum albumin and lower blood urea nitrogen concentrations. The lower
blood urea nitrogen reflects the lower dietary protein intake of
vegans. Although serum albumin may not be a sensitive indicator of protein nutriture, the higher concentrations suggest that the
diets of the vegan participants were adequate in protein. A
dietary intervention study of young men before and after 12 wk
of a low-fat diet resulted in an increase in natural killer cell
activity (40). Even though the dietary fat intake of vegans in this
study was substantially lower, their natural killer cell activity
was not different from that of nonvegetarians.
Downloaded from www.ajcn.org by on September 16, 2008
vitamin B-12 deficiency, either macrocytosis, low serum vitamin
B-12, or elevated methylmalonic acid concentration (Table 4).
Vitamin B-12 is required for DNA synthesis and erythropoiesis
and a deficiency may result in higher proportions of immature,
enlarged red blood cells. It is also an enzymatic cofactor for the
action of methylmalonyl-CoA mutase in the conversion of methylmalonyl-CoA to succinyl-CoA. If vitamin B-12 status is inadequate, mutase is inhibited and the metabolite methylmalonic acid
accumulates (33). Increased serum methylmalonate is a sensitive
early indicator of vitamin B-12 deficiency. Vegan subjects in this
study had elevated serum methylmalonic acid concentrations with 5
having concentrations > 376 nmol/L, a definitive cutoff value 3 SDs
above the mean of a healthy population (19, 34).
Studies have reported elevations in serum 2-methylcitrate in
vitamin B-12 deficiency (14). This metabolite is a product of the
condensation of propionyl-CoA and oxaloacetate, and in vitamin
B-12 deficiency, propionyl Co-A may accumulate and result in
increased synthesis of 2-methylcitric acid. In this study, however,
the vegan group had a significantly lower mean serum 2-methylcitrate concentration and all vegan participants had values within the
normal range. There were no differences between vegans and nonvegetarians in serum homocysteine concentration and, with one
exception, homocysteine concentrations were within or below normal limits for all participants.
Correlational analysis and group comparisons did not show a
relation between supplemental vitamin B-12 consumption and
any of the metabolites assessed. There was, however, a significant correlation (P < 0.05) between vitamin B-12 supplement
intake and serum B-12 concentrations. Marginal vitamin B-12
intake can cause the development of neuropsychiatric disorders
such as paresthesia, weakness, fatigue, and poor mental concentration in the absence of abnormal manifestations in the usual
indicators such as very low serum concentrations of the vitamin,
macrocytosis, or the resulting anemia (7, 8). These changes are
serious and could result in irreversible functional deterioration.
Our results are consistent with those of others that showed that
vegans adhering to entirely plant-based diets are at risk of developing vitamin B-12 deficiency (35). Although group means did
not show differences in dietary plus supplemental vitamin B-12
intakes between groups, several individuals in the vegan group
591S
592S
HADDAD ET AL
TABLE 6
Standardized regression coefficients, regression coefficients, changes in R2
(⌬R2), and significance of diet, age, or BMI as predictors of leukocyte
count, lymphocyte count, and plasma complement factor 3 concentration
Variable
Leukocyte count
Diet
BMI
Lymphocyte count
Age
Diet
Complement factor 3
Diet
BMI

R2
⌬R2
P
0.34
0.09
0.12
0.12
—
0.004
0.02
—
Ϫ0.33
0.29
0.11
0.20
—
0.08
0.023
0.046
0.51
0.23
0.26
0.29
—
0.03
0.000
—
We are indebted to RH Allen and SP Stabler at the Division of Hematology, University of Colorado Health Sciences Center, for the metabolite assays
and for input on the manuscript. We gratefully acknowledge L Hawkins for
help in dietary data collection and computerized nutrient analysis and P Steinweg for assistance with data analysis.
REFERENCES
1. Hardinge MG, Stare FJ. Nutritional studies of vegetarians. 1. Nutritional, physical and laboratory studies. Am J Clin Nutr 1954;2:73–82.
2. Wokes F, Badenoch J, Sinclair HM. Human dietary deficiency of
vitamin B12. Am J Clin Nutr 1955;3:375–82.
3. Guggenheim K, Weiss Y, Fostick M. Composition and nutritive value
of diets consumed by strict vegetarians. Br J Nutr 1962;16:467–71.
4. Ellis FR. Mumford P. The nutritional status of vegans and vegetarians.
Proc Nutr Soc 1967;26:209–16.
5. Ellis FR. Montegriffo VME. Veganism, clinical findings and investigations. Am J Clin Nutr 1970;23:249–55.
6. Sanders TAB, Ellis FR, Dickerson JWT. Haematological studies on
vegans. Br J Nutr 1978;40:9–15.
7. Lindenbaum J, Healton EB, Savage DG, et al. Neuropsychiatric disorders caused by cobalamin deficiency in the absence of anemia or
macrocytosis. N Engl J Med 1988;318:1720–8.
8. Bar-sella P, Rakover Y, Ratner D. Vitamin B12 and folate levels in
long-term vegans. Isr J Med Sci 1990;26:309–12.
9. Harland BF, Peterson M. Nutritional status of lacto-ovo-vegetarian
Trappist monks. J Am Diet Assoc 1978;72:259–64.
10. Latta D, Liebman M. Iron and zinc status of vegetarian and non-vegetarian males. Nutr Rep Int 1984;30:141–9.
Downloaded from www.ajcn.org by on September 16, 2008
The question was raised as to whether the immune status
results observed in this study are a consequence of the relatively
low body weights of the vegans. Multiple regression analysis of
the data did not show that BMI had an effect independent of diet.
Further research is needed to elucidate the associations between
diet, body weight, and immune function measures in healthy, lean
individuals.
In summary, we observed that vegans had lower numbers of
circulating white cells and less complement factor 3. There were
no reductions in functional measures such as mitogen stimulation and natural killer cell activity. It is not possible to determine
from these finding whether the immune status of vegans is compromised or enhanced compared with other groups. Future investigators might consider a longitudinal study to determine
whether the vegan diet is a risk or protective factor for morbidity and common infections.
11. Dwyer JT. Nutritional consequences of vegetarianism. Annu Rev Nutr
1991;11:61–91.
12. Strachan DP, Powell KJ, Thaker A, Millard FJ, Maxwell JD. Vegetarian diet as a risk factor for tuberculosis in immigrant south London
Asians. Thorax 1995;50:175–80.
13. Smith JC, Butrimovitz GP, Purdy WC. Direct measurement of zinc in
plasma by atomic absorption spectroscopy. Clin Chem 1997;25:1487–91.
14. Allen RH, Stabler SP, Savage DG, Lindenbaum J. Elevation of
2-methylcitric acid I and II levels in serum, urine, and cerebrospinal
fluid of patients with cobalamin deficiency. Metabolism 1993;42:
978–88.
15. Stabler SP, Lindenbaum J, Savage DG, Allen RH. Elevation of serum
cystationine levels in patients with cobalamin and folate deficiency.
Blood 1993;81:3404–13.
16. Kelly JP, Parker CW. Effect of arachidonic acid and other unsaturated
fatty acids on mitogenesis in human lymphocytes. J Immunol 1979;
122:1556–62.
17. Pross HF, Baines MG, Rubin P, Shragge P, Patterson MS. Spontaneous
human lymphocyte-mediated cytotoxicity against tumor target cell.
IX. The quantitation of natural killer cell activity. J Clin Immunol
1981;1:51–63.
18. Cook JD, Finch CA. Assessing iron status of a population. Am J Clin
Nutr 1979;32:2115–9.
19. Lindenbaum J, Savage DG, Stabler SP, Allen RH. Diagnosis of cobalamin deficiency. II. Relative sensitivities of serum cobalamin, methylmalonic acid and total homocysteine concentration. Am J Hematol
1990;34:99–107.
20. Abdulla M, Andersson, I, Asp N-G, et al. Nutrient intake and health
status of vegans. Chemical analyses of diets using the duplicate portion sampling technique. Am J Clin Nutr 1981;34:2464–77.
21. Roshanai F, Sanders TAB. Assessment of fatty acid intakes in vegans
and omnivores. Hum Nutr Appl Nutr 1984;38A:345–54.
22. Calkins BM, Whittaker DJ, Nair PP, Rider AA, Turjman N. Diet, nutrition intake, and metabolism in populations at high and low risk for
colon cancer. Nutrient intake. Am J Clin Nutr 1984;40(suppl):
896S–905S.
23. Draper A, Lewis J, Malhotra N, Wheeler E. The energy and nutrient
intakes of different types of vegetarian: a case for supplements? Br J
Nutr 1993;69:3–19.
24. Alexander D, Ball MJ, Mann J. Nutrient intake and haematological
status of vegetarians and age-sex matched omnivores. Eur J Clin Nutr
1994;48:538–46.
25. Janelle KC, Barr SI. Nutrient intakes and eating behavior scores of
vegetarian and nonvegetarian women. J Am Diet Asoc 1995; 95:
180–186, 189.
26. Hazell T. Relating food composition data to iron availability from
plant foods. Eur J Clin Nutr 1988;42:509–17.
27. Hallberg L, Brune M, Rossander-Hulthen L. Is there a physiological role
of vitamin C in iron absorption? Ann N Y Acad Sci 1987;498:324–32.
28. Anderson BM, Gibson RS, Sabry JH. The iron and zinc status of longterm vegetarian women. Am J Clin Nutr 1981;34:1042–8.
29. Reddy S, Sanders TAB. Haematological studies on pre-menopausal
Indian and Caucasian vegetarians compared with Caucasian omnivores. Br J Nutr 1990;64:331–8.
30. Salonen JT, Nyyssönen K, Korpela H, Tuomilehto J, Seppänen R, Salonen R. High stored iron levels are associated with excess risk of myocardial infarction in Eastern Finnish men. Circulation 1992;86:803–11.
31. Freeland-Graves JH, Bodzy PW, Eppright MA. Zinc status of vegetarians. J Am Diet Assoc 1980;77:655–61.
32. Freeland-Graves J. Mineral adequacy of vegetarian diets. Am J Clin
Nutr 1988;48(suppl):859S–62S.
33. Stabler SP, Allen RH, Savage DG. Lindenbaum J. Clinical spectrum
and diagnosis of cobalamin deficiency. Blood 1990;76:871–81.
NUTRITIONAL STATUS OF VEGANS AND NONVEGETARIANS
34. Savage DG, Lindenbaum J, Stabler SP, Allen RH. Sensitivity of serum
methylmalonic acid and total homocysteine determinations for diagnosing cobalamin and folate deficiencies. Am J Med 1994;96:239–46.
35. Miller DR, Specker BL, Ho ML, Norman EJ. Vitamin B-12 status in a
macrobiotic community. Am J Clin Nutr 1991;53:524–9.
36. Gibson RS. Principles of nutritional assessment. New York: Oxford
University Press, 1990.
37. Chandra RK. Serum complement and immunoglobulin in malnutrition. Arch Dis Child 1975;50:225–9.
593S
38. Haller L, Zubler RH, Lambert PH. Plasma levels of complement components and complement haemolytic activity in protein-energy malnutrition. Clin Exp Immunol 1978;34:248–52.
39. Kelley DS, Daudu PA, Branch LB, Johnson HL, Taylor PC, Mackey
B. Energy restriction decreases number of circulating natural killer
cells and serum levels of immunoglobulins in overweight women. Eur
J Clin Nutr 1994;48:9–18.
40. Barone J, Hebert JR, Reddy MM. Dietary fat and natural-killer-cell
activity. Am J Clin Nutr 1989;50:861–7.
Downloaded from www.ajcn.org by on September 16, 2008