Journals prediction of dietary iron absorption an algorithm for calculating absorption and bioavailability of die
Bạn đang xem bản rút gọn của tài liệu. Xem và tải ngay bản đầy đủ của tài liệu tại đây (80.87 KB, 14 trang )
Prediction of dietary iron absorption: an algorithm for calculating
absorption and bioavailability of dietary iron1–3
Leif Hallberg and Lena Hulthén
ABSTRACT
Background: Dietary iron absorption from a meal is determined
by iron status, heme- and nonheme-iron contents, and amounts
of various dietary factors that influence iron absorption. Limited
information is available about the net effect of these factors.
Objective: The objective was to develop an algorithm for predicting the effects of factors known to influence heme- and nonheme-iron absorption from meals and diets.
Design: The basis for the algorithm was the absorption of iron
from a wheat roll (22.1 ± 0.18%) containing no known inhibitors
or enhancers of iron absorption and adjusted to a reference dose
absorption of 40%. This basal absorption was multiplied by the
expected effect of different amounts of dietary factors known to
influence iron absorption: phytate, polyphenols, ascorbic acid,
meat, fish and seafood, calcium, egg, soy protein, and alcohol.
For each factor, an equation describing the dose-effect relation
was developed. Special considerations were made for interactions between individual factors.
Results: Good agreement was seen when measurements of iron
absorption from 24 complete meals were compared with results
from use of the algorithm (r2 = 0.987) and when mean iron
absorption in 31 subjects served a varied whole diet labeled with
heme- and nonheme-iron tracers over a period of 5 d was compared with the mean total iron absorption calculated by using the
algorithm (P = 0.958).
Conclusions: This algorithm has several applications. It can be
used to predict iron absorption from various diets, to estimate the
effects expected by dietary modification, and to translate physiologic into dietary iron requirements from different types of
diets.
Am J Clin Nutr 2000;71:1147–60.
KEY WORDS
Humans, iron absorption, heme iron, nonheme iron, algorithm, diet, meals, bioavailability, iron status,
iron requirements, phytate, polyphenols, ascorbic acid, meat, soy
protein, alcohol, eggs, calcium
INTRODUCTION
Knowledge about the absorption of iron from the diet and
about factors influencing absorption has increased considerably
since the extrinsic tag was introduced to label dietary iron in
meals (1, 2). The amount of iron absorbed from a meal is determined by iron status, the content of heme and nonheme iron, and
the bioavailability of the 2 kinds of iron, which in turn is deter-
mined by the balance between dietary factors enhancing and
inhibiting the absorption of iron, especially nonheme iron (3). It
is well known that the variation in dietary iron absorption from
meals is due more to differences in the bioavailability of the iron,
which can lead to a > 10-fold variation in iron absorption, than to
a variation in iron content.
Therefore, several attempts have been made to devise algorithms to estimate the bioavailability of the dietary iron content
of meals. The aim of the first attempt was to illustrate the fact
that the composition of meals greatly influences the absorption
of dietary nonheme iron (4). Later, attempts were made to
improve the algorithm (5, 6). A simpler method using a score
system to estimate the expected bioavailability of dietary nonheme iron was also suggested (7). In this model, factors inhibiting iron absorption were also considered.
Several dietary factors (eg, ascorbic acid, meat, fish, and poultry) enhance iron absorption, whereas other factors [eg, inositol
phosphates (phytate), calcium, and certain structures in polyphenols] inhibit iron absorption. In the present study, we analyzed
the dose-response relation between amounts of these factors and
their effects on nonheme-iron absorption. All of these factors
must be considered in an algorithm to predict the amount of iron
absorbed from a meal. For almost all of the factors, it has been
possible to develop continuous functions related to the amounts
of each in the meal. Moreover, interactions between different
factors have been examined and considered.
The hypothesis tested in the present algorithm was that the
bioavailability of iron in a meal is a product of all factors present
in the meal that inhibit or enhance iron absorption. A starting point
for the present work was to find a food or meal that contained no
known inhibiting or enhancing components and then use this food
1
From the Institute of Internal Medicine, the Department of Clinical
Nutrition, the University of Göteborg, Annedalsklinikerna, Sahlgrenska University Hospital, Göteborg, Sweden.
2
Supported by the Swedish Medical Research Council (project B94-19X04721-19A), the Swedish Council for Forestry and Agriculture Research
(50.0120/95, 997/881, and 113:3), and the Swedish Dairy Association.
3
Reprints not available. Address correspondence to L Hallberg, Department of Clinical Nutrition, University of Göteborg, Annedalsklinikerna,
Sahlgrenska University Hospital, S-41345 Göteborg, Sweden.
Received January 14, 1999.
Accepted for publication September 9, 1999.
Am J Clin Nutr 2000;71:1147–60. Printed in USA. © 2000 American Society for Clinical Nutrition
1147
1148
HALLBERG AND HULTHÉN
as a basis for evaluating the effects of different factors added in
different amounts. For many years we used, as a control, wheat
rolls made of low-extraction wheat flour and fermented to such an
extent that no inositol phosphates could be detected. Various factors to be tested were added in different amounts to such rolls and
iron absorption was measured from the rolls, when served with or
without a specific factor in known and various amounts, after the
rolls were labeled with 2 different radioiron isotopes. Iron status
in each fasted subject was measured by using the absorption from
a standard reference dose of ferrous iron to describe the iron status of the individuals studied. The reference dose was introduced
by Layrisse et al (8) and the entire procedure was described in
detail (9). Iron absorption can also be related to log serum ferritin
as suggested by Cook et al (10).
Numerous studies on factors influencing the bioavailability of
dietary iron have been published by several research groups (discussed below), in addition to the studies by our group. It has only
been possible, however, to use some of the data from their studies. This is true also for some of the older data from our laboratory. The reason is simply that there is a lack of information
about the content of phytate and sometimes that of polyphenols
in the meals studied.
METHODS
The method used to predict dietary iron absorption is based on
an algorithm containing the value for iron absorption (relative to
40% of the absorption of the reference dose of iron) from a single basal meal ([low-extraction (40%) wheat flour] that contained
no components known to inhibit or enhance iron absorption. This
basal value was then multiplied by factors expressing the effect of
different dietary components present in the meal known to influence iron absorption: phytate, polyphenols, soy protein, calcium,
eggs, ascorbic acid, meat (including fish and seafood), and alcohol. For each factor, an equation was derived that also considered
interactions between components in the meal.
Iron absorption from a basal meal
The basal meal was composed of wheat rolls served with margarine and water on 2 mornings while subjects were in a fasting
state. The rolls were made of a special low-extraction (40%) wheat
flour and the dough was fermented for 2 periods (30 + 10 min)
to ensure that no inositol phosphates could be detected with a
sensitive method (11). The iron content of the rolls was adjusted
to 4.1 mg by adding ferrous sulfate to the dough. The rolls were
labeled with an extrinsic radioiron tracer. Iron absorption was
measured as described previously (9, 12).
The rolls were included in different studies of factors influencing iron absorption. Rolls were served with and without a
factor to be studied in specific amounts and were labeled with
2 different radioiron isotopes (13–15). Iron absorption from
these rolls was measured in 310 subjects (194 female and 116 male
volunteers). In each subject, iron absorption from a reference
dose containing 3 mg Fe as ferrous sulfate, given while subjects
were in a fasting state on 2 consecutive mornings, was also
measured. All absorption values were adjusted to correspond to
an absorption of 40% from the reference dose. Thus, absorption
measurements from the same meal could be pooled from different groups of subjects with different iron statuses. The mean
(± SEM) absorption of iron from the rolls in all studies, adjusted
to a 40% reference dose absorption, was 22.1 ± 0.18%.
Effect of phytate and other inositol phosphates
The effect of different amounts of phytate on iron absorption
was examined when wheat rolls were served with and without
different amounts of added sodium phytate. Seven groups of subjects (n = 63) were studied and the added phosphorus as phytate
(phytate-P) varied from 2 to 250 mg (14). A similar study was
performed in another laboratory in which the basal wheat rolls
contained 10 mg phytate-P (n = 57). Four different amounts of
phytate-P (14–58 mg) were added (16). Because the effect of 10
mg phytate-P was examined in the previous study, it was possible to recalculate the effect of the added phytate-P. The effect of
phytate was similar in the 2 studies. When the data from the
2 studies were pooled, the following relation was found:
Log absorption ratio
(with/without phytate) = Ϫ0.30 ϫ log (1 + phytate-P)
(1)
where phytate-P is in milligrams. The correlation coefficient was
r2 = 0.926 (n = 120). Antilog of the log absorption ratio thus constitutes the phytate factor.
When the content of phytate-P in bread is determined, some
of the inositol phosphates are present in forms with a fewer
number of phosphate groups than the 6 groups present in phytate. In a previous study we found that the total number of phosphate groups bound to inositol, present in a bread, determines
the degree of inhibition (11). This implies that the total
inhibitory effect of inositol phosphates is better expressed as the
number of phosphate groups bound to inositol than as moles of
inositol. (Conversion factor: 1 mg phytate-P = 3.53 mg phytic
acid = 5.56 mol phytic acid.)
Effect of ascorbic acid
Ascorbic acid is a strong promoter of iron absorption, as
shown in several studies (see reference 16 for a review). In an
extensive study by Cook and Monsen (17) in 1977 in which
6 different amounts of ascorbic acid (25–1000 mg) were added
to a semisynthetic meal, a strong relation was seen between log
amounts of ascorbic acid and the log absorption ratio (r2 = 0.958;
n = 25). The counteracting effect of ascorbic acid on phytate and
polyphenols was also reported by other groups (18). In the study
by Cook and Monsen, it was not mentioned whether an inhibitor
was present in the control meals, which showed a very low
absorption of iron (Ϸ0.75%). The enhancing effect of ascorbic
acid is more marked in the presence of phytate or iron-binding
polyphenols. In subsequent studies from the same group using
the same liquid formula, it was noted that vanilla extract had
been added to the formula, probably to improve the taste (19,
20). Recent analyses in our laboratory indicate that vanilla
extracts contain appreciable amounts of iron binding polyphenols (Appendix A). This fact might explain the marked effect of
ascorbic acid in Cook and Monsen’s (17) comprehensive study.
Addition of 100 mg ascorbic acid to the semisynthetic liquid formula increased iron absorption 4.14 times, whereas addition of
the same amount of ascorbic acid to a so-called standard meal
containing meat, potatoes, and milk increased iron absorption by
only 67%. In another study from the same group, addition of
100 mg ascorbic acid to another but similar liquid formula containing 85 mg phytate-P increased iron absorption 3.14 times (20).
These findings suggest that the ability of ascorbic acid to
reduce iron and thus to prevent the formation of less-soluble
ferric compounds is probably an important mechanism of
action for the absorption-promoting effect of ascorbic acid. An
ALGORITHM TO PREDICT DIETARY IRON ABSORPTION
enhancing effect of ascorbic acid on iron absorption, however, was
also seen in the absence of phytate and polyphenols. Addition of
50 mg ascorbic acid, for example, to wheat rolls with no detectable
phytate increased mean iron absorption from 22.4% to 37.6% (14).
These facts are taken into account in an algorithm describing
the expected effect of ascorbic acid in the presence of phytate.
The algorithm was calculated as follows:
1) Even in the absence of inhibitors, ascorbic acid increases iron
absorption in a dose-dependent way: absorption ratio = (1 +
0.01) ϫ ascorbic acid (in mg).
2) The more phytate that is present, the greater the effect of
ascorbic acid. Linear relations were seen between the absorption ratio (with and without ascorbic acid) and log phytate-P.
Five regression lines describing this relation had different
linear slopes for different log amounts of ascorbic acid
(5–500 mg). The squared correlation coefficients for the 5 lines
varied from 0.837 to 0.877. The content of phytate varied
from 0 to 250 mg. The 5 slopes of the regression lines were
related to log amounts of ascorbic acid and showed a best fit
in an exponential equation with an r2 value of 0.995. The following general equation was thus derived:
Absorption ratio = [1 + 0.01 AA (in mg)
+ log phytate-P (in mg) + 1]
ϫ 0.01 ϫ 100.8875 ϫ log (AA+1)
(2)
where AA is mg ascorbic acid and is mg in the meal. This equation
is based on studies in 240 subjects in 24 studies. The enhancing
effect of ascorbic acid was the same in meals with and without
calcium and the same in meals with and without meat. These
observations suggest that the mechanisms of action on iron
absorption are different for ascorbic acid, meat, and calcium.
Effect of polyphenols
In earlier studies it was shown that tea inhibits the absorption
of non-heme iron (21–23). Similarly, coffee (22–24) and red
wines (25, 26) were reported to inhibit iron absorption. This
inhibition was considered to be due to polyphenols present in
these beverages. Addition of tannic acid to a meal was shown to
reduce iron absorption (27). Further studies showed that gallic
acid and tannic acid had identical inhibitory effects on iron
absorption and identical iron binding properties (13). Galloyl
groups with their 3 adjacent hydroxyl groups were found to be
the main, common structure in polyphenols binding iron, probably by a direct chemical binding, especially of ferric iron, and
presumably through the formation of chelates.
The strong binding of ferric iron to galloyl groups explains the
counteracting effect of ascorbic acid on the inhibition of iron
absorption by phenolic compounds. Iron binding polyphenols are
widespread in foods because they occur naturally in a variety of
cereals, vegetables, and spices, and in many beverages such as
wine, coffee, and tea (13, 28). A chemical method for specifically
determining galloyl groups has been designed (29).
The inhibition of iron absorption by coffee is explained
mainly by its content of chlorogenic acid. The binding of iron to
this compound is less strong than the binding of iron to galloyl
groups. The relative inhibition by equimolar amounts of gallic
acid and chlorogenic acid was found to be 1.6:1 (13). In Appendix A, tannic acid equivalents, chlorogenic acid, and total tannic
acid equivalents (the sum of tannic acid and the amount of
chlorogenic acid divided by 1.6) in various foods are reported.
1149
Effect on iron absorption of the contents of polyphenols,
ascorbic acid, and meat in meals
In calculating the effect of tannic acid on iron absorption it
was necessary to consider both the amount of galloyl groups and
the amount of ascorbic acid present in a meal. In studies in which
different known amounts of tannic acid were added to a wheat
roll (range: 5–200 mg), a linear relation was observed when the
log absorption ratio was plotted (absorption with/without tannic
acid) against the log amounts of tannic acid added to the rolls
(13). The following equation (r2 = 0.978 for the mean values)
was based on measurements in 59 subjects:
Log absorption ratio = 0.4515 Ϫ 0.715
ϫ log tannic acid (in mg)
(3)
The slope of this regression line (Ϫ0.715) changed when different amounts of ascorbic acid were added. The regression lines
for different amounts of ascorbic acid converged to the point log
absorption ratio (0.4515) and log tannic acid (0).
The effect of ascorbic acid on the inhibition of iron absorption
by tannins was reported in 2 studies (18, 30). Moreover, in developing the equations we also used recent unpublished data from
our laboratory on the effect of ascorbic acid on the inhibition by
phenolic compounds. Two studies of the effect of meat on the
inhibition by tannic acid were conducted (n = 20 each). Other
studies also showed that Ϸ100 g meat reduced the inhibition by
tannic acid by half (24). The effect of meat on the inhibition by
polyphenols is also included in the equation below.
The effect of polyphenols on iron absorption is expressed in
the following equation, in which the amounts of tannic acid
equivalents (TA; in mg), ascorbic acid (AA; in mg), and meat or
fish (M; in g) in the meal are considered:
Absorption ratio = (1 + 0.01M)
ϫ 100.4515 Ϫ [0.715 Ϫ 0.1825 ϫ log(1 + AA)] ϫ log(1 + TA) (4)
The absorption ratio should be ≤ 1 and corrected to 1 if it is not.
Effect of coffee and tea
Coffee and tea are widely consumed as beverages with meals
or directly after meals. These beverages have a high content of
phenolic compounds and have been shown to strongly inhibit
the absorption of nonheme iron (13, 21, 22, 24). A cup of tea
(Ϸ200 mL) reduces iron absorption by Ϸ75–80%. Variations in
the results of different studies are probably related to the different amounts of phenolic compounds in the tea resulting from differences in the amounts, brands, and steeping time of teas used.
A cup of coffee (Ϸ150 mL) reduces iron absorption by Ϸ60%.
When tea or coffee was served with a meal containing Ϸ100 g
meat, the inhibition of iron absorption was reduced by 50% (24).
This agrees with the first part of equation 4 above (eg, when
M = 100 g, 1 + 0.01M = 2.0).
On the basis of its content of phenolic compounds, coffee is
expected to reduce iron absorption even more than was observed.
It is well known that coffee stimulates the gastric secretion of
hydrochloric acid, which may explain the lower than expected
effect. We tested this possibility by measuring the inhibition of
iron absorption by coffee in patients with pentagastrin-proven
achlorhydria and found that in these patients the inhibitory effect
was twice as high (absorption ratio: 0.19 compared with 0.39) as
that in healthy subjects and corresponded to the content of phenolic compounds in coffee (L Hulthén, L Hallberg, A Killander,
unpublished observations, 1995).
1150
HALLBERG AND HULTHÉN
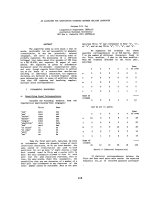
FIGURE 1. Relation between the log calcium content in a meal and the ratio of iron absorption from a meal served with or without different
amounts of calcium. The equation describing the relation is given in the text.
To circumvent the problem encountered when the algorithm
was applied to coffee and tea, because of variations in the content of iron binding polyphenols and different extraction times of
the beverages, we used a factor of 15 mg tannic acid equivalents
for one cup of regular coffee and 30 mg tannic acid equivalents
for one cup of tea. These values apply to beverages consumed
with a meal or up to a few hours after a meal (24). We are aware
that strong coffee may reduce iron absorption even further (eg,
50 mg tannic acid equivalents gives a tannic acid factor of 0.17)
and that other strengths of tea or other kinds of tea may reduce
iron absorption even more. We found for a common green tea,
for example, a tannic acid factor of 0.17 (Appendix A)—a reduction in iron absorption of 83%.
Effect of calcium
A strong dose-effect relation between the amount of calcium
in a meal and the reduction in nonheme-iron absorption has been
observed (15). The relative reduction of iron absorption was the
same for the same amount of calcium given as a calcium salt,
milk, or cheese. No inhibition was seen when the amount of calcium in a meal was < 50 mg (10 mg native and 40 mg added Ca)
and the inhibition was maximal at a content of Ϸ300–600 mg.
Moreover, calcium also inhibited the absorption of heme iron
similarly (31), suggesting a common step in the transport of
these 2 kinds of iron; therefore, the effect was not located in the
intestinal lumen but within the mucosal cell. The observed relation between the absorption ratio (absorption with/without calcium) and the amount of calcium in a meal had a clear sigmoid
curve, suggesting one-site competitive binding at a receptor
(Figure 1). Such a step may be located in the active transport
pathway for calcium (32). An equation was tested describing
such a relation for the present data [n = 7 (mean values);
r2 = 0.9984].
PRISM (version 2.0; Intuitive Software for Science, San
Diego). Iron absorption increased after the addition of ascorbic
acid to a meal containing calcium (33); however, the relative
increase was the same as would have occurred had no calcium
been present.
Effect of meat, poultry, and fish and seafood
Several studies have shown that meat, poultry, and fish and
other seafood increase the absorption of nonheme iron. It was
first noted by Layrisse et al (34). For a review, see reference 3.
Despite numerous studies of the effect of meat on iron absorption by several groups, there is still insufficient information
about the magnitude of the effect of meat in different types of
meals and the possible mechanisms for the absorption-promoting effect of meat and fish.
In developing an algorithm for the effect of meat and fish on iron
absorption, results from several absorption studies were pooled.
The effect was measured as the absorption ratio when meals were
served with and without meat or fish (19, 20, 35–37).The effect of
meat was calculated in the following steps. In the first step, the
effect of meat was measured in meals not containing phytate. The
relation between the amount of meat and the absorption ratio
(r2 = 0.899) was examined in 135 subjects from 15 studies.
Absorption ratio = 1 + 0.00628
ϫ amount of meat and fish (in g)
(6)
In the second step, we analyzed the effect of phytate on the
slope of this relation. In 10 studies in which meat with different
amounts of phytate was served, we found that the factor influencing the slope in the first relation could be expressed as (1 +
0.006) ϫ amount of phytate-P (in mg); r2 = 0.877. The final meat
factor obtained was thus as follows:
(5)
Absorption ratio
(with/without meat) = 1 + 0.00628 ϫ M
ϫ [1 + 0.006 phytate-P (in mg)] (7)
where Ca is the calcium content in the meal (in mg). The calculations are based on the computer program GRAPHPAD
where M is meat, fish, and seafood expressed as grams of
uncooked food. According to the previous model of Monsen and
Absorption ratio = 0. 4081 + Ά[0.6059/1
+ 10Ϫ[2.022 Ϫ log (Ca + 1)] ϫ 2.919]·
ALGORITHM TO PREDICT DIETARY IRON ABSORPTION
Balintfy (5), 1.3 g raw weight is equivalent to 1.0 g cooked
weight of meat, poultry, and fish.
Several investigators examined the effect of both meat and
fish but direct comparisons have not been reported. The balance
of evidence suggests that meat and fish are interchangeable in
this equation. Meat has the clear nutritional advantage because it
also provides considerable amounts of heme iron.
Effect of soy protein
In several studies it was observed that soy protein reduced the
fraction of iron absorbed from a meal (38, 39). The high content
of phytate in soy products led the researchers to suspect that the
inhibition by soy might be related to phytate. Reduction of the
phytate content by repeated washings with acidic solutions, however, did not totally abolish the inhibition (39, 40).
In a recent comprehensive study in which almost all of the
phytate in soy was removed by enzymatic degradation with a
phytase, however, the inhibition by soy proteins was markedly
reduced (41). Four groups of subjects were studied (n = 32). Iron
absorption was measured from semisynthetic meals, each containing 30 g protein as soybean-protein isolates or egg white as
a control. A significant inhibitory effect on iron absorption by
soy protein remained. The egg white contained 96 mg Ca/meal
compared with 19.2, 27.4, and 44 mg Ca/meal in the soybeanprotein isolates. It can be estimated from Equation 5 that the
higher calcium content in the control meals would reduce iron
absorption by 25%. The average absorption ratio of iron from the
soy meals and the control meals was 0.33 after correction for the
higher calcium content in the control meals. The inhibitory effect
on iron absorption per gram of soy protein (x) would thus be as
follows: 1 Ϫ 30x = 0.33. Solving the equation gives x = 0.022
and the soy-factor absorption ratio would thus be as follows:
Absorption ratio = 1Ϫ 0.022 ϫ soy protein (in g)
(8)
This equation is valid up to Ϸ20 g soy protein. For a hamburger that might contain a commercial soy-protein isolate
containing phytate, it is necessary to consider in the algorithm
the amounts of pure meat, soy protein, and phytate-P present
in the hamburger.
Effect of eggs
In an early study of the effect of eggs on iron absorption in
28 humans, white-wheat bread was given with eggs together
with coffee or tea (42). A reference dose (5 mg Fe) was also
given in this study. It is possible to estimate iron absorption
from this meal corresponding to a reference dose absorption of
40%. About 16% could be estimated to have been absorbed had
tea or coffee not been fed. Relating this absorption to 22.1%
absorption from the basal wheat-roll meal (see above) at the
same iron status, the egg factor would be 16/22 = 0.73, ie, a
reduction in iron absorption of 27%.
In our studies of iron absorption from different breakfast
meals, the introduction of a boiled egg reduced the absorption
by 28%, from 9.3% to 7.6% in 12 subjects (43). In one of the
studies by Cook and Monsen (35), powdered eggs were fed to
10 subjects in an amount corresponding to 2.9 eggs, each
weighing 60 g. When eggs are substituted for other proteins in
a standard meal, the absorption ratio with or without eggs was
reduced to 0.22 (a reduction of 78%). For one egg this corresponds to a reduction of 27% (0.78/2.9 = 0.27). The results on
the inhibiting effects of eggs by different groups are thus aston-
1151
ishingly consistent. The effect of eggs has been studied in a
total of 50 subjects.
When the data were pooled assuming a proportional inhibition
of iron absorption to the amount of eggs included in a meal, the
following equation was derived:
Absorption ratio = 1Ϫ 0.27 ϫ number of eggs
(9)
The number of eggs can also be expressed as grams (one
egg = 60 g). Equation 9 is valid only for ≤ 3 eggs/meal. Check
that the absorption ratio for eggs is not < 0.2 (equivalent to the
inhibition by 3 eggs).
Effect of alcohol
Studies in humans have shown that alcohol increases the
absorption of ferric but not of ferrous iron (44). This increase has
been attributed to an enhancement of gastric acid secretion. In a
study serving a hamburger meal with or without 23.8 g alcohol
(as a 40% solution), a statistically significant 23% increase in
iron absorption was seen when alcohol was given with the meals
(23). When the same meal was served with red wine, no significant increase was seen, possibly because of the simultaneous
inhibiting effect of iron binding polyphenols present in red
wine. In a study of the effect of different wines on iron absorption, a dinner roll was served with or without different wines,
some of which had a markedly reduced alcohol content because
of vacuum distillation (26). Adjustment for differences in iron
status made it possible to make 4 pairwise comparisons of iron
absorption from meals served with the same type of wine but
with different alcohol contents (low or high). The mean absorption ratio between the meal with the low-alcohol compared with
the high-alcohol content was 1.33 ± 0.14 (P = 0.039). The
amount of alcohol served with the rolls was 12.6 g, which was
about half the amount served with the hamburger meals mentioned above (23). Assuming that the effect of alcohol is related
to stimulation of gastric acid secretion, it is possible that with a
meal containing meat, more acid is formed than when a bread
roll is served. The further stimulation of gastric secretion by
alcohol may thus be lower from a full meal than from the meal
containing only a roll. The studies strongly indicate, however,
that alcohol also enhances iron absorption from composite
meals (23). After careful consideration, we provisionally
decided to use a single factor of 1.25 for the stimulation of iron
absorption by alcohol. We also provisionally decided to use this
factor for meals consumed together with, for example, 1–2 glasses
of wine or 1–2 alcoholic beverages. The inhibitory effect of red
wine on iron absorption, related to the content of iron binding
polyphenols, should be considered separately in the calculation
of the tannic acid factor.
Effect of other factors
It is reasonable to assume that there are other factors in meals
influencing iron absorption that have not been considered in the
present algorithm. For example, some soy sauces may enhance
iron absorption (45), whereas some flavonoids, especially
myricetin, may inhibit iron absorption. Myricetin has a molecular structure similar to that of the galloyl group in polyphenols,
which we know inhibits iron absorption via chelation with ferric
iron. In our food analyses, we based the inhibiting effect of
polyphenols on the content of such groups. Flavonoids with a
similar structure may therefore be expected to have the same
inhibitory effect on iron absorption (13, 29).
1152
HALLBERG AND HULTHÉN
Formula for log heme-iron absorption and the computer
program
Iron absorption from single meals
The formula is the product of the basal factor 22.1 multiplied
by one or more of the 8 dietary factors present in each meal: the
phytate factor, the ascorbic acid factor, the polyphenol factor (or,
tannic acid factor), the calcium factor, the meat factor, the soyprotein factor, the egg factor, and the alcohol factor. The value
obtained is thus the percentage absorption of the nonheme iron
present in a meal at an iron status corresponding to a reference
dose absorption of 40%. The percentage absorption of heme iron
was adjusted to the same iron status by using a formula presented in a previous study (46).
Log heme-iron absorption (%) = 1.9897 Ϫ 0.3092
ϫ log serum ferritin
(10)
Heme-iron absorption is then corrected for the content of calcium in the meal by using the same calcium factor as used for
nonheme-iron absorption (see above) (31).
To obtain the amount of iron absorbed from a meal, the percentage absorption of nonheme and heme iron have to be multiplied by the amounts of the 2 kinds of iron present in the meal.
For nonheme iron it is important to consider any fortification
iron present in the meal and to what extent this iron is potentially
bioavailable. Similarly, if food components are contaminated
with iron (eg, from soil), the fraction of such iron that is potentially absorbable (or, exchangeable with an extrinsic radioiron
tracer) should be considered. A method is available to quantify
this fraction (47). In Appendix A, the fraction of heme iron present in different kinds of meat and meat products is provided.
Iron absorption from the whole diet
The amount of iron absorbed from the whole diet is obtained by
summing the amounts of iron absorbed from all the single meals
and snacks for a certain period of time, eg, a single day or several
days. Potential interference between meals is discussed below.
Use of computer programs for the calculations
We used Microsoft’s EXCEL program (Redmond, WA) for the
calculations. To avoid problems with calculating some of the factors based on logarithmic functions, we used a value of 1 in
equations 1, 3, 4, and 7. In equation 4, an absorption ratio > 1 had
to be changed to 1.
Validation studies
The validity of the present algorithm was examined in 2 ways.
In study 1, the observed absorption of nonheme iron from 24 single meals in 3 previous studies (43, 48, 49) was compared with
the absorption values estimated by using the algorithm. These
3 studies were performed > 15 y ago. At that time, no sufficiently
sensitive method for measuring small amounts of phytate and no
specific method for measuring iron binding polyphenols was
available. At the time of the studies, for example, we were not
aware of the rather high contribution of phytate from potatoes in
many meals (200 g potato contains 14 mg phytate-P) or of the
fact that commercial products for making mashed potatoes also
contained appreciable amounts of calcium from dried milk powder. Similarly, the content of polyphenols in different vegetables,
spices, and beverages was not known, nor were the effects of
polyphenols on iron absorption. New analyses had to be per-
formed to estimate the probable contents of phytate, polyphenols, ascorbic acid, and calcium in the meals. The variation in
contents of iron and energy and amounts of nonheme iron
absorbed from the 24 meals are provided in Table 1.
In study 2, a comparison was made between the estimated
total amount of iron absorbed by using the algorithm in 31 men
served 4 different meals for 5 d and the actual total iron absorption measured in these men by using 2 radioiron tracers. One
tracer was given as intrinsically labeled radioiron to label hemoglobin and the other as inorganic iron to label nonheme iron. All
meals were labeled with the 2 tracers to ensure a homogenous
specific activity of both nonheme and heme iron in all meals.
The total absorption of heme and nonheme iron was determined
by using a whole-body counter to determine 59Fe and a blood
sample to analyze the ratio of 55Fe to 59Fe. The method used and
the menus given were described in detail previously (46, 50, 51).
RESULTS
Study 1
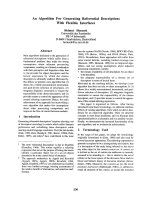
The result of the comparison of observed and calculated nonheme-iron absorption is shown in Figure 2. The main finding
was the remarkably good agreement between observed and estimated nonheme absorption. The observed mean (± SEM) percentage absorption of nonheme iron in the 24 meals was
12.91 ± 1.84% and the corresponding value for the absorption
calculated by using the algorithm was 13.33 ± 1.95%. There was
no significant difference between the mean values. The correlation coefficient was high and the slope of the regression line was
not significantly different from the line of equality. We also
made the interesting observation that minor food components,
such as a correct amount of calcium (cheese, vegetables, and
milk) or a correct value for phytate content had a marked effect
on the absorption calculated. The same was true for the amount
of ascorbic acid served. Detailed knowledge of meal composition is thus essential to achieve reasonably good estimates of the
iron absorption by using the algorithm. The average compositions of the 24 meals in studies 1 and 2 are shown in Table 2.
Study 2
The calculated iron absorption from the 20 different meals
varied considerably between meals and days as shown in Table 3.
The composition of these meals was also described in detail previously (51). Among the 31 men, there were 4 patterns in the
choice of beverages (coffea, tea, and water) with the breakfast
meals and the evening snacks; therefore, analyses were conducted separately in these 4 groups.
With the algorithm, the absorption of heme and nonheme iron
from each meal was calculated separately and summed for the
whole period. Nonheme-iron absorption in each subject was that
expected at an iron status corresponding to a reference dose of
40%. For each individual, nonheme-iron absorption was then
adjusted to the individual serum ferritin concentration and body
weight according to equation 11 (see below). The individual
amounts of heme-iron absorption expected were calculated by
using equation 10. The calculated total amounts of iron absorbed
in the 31 subjects were then obtained by adding the amounts of
heme- and nonheme-iron absorption calculated in all meals. These
figures were then compared with the actual absorption obtained
when total iron absorption was measured directly. It was thus possible to compare the observed amounts of iron absorbed with the
ALGORITHM TO PREDICT DIETARY IRON ABSORPTION
1153
TABLE 1
Study 1: observed absorption of nonheme iron before and after adjustment to a reference dose absorption of 40%, and the calculated absorption with the
algorithm1
Type of meal
and reference2
Galician meat soup (48)
Spaghetti with cheese (48)
Hamburger meal (48)
Soup, steak, and kidney pie (48)
Pizza (48)
Vegetable soup (48)
Pancake and jam (49)
Breakfast basal (43)
Breakfast + orange juice (43)
Breakfast + egg (43)
Breakfast + egg + bacon (43)
Breakfast + corn flakes (43)
Sauerkraut + sausage (43)
Beetroot soup + meat (51)
Sole au gratin (49)
Brown beans + pork (49)
Roast beef meal (49)
Spaghetti with meat sauce (51)
Cod (48)
Gazpacho and chicken (48)
Meatballs (49)
Shrimp and beef (48)
Antipasti misti and meat (48)
Vegetarian meal “low” (48)
1
2
Observed
Iron absorption
Adjusted to 40% of
reference dose absorption
Algorithm
calculation
kcal (kJ)
mg (%)
mg (%)
%
980 (4100)
1020 (4268)
1030 (4310)
1010 (4226)
1040 (4351)
1010 (4226)
630 (2636)
320 (1339)
390 (1632)
405 (1695)
410 (1715)
555 (2322)
470 (1966)
300 (1235)
330 (1381)
750 (3138)
480 (2008)
600 (2510)
1050 (4393)
1040 (4351)
600 (2510)
980 (4100)
1150 (4812)
730 (3054)
0.96 (13.4)
0.54 (11.0)
0.54 (13.8)
1.09 (19.2)
0.38 (9.0)
0.50 (7.2)
0.09 (1.7)
0.21 (7.6)
0.25 (8.0)
0.31 (7.6)
0.30 (7.1)
0.19 (5.4)
0.91 (45.8)
0.85 (30.3)
0.39 (18.7)
0.22 (4.0)
0.36 (11.6)
0.31 (11.3)
0.63 (8.1)
1.10 (14.5)
0.19 (5.4)
0.95 (15.3)
1.55 (18.0)
0.14 (2.5)
1.16 (16.2)
0.59 (12.1)
0.48 (12.2)
1.08 (18.9)
0.33 (7.9)
0.55 (7.9)
0.18 (3.3)
0.16 (5.7)
0.40 (12.9)
0.19 (4.6)
0.25 (6.0)
0.16 (4.4)
0.90 (45.0)
0.81 (29.1)
0.38 (18.0)
0.43 (7.8)
0.58 (18.7)
0.31 (11.1)
0.80 (10.4)
1.35 (17.6)
0.29 (11.1)
0.94 (15.1)
1.80 (23.1)
0.13 (2.3)
17.2
11.6
13.0
18.9
9.6
8.0
3.2
5.0
13.1
3.6
5.9
3.1
41.4
26.4
18.2
5.5
17.7
12.5
10.9
17.1
10.6
14.0
23.0
0.4
Nonheme
iron
Energy
mg
7.2
4.9
3.9
5.7
4.2
7.0
5.1
2.8
3.1
4.1
4.2
3.6
2.0
2.8
2.1
5.4
3.1
2.7
7.8
7.6
2.6
6.2
7.8
5.8
The study included 24 meals. Details of meals are described in individual references.
“Breakfast” encompasses coffee, white-wheat bread, margarine, cheese, and marmalade.
amounts estimated by using the algorithm (Table 4). The mean
total iron absorption obtained with the 2 methods was not statistically different on the basis of a t test; the difference between the
means with both methods was only 0.06 mg (or 3.4%) and was not
statistically significant (t = Ϫ0.588, P = 0.561).
Application of the algorithm for different levels of iron status
The present calculations are based on absorption values
adjusted to a reference dose absorption of 40%. Because the relation between reference dose absorption and log serum ferritin is
known, it is possible to convert the algorithm to any iron status
(Appendix A).
Iron absorption (mg) = iron absorption (alg mg)
ϫ 230.94/SF (g/L)
(11)
where iron absorption (alg mg) is the absorption calculated (mg)
by using the algorithm, ie, at a reference dose absorption of 40%,
and SF is serum ferritin.
DISCUSSION
It has been nearly 20 y since the first simple algorithm for estimating iron absorption was published (4). Since then, much new
knowledge has accumulated about dietary iron absorption, as
emphasized in a recent review (52). It is thus probable that new
information will lead to modifications of the present algorithm.
Instead of waiting for the “final version,” we developed an algo-
rithm based on as much present knowledge as possible and we
think the present algorithm has many practical applications.
Note that the method of measuring iron absorption from the
whole diet with tracers has been validated. In each subject, a
comparison was made between the absorption measured and iron
requirements. In men, requirements were calculated from body
weight and in women from body weight and measured menstrual
losses of iron (53). The comparison in study 1 clearly showed
that iron absorption estimated with the algorithm agreed well
with measured iron absorption.
Nonheme-iron absorption was estimated for the 24 meals in
study 1 by using the 2 previously published algorithms, in which
effects of both enhancers and inhibitors were included. In the earliest study (7), there was a significant relation between observed
and estimated absorption (r2 = 0.192, P = 0.032). There was also a
significant relation between observed and estimated nonheme-iron
absorption (r2 = 0.256, P = 0.0116) when a more recent algorithm
was used (6). These correlation coefficients are thus considerably
lower than that obtained with the present algorithm (r2 = 0.987) for
estimated and observed nonheme-iron absorption. Probable reasons are that, in contrast with the 2 previous algorithms mentioned,
the present algorithm 1) is based on continuous variables for content of enhancers and inhibitors, 2) takes into consideration interactions between factors, and 3) includes more factors. In study 2,
the same mean heme- and nonheme-iron absorption values were
seen despite the expected markedly varying bioavailability of iron
in the 20 different meals included (Table 3).
1154
HALLBERG AND HULTHÉN
FIGURE 2. Relation between observed and estimated nonheme-iron absorption in study 1 with use of the algorithm. Data reflect the mean values
from 24 studies in 243 subjects. y = 0.43 + 0.94x; r2 = 0.987
An important difference between the 2 validation studies was
that each absorption value in study 1 was the mean of 10 subjects
(observed and calculated by using the algorithm; Table 1), whereas
each absorption value in study 2 was the mean of 31 subjects measured over 5 d (Table 4). In study 1 the slope of the regression line
did not differ from the identity line and there were no statistically
significant differences between observed absorption and absorption
estimated by using the algorithm at the same iron status. In study
2, the total amounts of observed and calculated (algorithm) iron
absorbed from the whole diet were not significantly different after
adjustment to the same iron status (Table 4).
Effect of meal size and iron content of meals
It may seem obvious that the size of a meal should be taken
into account in an algorithm for estimating iron absorption. A cer-
tain amount of ascorbic acid, for example, should be expected to
have a greater effect in a small meal than in a large meal because
the concentration would be higher in the small meal. Meal size,
however, is an ambiguous concept because it can be interpreted in
terms of volume, weight, or content of energy or iron. The concentration of a nutrient may also be influenced by the amount of
beverage consumed with the meal. Another factor that can influence absorption is the rate of gastric emptying and, in turn, the
volume of the meal and its fat content. Meal size as well as body
size can influence the absorption of iron from a specific meal;
however, we did not observe either in our adult volunteers.
There was almost a 4-fold variation in the content of both
energy and iron and a 3-fold variation in nutrient density (nonheme iron/energy) in the meals in study 1 (Table 1). Despite
these variations, the relation between calculated and observed
TABLE 2
Descriptive characteristics of the 24 different meals included in study 1 and the 20 different meals included in study 2
Energy (MJ)
Nonheme iron (mg)
Heme iron (mg)
Total iron (mg)
Ascorbic acid (mg)
Meat and fish (g)
Calcium (mg)
Phytate phosphorus (mg)
Tannic acid equivalents (mg)
Eggs (n)
Soy
Alcohol factor
–x ± SD
Study 1
Median
Range
–x ± SD
Study 2
Median
Range
3.03 ± 1.21
4.74 ± 1.92
0.38 ± 0.44
5.07 ± 1.93
15.9 ± 23.8
59.6 ± 53.3
171.8 ± 160.5
26.8 ± 56.3
13.8 ± 23.1
0.21 ± 0.388
0
1.03 ± 0.08
2.85
4.2
0.1
4.6
4
60
130
8
4
0
—
1
1.26–4.81
2–7.8
0–1.2
2.2–8.4
0–85
0–175
0–600
0–271
0–100
0–1
—
0.73–1
2.52 ± 0.46
2.75 ± 1.32
0.73 ± 0.83
3.48 ± 1.95
23.2 ± 29.0
68 ± 71.2
226 ± 183
18.3 ± 10.5
28.9 ± 33.1
0
0
1.0
2.51
2.2
0.2
2.63
5
55
229.5
12.8
19.5
—
0
—
1.63–3.26
1.2–5.1
0.04–2.7
1.25–6.8
0–95
0–175
30–409
11.4–52
0–80
—
—
—
ALGORITHM TO PREDICT DIETARY IRON ABSORPTION
TABLE 3
Total amounts of heme and nonheme iron absorbed from different meals
on different days in Study 2 in 11 of the 31 subjects having an identical
pattern in the consumption of beverages with the meals
Day
Breakfast
Heme- + nonheme-iron absorption (mg)
Lunch
Dinner
Evening
Whole day
mg
1
2
3
4
5
–x
Median
SD
CV
0.082
0.045
0.076
0.055
0.076
0.067
0.076
0.0159
23.8
1.87
1.32
1.51
2.01
1.39
1.62
1.51
0.304
18.8
2.66
1.11
1.11
2.09
1.84
1.76
1.84
0.665
37.8
0.083
0.082
0.058
0.081
0.098
0.080
0.082
0.014
17.8
4.70
2.56
2.75
4.24
3.40
3.53
3.40
0.925
26.2
absorption was more similar than we had expected. Thus, the
balance of evidence indicates that meal size per se had no major
systematic effect on the validity of the algorithm. The algorithm
may need modification when used in infants and small children.
In a recent study, however, direct comparison of iron absorption
from a formula given to adults and infants showed no difference
in absorption (54). Moreover, a 3-fold increase in meal size (and
iron content) in adults did not change fractional iron absorption
(54). It is thus reasonable to assume that the algorithm will also
be useful in infants.
A linear relation was observed between log amounts of iron
administered and log amounts of iron absorbed (see references
55 and 56 for a review). Most of these studies used therapeutic
doses of iron or pure iron solutions; iron given with food seems
to behave differently. In one of our early studies, we found that
the percentage iron absorption from a meal was the same despite
an almost 5-fold difference in iron content (57). This result is
thus compatible with the results mentioned above (54), probably
because the concentration of iron in the gastrointestinal lumen is
many times lower when a certain amount of iron is present in a
meal than when the iron is provided as a salt without food.
Iron absorption from single meals compared with that from
the whole diet
To estimate iron absorption from the whole diet, absorption
measurements from all the single meals consumed over a certain
time period are summed. Almost all studies of factors influencing iron absorption are based on single meals served in a fasting
state, with and without a factor to be studied given in different
amounts. Note that direct measurements have shown that a
preceding meal has no effect on the absorption of iron from a subsequent meal. In studies of 4 diets, it was shown that iron absorption from a meal served in the morning after an overnight fast was
the same as that from a meal eaten during the day at lunch or supper (58). Similarly, we found that iron absorption was the same
from a hamburger meal served in the morning or after breakfast
(with or without added calcium) 2 or 4 h earlier (59).
It has been suggested that the variation in iron absorption
from single meals under laboratory conditions would exaggerate
the variation in iron absorption from the whole diet (7). The variation in iron absorption between single meals of different compositions may be much greater than the variation in iron absorp-
1155
tion from whole diets composed of several single meals. The iron
content and bioavailability of single meals varies markedly,
whereas iron absorption from whole diets is the mean absorption
of several single meals. The expected lower variation in iron
absorption from the whole diet than from single meals was documented previously (7) and in the 3 studies of iron absorption
from whole diets in our laboratory (46, 50, 51).
Some investigators seem to have misinterpreted these results
and assumed that the absorption of iron from single meals per se,
for some unknown reason, would be falsely high or low. The
present result that the sum of the calculated iron absorption from
4 different meals served for 5 d (ie, 20 meals in 31 men for a
total of 620 meals) did not differ significantly from that obtained
from meals in which heme and nonheme iron were homogenously labeled with 2 different tracers, clearly indicates the
validity of basing total dietary iron absorption on the sum of iron
absorption from single meals. This issue was also discussed in
our previous review (53).
Some applications of the algorithm
The algorithm can be used to evaluate the nutritional value of
meals with respect to iron, for example, in school-lunch programs,
in catering programs for the elderly, and for military services. The
algorithm may be used to translate data from dietary surveys into
amounts of iron expected to be absorbed. The main requirement
for such calculations is that detailed information is available about
the meal composition and its variation over a representative and
sufficiently long period of time. A 7-d record, for example, may
not represent the iron absorption from the habitual diet.
The algorithm can be used to estimate the expected effects of
different dietary modifications that can be considered realistic
in both developed and developing countries. In developed
countries, the main concerns are low energy expenditure and,
thus, low energy intakes. To adequately provide for high iron
needs, especially in infants, adolescents, and menstruating
women, a high nutrient density and a high bioavailability is
required. The algorithm can also be used to examine the overall effects of a higher extraction of flour (increasing the intake
of both intrinsic phytate and iron) on bioavailability and iron
content. It can be used to estimate the expected effects of iron
TABLE 4
Iron absorption from the whole diet1
Calculated absorption
from the algorithm
At 40% of the Adjusted
Iron reference dose to actual
intake absorption2 iron status3
mg
Nonheme iron
Heme iron
Total
11.0
2.94
13.94
mg
2.61
1.05
3.65
Observed
absorption3
mg
1.24 ± 0.22
0.52 ± 0.02
1.77 ± 0.19
1.23 ± 0.19
0.52 ± 0.03
1.76 ± 0.21
1
n = 31 healthy men. Absorption was calculated by using the algorithm.
The original calculation is based on an iron status corresponding to a reference dose absorption of 40%. For each subject, this absorption was then
adjusted to the individual iron status based on the serum ferritin concentration and was compared with the actual observed absorption by using
whole-body counting (see text).
2–
x.
3–
x ± SEM.
1156
HALLBERG AND HULTHÉN
fortification or increased intakes of fruit, vegetables, and meat
in the diet. In developing countries, the problems are similar
but the knowledge about the chemical composition of foods
and its variation is even more limited; for example, knowledge
is limited about the contents of phytate and iron binding
polyphenols in common foods, including spices and condiments. Evaluation of the expected effects on iron absorption
and iron balance resulting from modification of food-preparation methods may also be required.
An important use of the algorithm would be to translate physiologic iron requirements into dietary requirements under different dietary conditions known to prevail in a certain population.
In the Food and Agriculture Organization/World Health Organization recommendations, 3 levels of bioavailability (5%, 10%,
and 15%) were used arbitrarily for this translation (60). The
validity of choices of representative bioavailability values can be
tested by using the algorithm. It is obvious from the present
results that there is marked variation in the bioavailability of different types of diets in developed countries. The recommended
dietary allowances (61) for different groups of subjects with different physiologic iron requirements should, therefore, not be
given as single values, but rather as 3–4 values adjusted for different types of diets (eg, vegan or vegetarian, low-meat, and high
meat). The algorithm can then be used to make rough estimates
of the bioavailability of diets in some groups in the population
with different dietary habits. The algorithm may be useful in the
future search for realistic recommendations to be used in foodbased strategies to improve iron nutrition in developing countries. However, more knowledge about the composition and
properties of diets in developing countries is needed.
In the screening for unknown dietary factors influencing iron
absorption, new starting points can be obtained by comparing
actual absorption values from a certain meal with absorption values estimated from the content of presently known factors. A
significant discrepancy would indicate that some unknown nutritionally important factor is present.
Importance of correct values for the factors included in the
algorithm
One problem with the application of the algorithm is limited
knowledge about the content of factors such as phytate and iron
binding polyphenols in different foods. An extensive report on
the phytate content in foods was published previously (62). Note
that even low phytate contents play an important role in the
bioavailability of iron, but are often not detectable with the current method used by the Association of Official Analytical
Chemists, which was used in that report. A simple modification
of the current method of the Association of Official Analytical
Chemists was made to determine low phytate contents in foods
and was calibrated against HPLC (11).
Another practical problem in applying the algorithm is the
difficulty in estimating the ascorbic acid content in a meal at the
time of consumption because cooking times and food-preparation methods markedly influence the final phytate content. In
Appendix A, we provide data for some common foods. Appendix A also contains data from our laboratory about the content
of total iron and heme iron in different kinds of meat. More
detailed food-composition tables are needed. The lack of
knowledge of the presence of different factors in different foods
is even more obvious when the algorithm is applied to diets in
developing countries.
REFERENCES
1. Hallberg L, Björn-Rasmussen E. Determination of iron absorption
from whole diet. A new two-pool model using two radioiron isotopes
given as haem and non-haem iron. Scand J Haematol 1972;9:193–7.
2. Cook JD, Layrisse M, Martinez-Torres C, Walker R, Monsen E,
Finch CA. Food iron absorption measured by an extrinsic tag. J Clin
Invest 1972;51:805–15.
3. Hallberg L. Bioavailability of dietary iron in man. Annu Rev Nutr
1981;1:123–47.
4. Monsen ER, Hallberg L, Layrisse M, et al. Estimation of available
dietary iron. Am J Clin Nutr 1978;31:134–41.
5. Monsen ER, Balintfy JL. Calculating dietary iron bioavailability,
refinement and computerization. J Am Diet Assoc 1982;80:307–11.
6. Tseng M, Chakraborty H, Robinson DT, Mendez M, Kohlmeyer L.
Adjustment for iron intake for dietary enhancers and inhibitors in
population studies: bioavailable iron in rural and urban residing
Russian women and children. J Nutr 1997;127:1456–68.
7. Cook JD, Dassenko SA, Lynch SR. Assessment of the role of non
heme-iron availability in iron balance. Am J Clin Nutr 1991;
54:717–22.
8. Layrisse M, Cook JD, Martinez-Torres C, Roche M, Kuhn IN,
Walker RB. Food iron absorption: a comparison of vegetable and
animal foods. Blood 1969;33:430–43.
9. Magnusson B, Björn-Rasmussen E, Rossander L, Hallberg L. Iron
absorption in relation to iron status. Model proposed to express
results of food iron absorption measurements. Scand J Haematol
1981;27:201–8.
10. Cook JD, Lipschitz DA, Miles LEM, Finch CA. Serum ferritin as a
measure of iron stores in normal subjects. Am J Clin Nutr 1974;
27:681–7.
11. Brune M, Rossander-Hultén L, Hallberg L, Gleerup A, Sandberg AS. Iron absorption from bread in humans: inhibiting effects of cereal
fiber, phytate and inositol phosphates with different numbers of
phosphate groups. J Nutr 1992;122:442–9.
12. Hallberg L. Food iron absorption. In: Cook JD, ed. Methods in
hematology. Vol 1. London: Churchill, 1980:116–33.
13. Brune M, Rossander L, Hallberg L. Iron absorption and phenolic
compounds: importance of different phenolic structures. Eur J Clin
Nutr 1989;43:547–58.
14. Hallberg L, Brune M, Rossander L. Iron absorption in man: ascorbic acid and dose-dependent inhibition by phytate. Am J Clin Nutr
1989;49:140–4.
15. Hallberg L, Brune M, Erlandsson M, Sandberg AS, RossanderHulthén L. Calcium: effect of different amounts on nonheme- and
heme-iron absorption in man. Am J Clin Nutr 1991;53:112–9.
16. Hallberg L, Brune M, Rossander L. Effect of ascorbic acid on iron
absorption from different types of meals. Studies with ascorbic-acidrich foods and synthetic ascorbic acid given in different amounts
with different meals. Hum Nutr Appl Nutr 1986;40A:97–113.
17. Cook JD, Monsen ER. Vitamin C, the common cold, and iron
absorption. Am J Clin Nutr 1977;30:235–41.
18. Siegenberg D, Baynes RD, Bothwell TH, et al. Ascorbic acid prevents the dose-dependent inhibitory effects of polyphenols and phytates on nonheme-iron absorption. Am J Clin Nutr 1991;53:537–41.
19. Hurrell RF, Lynch SR, Trinidad TP, Dassenko SA, Cook JD. Iron
absorption in humans: bovine serum albumin compared with beef
muscle and egg white. Am J Clin Nutr 1988;47:102–7.
20. Reddy MB, Hurrell RF, Juillerat MA, Cook JD. The influence of
different protein sources on phytate inhibition of nonheme-iron
absorption in humans. Am J Clin Nutr 1996;63:203–7.
21. Disler PB, Lynch SR, Charlton RW, et al. The effect of tea on iron
absorption. Gut 1975;16:193–200.
22. Derman D, Sayers M, Lynch SR, Charlton RW, Bothwell TH. Iron
absorption from a cereal-based meal containing cane sugar fortified
with ascorbic acid. Br J Nutr 1977;38:261–9.
23. Hallberg L, Rossander L. Effect of different drinks on the absorption of non-heme iron from composite meals. Hum Nutr Appl Nutr
1982;36A:116–23.
ALGORITHM TO PREDICT DIETARY IRON ABSORPTION
24. Morck TA, Lynch SR, Cook JD. Inhibition of food iron absorption
by coffee. Am J Clin Nutr 1983;37:416–20.
25. Bezwoda WR, Torrance JD, Bothwell TH, Macphail AP, Graham B,
Mills W. Iron absorption from red and white wines. Scand J Haematol 1985;34:121–7.
26. Cook JD, Reddy MR, Hurrell RF. The effect of red and white wines on
nonheme-iron absorption in humans. Am J Clin Nutr 1995;61:800–4.
27. Gillooly M, Bothwell TH, Torrance JD, et al. The effect of organic
acids, phytates and polyphenols on absorption of iron from vegetables. Br J Nutr 1983;49:331–42.
28. Harborne JB. Plant phenolics. Encycl Plant Physiol 1980;8:329–402.
29. Brune M, Hallberg L, Skånberg A-B. Determination of iron-binding
phenolic groups in foods. J Food Sci 1991;56:131–67.
30. Tuntawiroon M, Sritongkul N, Brune M, et al. Dose-dependent
inhibitory effect of phenolic compounds in foods on nonheme-iron
absorption in man. Am J Clin Nutr 1991;53:554–7.
31. Hallberg L, Rossander-Hulthén L, Brune M, Gleerup A. Inhibition of
haem-iron absorption in man by calcium. Br J Nutr 1992;69:533–40.
32. Bronner F. Intestinal calcium absorption: mechanisms and applications. J Nutr 1987;117:1347–52.
33. Hallberg L, Rossander-Hulthén L, Brune M, Gleerup A. Calcium
and iron absorption: mechanism of action and nutritional importance. Eur J Clin Nutr 1992;46:317–27.
34. Layrisse M, Martinez-Torres C, Roch M. Effect of interaction of
various foods on iron absorption. Am J Clin Nutr 1968;21:1175–83.
35. Cook JD, Monsen ER. Food iron absorption in human subjects. III.
Comparison of the effect of animal proteins on nonheme iron
absorption. Am J Clin Nutr 1976;29:859–67.
36. Björn-Rasmussen E, Hallberg E. Effect of animal proteins on the
absorption of food iron in man. Nutr Metab 1979;23:192–202.
37. Hallberg L, Rossander L. Improvment of iron nutrition in developing countries: comparison of adding meat, soy protein, ascorbic
acid, citric acid, and ferrous sulphate on iron absorption from a simple Latin American-type of meal. Am J Clin Nutr 1984;39:577–83.
38. Cook JD, Morck TA, Lynch SR. The inhibitory effect of soy products
on nonheme iron absorption in man. Am J Clin Nutr 1981;34:2622–9.
39. Hallberg L, Rossander L. Effect of soy protein on nonheme iron
absorption in man. Am J Clin Nutr 1982;36:514–20.
40. Morck TA, Lynch SR, Cook JD. Reduction of the soy-induced inhibition of nonheme iron absorption. Am J Clin Nutr 1982;36:219–28.
41. Hurrell RF, Juillerat MA, Reddy MB, Lynch SR, Dassenko SA,
Cook JD. Soy protein, phytate, and iron absorption in humans. Am
J Clin Nutr 1992;56:573–8.
42. Callender ST, Marney SR Jr, Warner GT. Eggs and iron absorption.
Br J Haematol 1970;19:657–65.
43. Rossander L, Hallberg L, Björn-Rasmussen E. Absorption of iron
from breakfast meals. Am J Clin Nutr 1979;32:2484–9.
44. Charlton RW, Jacobs P, Seftel HC, Bothwell TH. Effect of alcohol
on iron absorption. Br J Med 1964;2:1427–9.
APPENDIX A
Observed iron absorption at a certain iron status adjusted
to the absorption expected at another iron status
The relation between log serum ferritin and the reference dose
absorption was examined in 1066 subjects in whom an adequate serum
ferritin standard had been used in the calibration. In these studies we
found that a reference dose of 40% corresponded to a serum ferritin
concentration of 23 g/L. Data from a recent study of iron absorption
from whole diets in men (n = 31) showed that there is a linear relation
between log iron absorption and log serum ferritin (SF) (r2 = 0.720):
1157
45. Baynes RD, MacFarlane BJ, Bothwell T. The promotive effect of
soy sauce on iron absorption in human subjects. Eur J Clin Nutr
1990;44:419–24.
46. Hallberg L, Hulthén L, Gramatkovski E. Iron absorption from the
whole diet in men: how effective is the regulation of iron absorption? Am J Clin Nutr 1997;66:347–56.
47. Hallberg L, Björn-Rasmussen E. Measurement of iron absorption from
meals contaminated with iron. Am J Clin Nutr 1981;34:2808–15.
48. Hallberg L, Rossander L. Bioavailability of iron from Western-type
whole meals. Scand J Gastroenterol 1982;17:151–60.
49. Hallberg L, Rossander L. Absorption of iron from Western-type
lunch and dinner meals. Am J Clin Nutr 1982;35:502–9.
50. Gleerup A, Rossander-Hulthén L, Gramatkovski E, Hallberg L. Iron
absorption from the whole diet: comparison of the effect of two different distributions of daily calcium intake. Am J Clin Nutr
1995;61:97–104.
51. Hulthén L, Gramatkovski E, Gleerup A, Hallberg L. Iron absorption
from the whole diet. Relation to meal composition, iron requirements and iron stores. Eur J Clin Nutr 1995;49:794–808.
52. Hunt JR. Bioavailability algorithms in setting recommended dietary
allowances: lessons from iron, applications to zinc. J Nutr 1996;
126:2345S–53S.
53. Hallberg L, Hulthén L. Methods to study dietary iron absorption in
man—an overview. In: Hallberg L, Asp N-G, eds. Iron nutrition in
health and disease. London: John Libbey & Company Ltd, 1996:
81–95.
54. Hurrell RF, Davidsson L, Reddy M, Kastenmayer P, Cook JD. A
comparison of iron absorption in adults and infants consuming identical infant formulas. Br J Nutr 1998;79:31–6.
55. Bothwell TH, Finch CA. Iron metabolism. Boston: Little, Brown
and Company, 1962.
56. Bothwell TH, Charlton RW, Cook JD, Finch CA. Iron metabolism
in man. London: Blackwell Scientific Publications, 1979.
57. Björn-Rasmussen E, Hallberg L, Rossander L. Absorption of fortification iron. Bioavailability in man of different samples of reduced
Fe, and prediction of the effects of Fe fortification. Br J Nutr
1977;37:375–88.
58. Taylor PG, Méndez-Castellanos H, Jaffe W, et al. Iron bioavailability from diets consumed by different socioeconomic strata of the
Venezuelan population. J Nutr 1995;125:1860–8.
59. Gleerup A, Rossander-Hultén L, Hallberg L. Duration of the
inhibitory effect of calcium on non-haem iron absorption in man.
Eur J Clin Nutr 1993;47:875–9.
60. Report of a joint FAO/WHO Expert Consultation. Requirements of
vitamin A, iron, folate and vitamin B12. Rome: FAO, 1988. (Food
and Nutrition Series 23.)
61. National Research Council. Recommended dietary allowances. 10th
ed. Washington, DC: National Academy Press, 1989.
62. Harland BF, Oberlees D. Phytate in foods. World Rev Nutr Diet
1987;52:235–59.
Log iron absorption
(g Fe · kgϪ1 · dϪ1) = (2.9251 Ϫ 0.94049)
ϫ log SF (g/L)
(A1)
The constant in the equation (2.9251) is valid for a diet with a high
bioavailability (1). The slope of this regression line (0.94) was the
same for different diets but the intercept on the y axis varied, implying
that different diets are represented by different parallel regression
lines. A general formula for such regression equations is as follows:
Log iron absorption = (C for a certain diet
Ϫ 0.94049) ϫ log SF
(A2)
1158
HALLBERG AND HULTHÉN
where C is a constant. This formula assumes that the iron absorption
from this diet was as calculated in equation A3 below at an iron status expressed as the SF1 corresponding to a reference dose absorption of 40%. We know that this reference dose absorption corresponds to a serum ferritin concentration of 23 g/L. Another data
pair from the same diet would be used to calculate iron absorption:
Log absorption 1 = (C Ϫ 0.94049) ϫ log SF1
(A3)
To calculate iron absorption from the same diet but at a different SF concentration (SF2) than used in equation A3, the following equation would be used:
Log absorption 2 = (C Ϫ 0.94049) ϫ log SF2
(A4)
In equations A3 and A4, iron absorption can be expressed as g
Fe/kg body wt or as mg. C is eliminated by subtracting equation
A3 from equation A4 and the following equation is obtained:
Log absorption 2
Ϫ log absorption 1 = (Ϫ0.94 ϫ log SF2)
+ (0.94 ϫ log SF1)
(A5)
Log absorption 2 can then be calculated. The equation can be
written in a simpler way by an antilog-transformation, which
gives the following equation:
Log absorption 2 = log absorption 1
ϫ [SF1ϫ (0.94/SF2)]
(A6)
To adjust the iron absorption from a reference dose absorption of
40% to a certain SF concentration, SF1 is set at 23 µg/L. Log
absorption 1 is the observed absorption at this iron status and log
absorption 2 is the calculated absorption at the corresponding
known SF2 concentration.
TABLE A1
Phytate and iron binding polyphenols in vegetables, legumes, fruit, berries,
beverages, spices, nuts, seeds, soy products, and cereal and cereal products
Total
Phytate
Tannin Chlorogenic tannin
phosphorus1 equivalents
acid
equivalents
mg/100 g dry matter
Root, leaf, and stem
vegetables, and legumes
Aubergine, whole
3
Asparagus
Green
2
White
3
Beans
Black
262
Brown
195
Green
15
Mung
188
Red
271
White
269
Beetroot
2
Broccoli
10
Brussels sprouts
11
Cabbage
Chinese
2
White
1
7
51
31
—
—
—
—
—
—
0
0
—
140
1
0
3
1
0
—
—
—
—
—
—
—
40
—
0
0
—
140
1
0
3
20
0
—
0
—
—
—
0
(Continued)
TABLE A1 (Continued)
Total
Phytate
Tannin Chlorogenic tannin
phosphorus1 equivalents
acid
equivalents
Carrot
Cauliflower
Celeriac
Chicory
Corn
Cucumber
Garden cress
Garlic
Horseradish
Kohlrabi
Leek
Lentils
Brown
Red
Lettuce, iceberg
Mushrooms
Olives, black
Onion
Red
Yellow
Parsley leaves
Parsnips
Peas
Chickpeas
Green peas
Yellow peas
Peppers
Sweet green
Sweet red
Sweet yellow
Potato
Radish
White
Black
Rutabaga
Sauerkraut
Skorzonera
(black salsify)
Spinach
Squash, summer
Tomato
Fruit and berries
Apple
Apricot
Avocado
Banana
Blackberry
Blueberry
Currant
Black
Red
Dates
Figs
Kiwi
Cowberry
Mango
Melon, honey
Orange
Pears
Raspberry
4
3
5
2
24
1
7
4
13
2
4
142
122
0.5
13
3
mg/100 g dry matter
0
28
0
—
0
—
0
—
—
—
0
0
—
—
0
7
—
—
—
—
0
11
13
0
0
0
—
0
—
3
—
—
5
190
0
—
1
—
—
—
—
—
—
5
16
8
9
10
6
—
0
—
—
—
20
10
6
—
9.5
140
175
270
0
0
—
—
0
—
0
0
—
0
0
0
0
—
—
—
0
0
0
0
0
4
1
1
1
—
0
—
0
0
0
—
—
—
—
—
0
—
0
0
0
2
3
2
20
—
0
12
—
—
26
—
0
0.1
—
1
0.4
4
6
160
0
0
40
390
80
—
—
—
—
—
—
160
0
0
40
390
80
78
55
—
—
10
5
1
0.6
2
0.2
4
—
—
5
0
0
3
—
—
0
4
70
—
—
—
—
0
250
—
—
—
70
61
2
0.5
1
7
190
0
—
1
—
—
—
5
0
0
122
—
—
0
37
99
(Continued)
ALGORITHM TO PREDICT DIETARY IRON ABSORPTION
TABLE A1 (Continued)
TABLE A1 (Continued)
Total
Phytate
Tannin Chlorogenic tannin
phosphorus1 equivalents
acid
equivalents
Rhubarb
Strawberry
Beverages
Coffee, brewed2
Tea
English breakfast3
Green4
Herb
Peppermint4
Cacao powder
Marabou
De Zaan5
De Zaan low fat
Fazer 6
With sugar
Beer
Light lager
Strong
Whiskey, Cutty Sark7
Wine
White
Red5,8
Fruit syrup, sloe
Spices9
Allspice
Basil
Black pepper
Caraway
Cardamom
Chervel
Chili pepper
Cinnamon
Clove
Cumin
Curry
Fennel
Ginger
Green pepper
Marjoram
Oregano
Thyme
Turmeric
Vanilla
White pepper
Nuts, seeds, and
soy products
Brazil nut
Cashew nut
Hazel nut
Peanut
Walnut
Sweet almond
Linseeds
Sesame seeds
Sunflower seeds
Soy sauce
Kikkoman10
Tamari11
Chinese mushroom12
Cereals and
cereal products
Bran
1159
0.2
4
mg/100 g dry matter
0
16
—
—
8
—
—
21
71
55
—
—
—
—
53
26
18
20
14
17
—
23
60
35
18
31
504
513
342
481
93
4400
—
—
—
380
520
—
—
—
69
4648
—
—
—
413
—
—
—
0.4
0.1
2.9
—
—
—
—
—
—
0
0.2–2.3
6.2
4
20–40
—
2
10–21
6.2
—
7.9
—
6.4
—
2
0.8
14.3
—
6.4
9.9
—
—
—
9.9
6
4.4
0.7
—
—
0
6.5
2
5.8
0.3
1.4
0.8
50
95
5.8
10.9
0.3
0.2
1.4
11.1
24
14.1
34
0.7
0.4
—
—
—
—
—
—
—
—
—
—
—
—
—
—
—
0.2
—
—
—
—
0
2.7
2
2.8
0.3
0.4
0.4
43
95
2.8
6.2
0.3
0.2
1.4
6.4
21
12
34
0.7
0.4
0.4
0.1
2.9
—
—
—
—
303
296
296
576
393
10
0
256
0
1400
43
14
—
120
—
—
—
—
—
—
—
—
—
10
0
256
0
1400
43
14
—
120
4
15
5
—
—
—
—
—
—
—
—
—
(Continued)
Total
Phytate
Tannin Chlorogenic tannin
phosphorus1 equivalents
acid
equivalents
Barley
Oat
Wheat
Wheat, coarse
Crisp bread
Rye, thin
Rye, fiber
Graham
Oat
Rice cakes
Rice flour
Long grain
Parboiled
Wild, brown
Starch
Lentil
Maize
Rice
Wheat
Corn flakes
Millet
Oats, rolled
Semolina
Sorghum
Red
White
Spaghetti
Buitoni13
Barilla14
Wheat germ
185
399–628
680–1189
1338
mg/100 g dry matter
—
—
0
—
0
58
3
—
—
0
28
3
72–86
114–193
192
166
113
27
53–64
71
181–215
—
—
—
—
—
—
—
—
0
—
—
—
—
—
—
—
—
—
—
—
—
—
—
—
—
—
0
3
3
1–37
0
12
217
282
19
—
—
—
—
—
—
0
—
—
—
—
—
—
—
—
—
—
—
—
—
—
—
0
—
279
389
480
15
—
—
480
15
6
71
467
—
—
0
—
—
—
—
—
0
1
See reference 2. 1 mg phytate phosphorus = 3.5 mg phytic acid =
5.56 mol phytic acid.
2
3.3 g coffee/100 mL water.
3
1 g tea/100 mL water.
4
1.4 g tea/100 mL water .
5
Droste, Harlem, Netherlands.
6
Fazer AB, Solna, Sweden.
7
Berry Brothers and Rudd, Edinburgh.
8
Ranges given.
9
Values are per 1 g.
10
Kikkoman (s) PTE, Ltd, Singapore.
11
Kung Markatta AB, Örebro, Sweden.
12
CHE-BE Trading AB, Stockholm.
13
Milano, Italy.
14
Parma, Italy.
.
1160
HALLBERG AND HULTHÉN
TABLE A2
Phytate phosphorus, ash, and total iron contents of flour and bread
Corn flour
Rye flour2
Wheat flour
Wheat flour
Wheat flour
Wheat flour
Wheat flour3
Wheat flour
Wheat flour
Wheat flour
Wheat flour
Wheat flour
Ash content
Total iron
% of dry matter
mg/100 g dry matter
—
1.41
0.38
0.45
0.63
0.72
0.76
1.38
1.60
2.34
2.50
2.74
—
2.8
0.4
0.6
1.1
—
1.6
3.4
3.6
5.9
6.3
7.3
In flour
Phytate phosphorus
In bread baked with water
In dry substance
In bread as eaten
mg/100 g dry matter
1
70–265
175–2441
13
22
61
65
86
181
227
364
348
404
—
86.[44]
—
9.
10.
—
19.[81]
98.
154.
289.
—
350.
—
50.[26]
—
5.
6.
—
11.[48]
58.
90.
170.
—
205.
1
Ranges.
Values in brackets reflect sourdough fermentation.
3
Values in brackets reflect milk as an ingredient.
2
TABLE A3
Phytate and iron binding phenols in cooked meat and meat products1
Beef
Rump steak
Sirloin steak
Round steak
Topside, round
Ground
Corned beef (brisket)
Roast, sliced
Pork tenderloin
Chicken
Lamb, leg
Deer meat
Moose loin
Processed meat products
Sausage (Falu)
Sausage, veal
Ham, boiled and sliced
Liver paste and paté
Fish
Cod
Mackerel
Salmon
Mussels
Total iron
Heme iron
Heme iron
mg/100 g
dry matter
% of
total iron
mg/100 g
dry matter
2.9
2.5
3.2
2.5
2.5
2.0
1.7
1.3
0.6
3.1
4.5
2.7
52
52
50
48
40
25
35
23
0
55
51
41
1.5
1.3
1.6
1.2
1.0
0.5
0.6
0.3
0
1.7
2.3
1.1
0.8
0.7
0.7
5.0
0
0
0
16
0
0
0
0.8
0.2
0.7
0.6
4.6
0
0
17
48
0
0
0.1
2.2
REFERENCES
1. Hallberg L, Hulthén L, Gramatkovski E. Iron absorption from the
whole diet in men: how effective is the regulation of iron absorption? Am J Clin Nutr 1997;66:347–56.
2. Brune M, Rossander-Hultén L, Hallberg L, Gleerup A, Sandberg A-S.
Iron absorption from bread in humans: inhibiting effects of cereal
fiber, phytate and inositol phosphates with different numbers of
phosphate groups. J Nutr 1992;122:442–9.
3. Brune M, Hallberg L, Skånberg A-B. Determination of iron-binding
phenolic groups in foods. J Food Sci 1991;56:131–67.
4. Hallberg L. Food iron absorption. In: Cook JD, ed. Methods in
hematology. Vol 1. London: Churchill, 1980:116–33.