Energy bandwidth for petroleum refining processes
Bạn đang xem bản rút gọn của tài liệu. Xem và tải ngay bản đầy đủ của tài liệu tại đây (1.16 MB, 43 trang )
Energy Bandwidth
for
Petroleum Refining
Processes
Prepared by Energetics Incorporated for the
U.S. Department of Energy
Office of Energy Efficiency and Renewable Energy
Industrial Technologies Program
October 2006
Foreword
The Industrial Technologies Program (ITP) is a research and development (R&D) program within
the U.S. Department of Energy, Office of Energy Efficiency and Renewable Energy (EERE). This
program works in collaboration with U.S. industry to improve industrial energy efficiency and
environmental performance. Research is conducted through partnerships with industry as well as
academia, national laboratories, and private research institutes to reduce industrial energy
consumption.
R&D projects within this program focus on manufacturing processes that use the most energy,
ensuring that Federal funds are being spent effectively on areas with the greatest potential for
improvement. ITP sponsors research on a variety of industrial processes, such as petroleum
refining, metal casting, and steel making. Of these industrial sectors, petroleum refineries are one
of the largest consumers of energy and the United States is the largest producer of refined
petroleum products in the world. Because ITP strives to focus R&D on the most energy-intensive
manufacturing processes and technologies in U.S. industry, the Petroleum and Coal Products
industry is a worthwhile candidate for energy efficiency R&D.
ITP conducted a “bandwidth” study to analyze the most energy-intensive unit operations used in
U.S. refineries. This study will help decision makers better understand the energy savings that
could be realized in this area through energy recovery and improvements in energy efficiency. This
report will be used to guide future ITP R&D decision-making and investments in petroleum refining
processes.
Table of Contents
Overview .............................................................................................................................................1
Petroleum Refining Process Descriptions ...........................................................................................3
1. Crude Oil Distillation: Atmospheric and Vacuum..............................................................................5
2. Fluid Catalytic Cracking.............................................................................................................7
3. Catalytic Hydrotreating ..............................................................................................................9
4. Catalytic Reforming ...................................................................................................................11
5. Alkylation...................................................................................................................................13
Energy Bandwidth for Five Principal Petroleum Refining Processes .................................................16
Petroleum Refining Product Energy Requirement...............................................................................19
Appendix A: Data Sources, Assumptions, and Detailed Calculations ................................................21
Appendix B: References ....................................................................................................................38
Overview
The Industrial Technologies Program (ITP), which is a part of DOE’s Office of Energy Efficiency
and Renewable Energy, is developing methods that will help quantify energy-efficiency
improvements in the most energy-intensive process streams. Analyses such as energy
bandwidth studies will enable ITP to focus on the processes or unit operations with the greatest
potential for energy efficiency gains and maximize the impact of ITP’s research investments.
Energy bandwidth analyses provide a realistic estimate of the energy that may be saved in an
industrial process by quantifying three measures of energy consumption:
• Theoretical minimum energy (TME). TME is a measure of the least amount of energy
that a particular process would require under ideal conditions. TME calculations are
based on the thermodynamic analyses of primary chemical reactions using the change
in Gibbs free energy (ΔG), and assume ideal conditions (standard state, 100% selectivity
and conversion) and neglect irreversibilities. In some cases, the TME values were
obtained through industry publications or using the heat of reaction (ΔHr) due to
insufficient Gibbs free energy data.
• Practical minimum energy (PME). The PME represents the minimum energy required
to carry out a process in real-world, non-standard conditions (e.g., temperature,
pressure, selectivities and conversions less than 100%) that result in the formation of byproducts, the need for product separation, catalyst and equipment fouling, and other
factors. These conditions impose limitations that make it impossible to operate at the
theoretical minimum. The energy savings considered for the practical minimum analysis
are primarily based on best practices and state-of-the-art technologies currently
available in the marketplace. Energy savings technologies that are considered to be in
the research and development stage are footnoted in Appendix A.
• Current average energy (CAE). CAE is a measure of the energy consumed by a
process carried out under actual plant conditions. This measure exceeds both the
theoretical and practical minimum energies due to energy losses from inefficient or
outdated equipment and process design, poor heat integration, and poor conversion and
selectivities, among other factors.
The bandwidth is the difference between PME and CAE and provides a snapshot of energy
losses that may be recovered by improving current processing technologies, the overall process
design, current operating practices, and other related factors.
The North American Industry Classification System (NAICS) classifies the Petroleum and Coal
Products industry (represented by NAICS code 324) as including petroleum refineries that
produce fuels and petrochemicals and manufacture lubricants, waxes, asphalt, and other
petroleum and coal products. This report primarily focuses on NAICS 324110, Petroleum
Refineries, which are defined as establishments primarily engaged in refining crude petroleum
into refined petroleum.
NAICS 324 is one of the largest consumers of energy in the industrial sector, second only to
NAICS 325, the chemicals sector. The petroleum and coal products industry represents a
significant target for improving energy efficiency. In 2002, this sector consumed 3.2 quadrillion
Btu (quads) of energy as fuel—accounting for 20% of the fuel energy consumed by U.S
Energy Bandwidth for Petroleum Refining Processes
1
manufacturing industries. Petroleum Refineries, NAICS 324110, accounted for nearly 3.1
quadrillion Btu (quads) of this energy consumption [DOE 2005a].
This report examines the TME, PME, and CAE for five of the most significant processes in
petroleum refining:
1. Atmospheric and vacuum crude distillation
2. Fluid catalytic cracking (FCC)
3. Catalytic hydrotreating
4. Catalytic reforming
5. Alkylation
These processes account for approximately 70% of the energy consumed by the refining
industry and offer significant opportunities for increasing energy efficiency [DOE 1998].
Energy Bandwidth for Petroleum Refining Processes
2
Petroleum Refining Process Descriptions
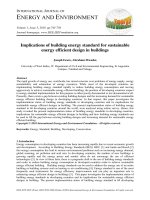
Petroleum refining is a complex industry that generates a diverse slate of fuel and chemical
products, from gasoline to heating oil. The refining process involves separating, cracking,
restructuring, treating, and blending hydrocarbon molecules to generate petroleum products.
Figure 1 shows the overall refining process.
HYDROGEN
PLANT
Straight Run
Gasoline
Gasoline
Naphtha
PRODUCTS
To Hydrotreating
HYDRO
HYDROTREATING
LPG
HYDROHYDRO
TREATING
ATMOS
Desalted TOWER
Crude
CRUDE
UNIT
AROMATICS
RECOVERY
REFORMER
HYDRO
HYDROTREATING
Heavy
Atmos
Gas Oil
Flue Gas
Desulfurization C3/C4/C5
Olefins
HYDRO
HYDROTREATING
VGO
Lube HydroHydro
cracking
HYDROHYDRO
CRACKING
Alkylate
MTBE
TAME
HYDRO
HYDROFINISHING
Gasoline
Gasoline, Naphtha,
& Middle Distillates
Lube Oils
Dewaxing
Vac
Resid
Asphalt Upgrading
RESID HYDROHYDRO
CRACKING/
TREATING
Resid FCC
Premium
Gasoline
Solvents
Aviation
Fuels
Diesels
Heating Oils
Lube Oils
Waxes
Greases
VISBREAKING
Atmos
Resid
Regular
Gasoline
Aromatics Saturation
Selective
Hydrogenation
Fluid Catalytic
Cracker
LGO
Reformate
Alkylation
Fractionator Bottoms
VACUUM
TOWER
Refinery
Fuel Gas
Isomerate
ISOMERISOMER
IZATION
TREATING AND BLENDING
Natural Gas
or Naphtha
Asphalt
Gasoline, Naphtha,
& Middle Distillates
COKING
Asphalts
Industrial
Fuels
Coke
Figure 1. Typical Refinery Flow Diagram [DOE 1998]
There are approximately 150 refineries operating in the United States. Most of the larger
refineries are concentrated along the coast due to the access to sea transportation and shipping
routes. Figure 2 shows the geographic distribution of petroleum refineries in the United States.
Energy Bandwidth for Petroleum Refining Processes
3
Figure 2. Geographic Distribution of Petroleum Refineries [DOE 2004]
The total crude distillation capacity of all the refineries in the U.S. is 18 million barrels per
stream day (BPSD) [DOE 2005b]. The crude distillation capacity of individual refineries varies
widely—from 4,000 to 843,000 BPSD [DOE 2004]. The U.S. Small Business Administration
makes the following distinction between small and large refineries based on crude distillation
capacity [SBA 2005]:
•
•
small refineries – less than or equal to 125,000 BPSD
large refineries – greater than 125,000 BPSD
Refinery size can impact operating practices and energy efficiency. Typically, small refineries
are less complex than medium and large refineries and frequently contain fewer of the refining
processes listed in Figure 1. In addition, some large refineries have parallel processes (i.e., two
crude distillation towers or two reformers) due to refinery expansions over time. Figures 3 and 4
provide a snapshot of the refining capacity of large and small refineries for the five processes
considered in this energy bandwidth analysis. Although there are more small refineries than
large ones, they only account for 25% of the U.S. refining capacity.
Energy Bandwidth for Petroleum Refining Processes
4
Small Refineries
n
ti o
in
g
Al
ky
la
tre
at
Ca
t
Ca
ta
lyt
al
yt
ic
Hy
dr
o
Re
fo
Cr
ac
kin
ic
Di
st
Va
c
rm
in
g
n
illa
tio
tio
illa
Di
st
At
m
g
Large Refineries
n
Number of Refineries with
Specific Process
100
90
80
70
60
50
40
30
20
10
0
17.7
3.8
6.2
8.0
13.5
1.2
100%
90%
80%
70%
60%
50%
40%
30%
20%
10%
0%
Al
ky
la
tio
n
in
g
re
at
in
g
H
yd
ro
t
or
m
R
ef
at
al
yt
ic
C
ra
ck
in
g
C
C
at
al
yt
ic
c
D
is
till
at
io
n
Small Refineries
Va
m
At
Total U.S. Capacity (MM BPSD)
Large Refineries
D
is
til
la
tio
n
U.S. Re
Reffining Capa
pac
ci t y
Figure 3. Industry Profile by Refining Process [DOE 2004]
Figure 4. U.S. Refining Capacity [DOE 2004]
Following is a description of each of the five processes considered in this bandwidth analysis.
1. Crude Oil Distillation: Atmospheric and Vacuum
Crude distillation is one of the first and most critical steps of the petroleum refining process. It
separates crude oil, a complex mixture of many different hydrocarbon compounds, into fractions
based on the boiling points of the hydrocarbons. Characteristic boiling points of crude oil
components range from 90°F to over 800°F [Humphrey 1991].
Atmospheric distillation begins with the crude desalting process, which is carried out before the
crude enters the atmospheric tower. This removes chloride salts, which cause fouling and
corrosion and contribute to inorganic compounds that deactivate catalysts in downstream
processing units [DOE 1998]. Traditionally, crude oils were desalted if they had a salt content
Energy Bandwidth for Petroleum Refining Processes
5
greater than 10 pounds per 1,000 barrel, but many companies are beginning to desalt all crude
oils to minimize equipment fouling, corrosion, and catalyst deactivation and the costs associated
with these problems [Gary 2001].
When the crude oil leaves the desalting process, its temperature ranges between 240°F and
330°F (115°C and 150°C). The crude then enters a series of heat exchangers known as the
“preheat train” [Gary 2001]. The preheat train transfers heat from the hot atmospheric tower
product and reflux streams to the crude oil, raising the crude temperature to approximately
550°F (288°C) [Gary 2001]. A direct-fired furnace heats the crude oil to 650-750°F (343-400°C)
before it enters the flash zone of the atmospheric tower. All of the products that are withdrawn
above the flash zone and 10-20% of the products withdrawn below the flash zone are vaporized
[Gary 2001].
The atmospheric distillation tower operates at atmospheric pressure and contains 30 to 50
separation trays. Each tray corresponds to a different boiling temperature [DOE 1998]. When
the crude oil vapor rises up the column, it passes through perforations in each tray and comes
into contact with the condensed liquid inside. When the vapor reaches a tray in the column with
a temperature equal to its boiling point, it will condense and remain on that tray. The higher
(cooler) trays will contain a mix of more volatile (lighter) compounds while lower (hotter) trays
will collect the less volatile (heavier) components.
At least two low-boiling point side streams from the atmospheric tower are sent to smaller
stripping columns where steam is injected under the tray. The steam strips out the most volatile
components from the heavier components. These volatile components are the desired
products. The steam and remaining components are then fed back to the atmospheric tower
[DOE 1998].
Atmospheric distillation produces a range of products, from liquid petroleum gases (LPG) to
heavy crude residue. These streams are further processed into final products or blended with
products from other processes downstream. A light, non-condensable fuel gas stream primarily
composed of methane and ethane is also produced. It contains hydrogen sulfide and must be
treated before it can be used as a fuel elsewhere in the refinery.
The heavy crude residue (or “bottoms”) is composed of hydrocarbons that have boiling points
greater than 750°F [DOE 1998]. They cannot be heated to their boiling points at atmospheric
pressure because many of the components decompose at that temperature. In addition, these
extremely high temperatures exert a great strain on the equipment and can lead to the formation
of coke deposits which must be physically removed for optimal equipment performance.
Therefore, the bottoms stream is distilled under vacuum (10-40 mm Hg), which lowers the
boiling points of the fractions and enables separation at lower temperatures. The products
generated from vacuum distillation include light vacuum gas oil, heavy vacuum gas oil, and
vacuum residue (asphalt or residual fuel oil) [Gary 2001]. Many of these products are further
processed in downstream units such as hydrocrackers, visbreakers, or cokers.
For the purpose of this study, the atmospheric distillation system is defined as including the
crude desalting process, crude preheat train, direct-fired furnace, atmospheric column, and
smaller stripping towers. The vacuum distillation system is comprised of the fired heater and
vacuum distillation column. Figure 5 shows the system boundaries for the bandwidth energy
analyses.
Energy Bandwidth for Petroleum Refining Processes
6
Condenser
Fuel Gas
Crude preheat with hot
product streams from
the Atmospheric
Distillation Column
Sour Water
Wastewater
Treatment
Gasoline
Crude
Oil
Desalter
Crude
Preheat
Train
Naphtha/
Kerosene
Atmospheric
Distillation
Column
Fired
Heater
Steam
Downstream
Processing
and
Blending
Gas Oils
Downstream
Processing and
Blending
Steam
Steam
Electricity
Steam
Injection
Condenser
Fuel Gas
Heavy Residue/
Topped Crude
Fired
Heater
Hot Well
Condensate
Vacuum
Distillation
Column
Electricity
Sour Water
Light Vacuum Gas Oil
Heavy Vacuum Gas Oil
Steam
Wastewater
Sewer
Wastewater
Treatment
Downstream
Processing
Vacuum Residue
Figure 5. Atmospheric and Vacuum Crude Distillation Flow Diagrams and System
Boundaries for Bandwidth Energy Analyses [DOE 1998]
2. Fluid Catalytic Cracking
Catalytic cracking is widely used in the petroleum refining industry to convert heavy oils into
more valuable gasoline and lighter products. As the demand for higher octane gasoline has
increased, catalytic cracking has replaced thermal cracking. Two of the most intensive and
commonly used catalytic cracking processes in petroleum refining are fluid catalytic cracking
and hydrocracking. “Fluid” catalytic cracking (FCC) refers to the behavior of the catalyst during
this process. That is, the fine, powdery catalyst (typically zeolites, which have an average
particle size of about 70 microns), takes on the properties of a fluid when it is mixed with the
vaporized feed. Fluidized catalyst circulates continuously between the reaction zone and the
regeneration zone. FCC is the most widely used catalytic cracking process [DOE 1998];
therefore, for the purpose of this petroleum bandwidth analysis, only the FCC process will be
evaluated.
Catalytic cracking is typically performed at temperatures ranging from 900oF to 1,000oF and
pressures of 1.5 to 3 atmospheres. Feedstocks for catalytic cracking are usually light and
heavy gas oils produced from atmospheric or vacuum crude distillation, coking, and
deasphalting operations [DOE 1998]. The fresh feed enters the process unit at temperatures
Energy Bandwidth for Petroleum Refining Processes
7
from 500 -1,000oF. Circulating catalyst provides heat from the regeneration zone to the oil feed.
Carbon (coke) is burned off the catalyst in the regenerator, raising the catalyst temperature to
1,150 - 1,350oF, before the catalyst returns to the reactor.
Most units follow a heat balance design, where the heat produced during regeneration supplies
the heat consumed during the endothermic cracking reactions. From a utility perspective, some
units are net energy producers given the large quantities of hot flue gas produced in the
regenerator that are used to generate steam and power.
A catalytic cracker constantly adjusts itself to stay in thermal balance. The heat generated by
the combustion of coke in the regenerator must balance the heat consumed in the other parts of
the process, including the temperature increase of feed, recycle and steam streams,
temperature increase of combustion air, heat of reaction, and other miscellaneous losses
including surface radiation losses.
The gasoline-grade products formed in catalytic cracking are the result of both primary and
secondary cracking reactions. Carbonium ions are formed during primary thermal cracking.
Following a proton shift and carbon-carbon bond scission, these small carbonium ions
propagate a chain reaction that reduces their molecular size and increases the octane rating of
the original reactants.
There are many other reactions that are initiated concurrently by the zeolite catalyst and are
propagated by the carbonium ions [Gary 1984]. Figure 6 summarizes the principal types of
reactions that are believed to occur in catalytic cracking. A complete list of chemical reactions
occurring in a typical FCC unit is not readily available. There are dozens of significant reactions
occurring simultaneously in this process unit.
Energy Bandwidth for Petroleum Refining Processes
8
Paraffins
Cracking
Cracking
Cyclization
Olefins*
Isomerization
H Transfer
Cyclization
Condensation
Dehydrogenation
Cracking
Naphthenes
Dehydrogenation
Isomerization
Side-chain
cracking
Aromatics
Paraffins + Olefins
LPG Olefins
Naphthenes
Branched
olefins
H Transfer
Branched
paraffins
Paraffins
Coke
Olefins
Cyclo
olefins
Dehydrogenation
Aromatics
Naphthenes with different rings
Unsubstituted aromatics + Olefins
Transalkylation
Different alkylaromatics
Dehydrogenation
Condensation
Polyaromatics
Alkylation
Dehydrogenation
Condensation
Coke
* Mainly from cracking, very little in feed.
Figure 6. Principal Reactions in Fluid Catalytic Cracking [Davison 1993]
3. Catalytic Hydrotreating
Catalytic hydrotreating, also referred to as “hydroprocessing” or “hydrodesulfurization,”
commonly appears in multiple locations in a refinery. In the hydrotreating process, sulfur and
nitrogen are removed and the heavy olefinic feed is upgraded by saturating it with hydrogen to
produce paraffins. Hydrotreating catalytically stabilizes petroleum products. In addition, it
removes objectionable elements such as sulfur, nitrogen, oxygen, halides, and trace metals
from products and feedstocks through a reaction with hydrogen [Gary 1984]. Most
hydrotreating processes have essentially the same process flow. Figure 7 illustrates a typical
hydrotreating unit.
Energy Bandwidth for Petroleum Refining Processes
9
Figure 7. Catalytic Hydrotreating Flow Diagram [DOE 1998]
Hydrotreating units are usually placed upstream of units where catalyst deactivation may occur
from feed impurities, or to lower impurities in finished products, like jet fuel or diesel. A large
refinery may have five or more hydrotreaters. The following three types of hydrotreaters are
typically found in all refineries:
• The naphtha hydrotreater, which pretreats feed to the reformer
• The kerosene hydrotreater, sometimes called “middle distillate hydrotreater,” which
treats middle distillates from the atmospheric crude tower
• The gas oil hydrotreater, sometimes called “diesel hydrotreater,” which treats gas oil
from the atmospheric crude tower or pretreats vacuum gas oil entering a cracking unit
The oil feed to the hydrotreater is mixed with hydrogen-rich gas before entering a fixed-bed
reactor. In the presence of a metal-oxide catalyst, hydrogen reacts with the oil feed to produce
hydrogen sulfide, ammonia, saturated hydrocarbons, and other free metals. The metals remain
on the surface of the catalyst and other products leave the reactor with the oil-hydrogen stream.
Oil is separated from the hydrogen-rich gas stream, and any remaining light ends (C4 and
lighter) are removed in the stripper. The gas stream is treated to remove hydrogen sulfide and
then it is recycled to the reactor [Gary 1984].
Most hydrotreating reactions are carried out below 800oF to minimize cracking. Product
streams vary considerably depending on feed, catalyst, and operating conditions. The
predominant reaction type is hydrodesulfurization, although many reactions take place in
hydrotreating including denitrogenation, deoxidation, dehalogenation, hydrogenation, and
hydrocracking. Almost all hydrotreating reactions are exothermic and, depending on the
specific conditions, a temperature rise through the reactor of 5 to 20oF is usually observed [Gary
1984]. Some typical hydrotreating reactions are shown in Figure 8.
Energy Bandwidth for Petroleum Refining Processes
10
Desulfurization
Dibenzothiophene + 2H2 Æ Biphenyl + H2S
Hydrogenation, Olefin Saturation
1-Heptene + H2 Æ n-Heptane
Hydrogenation, Aromatic Saturation
Naphthalene + 2H2 Æ Tetralin
Figure 8. Typical Hydrotreating Reactions [DOE 1998]
On average, the hydrotreating process requires between 200 and 800 cubic feet of hydrogen
per barrel of feed [Gary 1984]. The hydrogen required for hydrotreating is usually obtained from
catalytic reforming operations. This process is described below.
4. Catalytic Reforming
The catalytic reforming process converts naphthas and heavy straight-run gasoline into highoctane gasoline blending components. The feed and product streams to and from the reformer
are composed of four major hydrocarbon groups: paraffins, olefins, naphthenes, and aromatics.
Table 1 depicts the change in volume of these hydrocarbon groups as they pass through this
unit. During this process, the octane value of the product stream increases with the formation of
aromatics [Gary 1984].
Table 1. Typical Reformer Feed and Product Makeup
Chemical Family
Paraffins
Olefins
Naphthenes
Aromatics
Feed (Volume %)
45-55
0-2
30-40
5-10
Product (Volume %)
30-50
0
5-10
45-60
Source: Gary 1984
Rather than combining or breaking down molecules to obtain the desired product, catalytic
reforming essentially restructures hydrocarbon molecules that are the right size but have the
wrong molecular configuration or structure. Catalytic reforming primarily increases the octane of
motor gasoline rather than increasing its yield.
The four major reaction types that take place during reforming include dehydrogenation,
dehydrocyclization, isomerization, and hydrocracking. The four reaction types are presented in
more detail in Figure 9 with specific reactions that are typical of each type.
Energy Bandwidth for Petroleum Refining Processes
11
1) dehydrogenation of naphthenes to aromatics
Typical reaction a): (highly endothermic, high reaction rate)
Dehydrogenation of alkylcyclohexane to aromatic
Methylcyclohexane Æ Toluene + 3 H2
Typical reaction b):
Dehydroisomerization of alkylcyclopentane to aromatic
Methylcyclopentane Æ Cyclohexane Æ Benzene + 3 H2
2) dehydrocyclization of paraffins to aromatics
Typical reaction:
n-Heptane Æ Toluene + 4 H2
3) isomerization (fairly rapid reactions with small heat effects)
Typical reaction a):
Isomerization of n-paraffin to isoparaffin
n-Hexane Æ Isohexane
Typical reaction b):
Isomerization of paraffin to naphthene
Methylcyclopentane Æ Cyclohexane
4) hydrocracking (exothermic, relatively slow)
Typical reaction:
n-Decane Æ Isohexane +n-Butane
Figure 9. Catalytic Reforming Reactions [Gary 1984]
For the purposes of this bandwidth report, it is assumed that the four major catalytic reforming
reactions presented in Figure 9 take place in the following volume ratio*:
Reaction 1) = 40 %
Reaction 2) = 17 %
Reaction 3) = 34 %
Reaction 4) = 9 %
* Based on conversations with industry representatives and Gary 1984 feed/product makeup analysis in Table 1.
This report does not account for additional reactions that form undesirable products, such as the
dealkylation of side chains or the cracking of paraffins and naphthenes, which form butane and
lighter paraffins.
Energy Bandwidth for Petroleum Refining Processes
12
Catalytic reforming reactions are promoted by the presence of a metal catalyst, such as
platinum on alumina, or bimetallic catalysts, such as platinum-rhenium on alumina. The
reformer is typically designed as a series of reactors, as shown in Figure 10, to accommodate
various reaction rates and allow for interstage heating. Interstage heaters maintain the
hydrocarbon feed stream at a temperature of approximately 950oF, which is required for the
primarily endothermic reactions. Catalytic reforming can be continuous (e.g., cyclic) or semiregenerative. In continuous processes, the catalysts can be regenerated one reactor at a time
without disrupting operation [DOE 1998].
Figure 10. Catalytic Reforming Flow Diagram (Continuous Operation) [DOE 1998]
5. Alkylation
Alkylation involves linking two or more hydrocarbon molecules to form a larger molecule. In a
standard oil refining process, alkenes (primarily butylenes) are reacted with isobutane to form
branched paraffins that are used as blending components in fuels to boost octane levels without
increasing the fuel volatility. There are two alkylation processes: sulfuric acid-based (H2SO4)
and hydrofluoric acid-based (HF). Both are low-temperature, low-pressure, liquid-phase
catalyst reactions, but the process configurations are quite different (see Figures 11 and 12).
Several companies are also developing advanced HF catalysts to reduce the environmental and
health risks of HF alkylation [Nowak 2003, CP 2004].
Energy Bandwidth for Petroleum Refining Processes
13
Steam
Propane
Refrigeration,
Compressor,
and
and
Caustic/Water
Caustic/Water
Wash System
Process Water,
Caustics,
Caustics,
Electricity
Depropanizer
Butane
Wastewater
Alkylation Reactor
Acid Settler
Debutanizer
Deisobutanizer
Isobutane Recycle
Alkylate
Product
Makeup
Isobutane
Makeup Acid
Steam
Spent Acid
Figure 11. Sulfuric Acid-Based Alkylation Flow Diagram [DOE 1998]
Process Water,
Caustics,
Electricity
Overhead
Acid Settler
HF Stripper
Olefin
Feed
Reactor
Propane
Steam
Wastewater
Steam
Caustic
Wash/
Alumina
Treater
Depropanizer
Acid
Regenerator
Isostripper
HF Acid
Wastewater
Isobutane Recycle
Alkylate
Product
Caustic
Wash
Butane
Figure 12. Hydrofluoric Acid-Based Alkylation Flow Diagram [DOE 1998]
The primary alkylation reaction is:
acid
catalyst
C4H8 (l)
Butylene
+
C4H10 (l)
Î
Isobutane
Energy Bandwidth for Petroleum Refining Processes
C8H18 (l)
+
Heat
2,2,4-trimethylpentane
14
In the H2SO4 process, the reactor must be kept at a temperature of 40-50°F (4-10°C) to
minimize unwanted side reactions such as polymerization, hydrogen transfer,
disproportionation, cracking, and esterification because these reactions can lower the alkylate
octane or create processing issues [Meyers 1997, Stratco 2003, Ackerman 2002]. Heat is
removed either through autorefrigeration or indirect effluent refrigeration. Autorefrigeration uses
the evaporation of isobutane-rich vapors from the reaction mass to remove the heat generated
by alkylation. The vapors are removed from the top of the reactor and sent to the refrigeration
compressor to be compressed and cooled back to a liquid at the feed temperature [Meyers
1997]. In the indirect effluent refrigeration process, the alkylation is run at higher pressures to
prevent vaporization of light hydrocarbons in the reactor and settler. Hydrocarbons from the
settler are flashed across a control valve into heat transfer tubes in the reactor to provide
cooling. Of the two systems, autorefrigeration is more energy efficient.
The HF process is run at higher temperatures, 70-100°F (20-30°C), in a reactor-heat exchanger
[ANL 1981, Meyers 1997]. Cooling water is run through the heat exchanger tubes to remove
the heat of reaction.
Energy Bandwidth for Petroleum Refining Processes
15
Energy Bandwidth for Five Principal Petroleum Refining Processes
The theoretical minimum, practical minimum, and current
average energy requirements for the five refining
processes evaluated in this report were derived from a
variety of sources. TME calculations vary slightly for each
of the five refinery processes as these values include
thermodynamic analyses of process feed and effluent
streams, thermodynamic analyses of primary chemical
reactions, and published enthalpy and energy balance
values. The CAE values, which represent actual plant
data, were obtained from the Energy and Environmental
Profile of the U.S. Petroleum Refining Industry [DOE
1998]. The PME values were estimated by considering
assorted energy savings measures, primarily best
practices and state-of-the-art technologies, and applying
these savings to the CAE requirement.
CAE – PME = Energy Bandwidth
Definition Recap
TME: The least amount of energy
that a process would require under
ideal conditions.
PME: The minimum energy
required to carry out a process
using best practices and state-ofthe-art technologies under realworld conditions (including limiting
factors such as heat transfer, nonideal behavior of the reactants,
byproduct formation, equipment
fouling, etc.).
CAE: Energy consumed under
actual plant conditions.
The petroleum refining energy bandwidth is the amount of energy that may be recovered
through the use of best available practices and state-of-the-art technologies. A small fraction of
the PME energy savings technologies are considered to be in the research and development
stage. Table 2 provides the TME, PME, and CAE values for each of the five principal petroleum
refining processes as well as the energy bandwidth for each. To obtain the value for total energy
requirement (Btu/yr), the U.S. total process unit capacity (bbl/yr) was multiplied by the Btu/bbl
energy requirement. Note that the positive energy requirements in the table signify that energy
is consumed by the processes (endothermic) while negative energy requirements represent
processes that generate energy (exothermic). Although the alkylation reaction is exothermic, in
practice, the process is an energy consumer. Other details regarding this table, such as data
sources, calculations, and assumptions, are provided in Appendix A.
The largest potential bandwidth savings (difference between current average energy use and
practical minimum energy as a percentage of the current average energy) is found to occur with
distillation of the incoming crude (atmospheric, up to 54% and vacuum distillation, up to 39%).
This is not surprising, given the typically low efficiencies of current distillation processes.
Alkylation processes, both of which are acid-based, constitute the next largest bandwidth.
Remaining processes exhibit significant inefficiencies as well. According to experts working in
the field of petroleum refining and energy management, the plant-wide refinery energy savings
potential is usually found to be around 30%. It should be noted that the bandwidth savings
reported represent the maximum savings and in practice, the bandwidth savings will likely be
less than the reported value due to (potential) overlap of the energy saving measures used in
the bandwidth calculations.
Energy Bandwidth for Petroleum Refining Processes
16
Table 2. The TME, PME, and CAE and Energy Bandwidth Values
for the Five Principal Petroleum Refining Processes
TME
PMEa
CAE
Process
Energy
Bandwidth
(CAE-PME)
Potential
Energy
Bandwidth
Savings
(%)d
Total
Annual CAE
by Process
(1012 Btu/yr)
Potential
Energy
Bandwidth
Savings
(1012 Btu/yr)
103 Btu/bbl feedb,c
1. Crude Distillation:
Atmospheric
Vacuum
2. Fluid Catalytic
Cracking
3. Catalytic
Hydrotreating
4. Catalytic
Reforming
5. Alkylation:
H2SO4f
HF
22
46
50
54
109
89
59
35
54%
39%
658
242
356
95
40
132
183
51
28%
377
105
30
55
81
26
32%
382
123e
79
203
264
61
23%
339
78
-58
-58
156
152
250
245
94
93
38%
38%
Total
102g
38
a
2101h
This represents the minimum PME; in practice, the PME value may be greater due to overlap of the energy saving
measures identified for each unit operation.
b
A positive energy represents energy consumed by the process (endothermic). A negative energy represents
energy produced by the process (exothermic).
c
Energy values exclude losses incurred during the generation and transmission of electricity.
d
This represents the maximum bandwidth savings; in practice, the savings may be less due to overlap of the energy
saving measures identified for each unit operation.
e
Energy value is based on the U.S. hydrotreating/desulfurization capacity.
f
Energy values are based on the autorefrigeration-based sulfuric acid process.
g
Energy value is based on the average CAE for the sulfuric and hydrofluoric acid processes.
h
Total Annual CAE value is off by one due to rounding of the individual values.
Sources: DOE 2005b; See Appendix A for TME, CAE, PME sources.
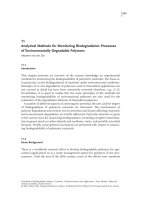
The energy requirement values for each process, as listed in Table 2, are shown graphically in
Figures 13 and 14. The energy savings opportunity for each process is represented by the
yellow band at the top of the bar. This is the average amount of energy currently used minus
the practical minimum energy required.
Energy Bandwidth for Petroleum Refining Processes
17
Legend
250
200
3
Process Energy (10 Btu/bbl)
300
CAE
150
Energy
Bandwidth
100
50
4
Al
ky
la
H tio
F n-
in
g
ef
or
m
R
tre
at
in
g
yd
ro
H
TME
Al
k
H ylat
i
2S
O on-
-100
Fl
ui
d
C
C ata
ra l y
ck tic
in
g
Va
is cu
til um
la
tio
n
D
-50
At
m
D os
is p
til h
la er
tio ic
n
0
PME
800
700
Legend
600
500
400
CAE
Energy
Bandwidth
300
200
100
0
H
F
la
tio
n-
4
TME
Al
ky
Al
ky
la
H tio
n
2S
O -
in
g
ef
or
m
R
yd
ro
tre
at
in
g
H
D Va
is cu
t il
la um
tio
n
Fl
ui
d
C
C ata
r a ly
ck tic
in
g
-100
-200
PME
At
m
D osp
is
til he
la r ic
tio
n
Process Energy (1012 Btu/yr)
Figure 13. Petroleum Refining Industry Energy Bandwidth, Per Barrel Feed Processed
Basis
Figure 14. Petroleum Refining Industry Energy Bandwidth, Production per Year Basis
All five processes studied exhibit large enough bandwidths to warrant investigation for potential
energy efficiency improvements. The economic feasibility of realizing these savings has not yet
been evaluated. In many cases, the cost of upgrading a technology does not have sufficient
energy saving payback.
From the perspective of refinery size, both large and small refineries operate distillation columns
as a significant portion of their capacity, and opportunities to save energy in this area cut across
all domestic refineries. Small refineries are about as energy efficient as large ones since the
most inefficient refineries were shut down during the 1980s and early 1990s when the rules
regarding crude pricing changed.
Energy Bandwidth for Petroleum Refining Processes
18
Petroleum Refining Product Energy Requirement
The energy used by petroleum refining processes can be further evaluated by considering the
distribution of energy to produce various product streams. The first step is to compare the
energy intensity of typical product streams. The total U.S. refinery input of crude and petroleum
products can be compared to the total U.S. refinery product output. Total U.S. refinery incoming
crude volumes, product volumes, and process unit capacities are available in the Petroleum
Supply Annual (PSA) 2004 [DOE 2005b]. For this analysis, flow volumes to and from the
various process units were obtained from the PSA tables or they were estimated based on
consultation with an industry expert.
Figure 15 shows a simplified refinery process flow diagram which includes input, output, and
unit capacity flow volumes for those process units studied in this report. The values in Figure 15
represent total U.S. refinery flow in terms of 1,000 barrels per stream day (BPSD). Estimated
values were derived with the help of an industry expert assuming that typical conventional crude
oil is processed as shown in the simplified flow layout. A detailed breakdown of the flow
volumes is provided in Appendix A.
Typical Refinery Products
458
Still Gas
769
LRG and Still Gas
18,314
ATMOS
CRUDE
DISTILLATION
TOWER
3,836
LRG (LPG
(LPG))
704
3,836
REFORMER
NAPHTHA
HYDROTREATER - a
444
820
51
Gasoline
Jet Fuel
Other
4,100
Crude Oil and
Petroleum
Product Input
DISTILLATE
HYDROTREATERS - b
(includes jet fuel and
diesel hydrotreating)
1,229
ALKYLATION
Hydrotreaters a + b + c = 14,087
6,151
4,922
6,151
GAS OIL
HYDROTREATER - c
FLUID CRACKING
8,120
VACUUM
TOWER
716
555
Resid Fuel Oil
Asphalt
1,183
OTHER PROCESSES
(iIncludes
hydrocracking,
(iIncludes hydrocrack
ing,
visbreaking,
etc.))
visbreaking, coking, etc.
283
OTHER
PETROLEUM
INPUT
1,148
PROCESS GAIN
TREATING AND BLENDING
18,031
(fuell gas
(fue
gas))
ncludes
Gasoline (i(includes
Gasoline
feedstock))
petrochemical feedstock
9,556
ncludes kerosene
kerosene))
Jet Fue
Fuell (i(includes
1,760
Distillate
stillate Fuel O
Oilil (incl
Di
udes
(includes
heating
diesel))
heati
ng oil
oil and diesel
4,167
Residual Fuel
Residual
Fuel Oil
716
Asphalt
Asphalt
555
Coke
914
Other
320
19,462
■ Petroleum Supply Annual
■ Estimated
VOLUME BALANCE:
18,314 input + 1,148 process gain = 19,462 produced
19,462 produced = 458 straight run still gas/LRG + 3,836 reformer +1,264 straight run gasoline and jet fuel + 51 other products + 4,100 dist HTs + 1,229 alkylation + 4,922 FCC + 1,271
straight run residual fuel oil and asphalt + 1,183 other processes + 1,148 process gain
* Barrel per stream day (BPSD) assumes 335 day per year
Figure 15. Simplified Refinery Flow Diagram Showing the Five Process Units Evaluated in this
Report (Values Represent 2004 U.S. Total Flow Volumes x 103 BPSD*)
Table 3 provides the total annual energy requirements (Btu per year) and individual energy
requirements of nine refinery products for each process unit being studied. The individual
product energy requirement for each process was calculated by multiplying the annual
Energy Bandwidth for Petroleum Refining Processes
19
production volume by the product output volume percent and the current average process unit
energy requirement from Table 2.
Product stream heat capacities and process unit volume fractions are used to estimate the
distribution of process unit CAE for the crude and vacuum units. For the remaining units where
there are multiple reactions occurring simultaneously, it is assumed that the energy requirement
is distributed evenly based on process unit volume percent.
Table 3. Total Annual Refinery Product Energy Requirement (T Btu/yr)
Product
Energy
Requirement
Still
Gas
LRG
Gasoline
Jet
Fuel/
Kero
Dist
Fuel
Oil
Resid
Fuel
Oil
Asphalt
Coke
Other
Atmospheric
658
1
1
295
54
180
38
30
49
12
Vacuum
242
0
0
61
0
33
39
45
64
0
Reformer
339
13
5
322
0
0
0
0
0
0
Hydrotreating
382
14
11
230
22
105
0
0
0
0
Alkylation
102
0
0
102
0
0
0
0
0
0
FCC
377
24
20
296
0
37
0
0
0
0
2,101
51
37
1,305
76
355
77
75
113
12
100%
2.4
%
1.7%
62.1%
3.6%
16.9%
3.7%
3.6%
5.4%
0.6%
Process Unit
Crude Distillation:
TOTAL
% of Total
(Some values are off by one when columns and rows are summed due to rounding error)
The total annual product energy requirement, that is, 2,101 trillion Btu per year, is equal to the
total annual CAE listed in Table 2. This value represents 68% of the 3,086 trillion Btu per year
(or 3 quads) of process energy consumed by U.S. petroleum refineries in 2002 [DOE 2005a].
The flow volumes for “Other Processes,” “Process Gain,” and “Other Petroleum Input” shown in
Figure 15 are not included in Table 3. These volumes contribute significantly to the remaining
32% of process energy consumed by the U.S. refining industry.
Gasoline requires the greatest amount of energy to produce. While gasoline makes up 49% by
volume of refinery product output, its production consumes 62% of the refinery energy
requirement. Distillate fuel oil is the next most energy-intensive product stream, consuming
17% of refinery energy requirement. The remaining 21% is distributed fairly evenly between the
other product streams.
Energy Bandwidth for Petroleum Refining Processes
20
Appendix A
Data Sources, Assumptions, and Detailed Calculations
1. Crude Oil Distillation (Atmospheric and Vacuum) Energy Requirement
Estimates
Theoretical Minimum Energy
Distillation of crude oil takes advantage of differences in boiling points to separate the crude.
The overall heat balance is described by:
Theoretical Minimum Energy = Heat In – Heat Out
It is assumed for the TME calculation that:
y Crude oil behaves as an “ideal solution”; that is, the properties of the component in solution
are equal to the properties of the pure component
y The heavier fractions must be distilled under vacuum (10 mm Hg) to prevent the heavy
fractions from degrading
y The crude oil fractions exit the mass and energy balance at their respective boiling points
o Heat Out = 0
As explained in the process description, the crude oil is heated so that the lighter fractions
evaporate, allowing the vapor to rise up through the column until it contacts a tray that is at the
vapor component’s boiling point. The component condenses and exits the column as a liquid
stream. Therefore, the energy input is the amount of energy required to raise the temperature
of each component from 77°F (25°C) to its boiling point. The energy required to evaporate the
crude oil component is cancelled out by the energy released when the component vapor
condenses. As an ideal solution, the boiling point of the pure substance is used and any
effects of intramolecular interactions are ignored. Also, due to a lack of thermodynamic data,
the TME will be calculated as the heat or reaction, ΔHrxn, rather than the change in Gibbs free
energy, ΔGrxn (heat of reaction and Gibbs free energy are related as follows: ΔG = ΔH –T·ΔS,
where T is temperature in Kelvin and ΔS is the change in entropy).
The energy consumed by atmospheric distillation includes energy that goes into heating the
heavy fractions that must be distilled under vacuum. However, for the TME calculation, the
energy consumption of atmospheric distillation is limited to the separation energy for the crude
fractions that can be distilled at atmospheric pressure. In addition, the calculation excludes the
energy content of the fuel gas stream generated via atmospheric distillation and excludes the
heat recovery that takes place via the crude preheat train.
The vacuum distillation process is also simplified to calculate the TME. Similar to atmospheric
distillation, it is assumed that all energy consumed by the vacuum distilled fractions as they are
heated from ambient temperature to their boiling points is included in the vacuum distillation
TME. In reality, the heavy components are heated from ambient conditions to a higher
temperature as they pass through the atmospheric distillation tower. In addition, it is assumed
that the residue stream produced is processed further in coking units, rather than used to
Energy Bandwidth for Petroleum Refining Processes
21
generate heat for the vacuum distillation tower. Table A1 shows the physical and chemical
properties of the crude oil fractions.
Table A1. Typical Cut Points, Crude Oil Fraction Compositions, Chemical/Physical/Thermodynamic
Properties, and Theoretical Separation Heat Input
Crude Oil
Fraction
Chemical
Compositiona
C2
C3
iC4
nC4
C2
C3
iC4
nC4
C5-180°F
(82°C)
~C5
180-350°F
(82-177°C)
~C6-C10
350-400°F
(177-204°C)
400-650°F
(204-343°C)
Atmospheric
Distillation
TOTAL
~C10-C12
Volume
%
Product
Fuel Gas
Specific
Gravity
(lb/gal)
Atmospheric Distillation
3.119
0.1
0.3
4.245
0.2
4.704
0.6
4.871
Gasoline
(Light
Straight
Run)
Naphtha
(Heavy
Straight
Run)
Boiling Point
of Pure
Substanceb
(°F)
Cpb
(Btu/lb·°F)
Theoretical
Separation
Heat Input
(Btu/bblcrude)
-128
-54
-12
32
0.549
0.549
0.549
0.533
0
4.3
5.652
97
0.541
110
11.7
6.449
259
0.490
2,826
Kerosene
4.3
6.826
383
0.525
1,981
~C12-C20
Light Gas
Oil
24.7
7.195
513
0.527
17,150
na
na
na
na
na
na
22,067
Vacuum Distillation
650-850°F
(343-455°C)
~C20-C30
850-1050°F
(455-565°C)
~C30-C40
1050°F+
(565°C+)
Vacuum
Distillation
TOTAL
>C40
na
Light
Vacuum
Gas Oil
Heavy
Vacuum
Gas Oil
20.5
7.840
446c
0.501
12,479
15.6
8.090
608c
0.501
14,101
Residual Oil
18.0
8.298
707c
0.501
19,800
na
na
na
na
na
46,380
a
“C” refers to the number of carbon atoms in the hydrocarbon.
These values represent a median value for the range of compounds at atmospheric pressure.
c
Boiling points under vacuum (10 mm Hg) estimated using a nomograph.
na not applicable
Sources: Perry 1984, DOC 2003, CRC 1970, EPA 2005, SAS 2002, DOC 1995.
b
The energy required to raise the temperature of each fraction to its boiling point (bp) is
calculated by:
Heat Inputcrude fraction = masscrude fraction * Cp * ΔT = masscrude fraction * Cp * (Tbp – 77°F)
TMEatmospheric = ΣHeat Inputatmospheric crude fraction
= 22,067 Btu/bbl crude
Energy Bandwidth for Petroleum Refining Processes
22