Resource stocks in portfolio
Bạn đang xem bản rút gọn của tài liệu. Xem và tải ngay bản đầy đủ của tài liệu tại đây (1.21 MB, 3 trang )
Resource Investment
Volatility Matters: The Case for Investment
in Resource Stocks
Introduction
Investment by the public in resource stocks tends not to be
fashionable, thereby impacting adversely on resources job
security. Yet resources are one of the most significant
contributors to Australia's GDP. In fact, the resource sector
per employed person easily contributes the highest
proportion of GDP of all industries in Australia.
Over the last 20 years, stock-market return from the
investment in resource stocks has been about a third that
of other heavyweight industries (eg banking and
industrials). Therefore a fait accompli might be that public
investors would ignore resource stocks.
This article shows that ignoring resources is shortsighted,
because sophisticated investors look at more than the
industry returns. They consider the efficiency of the
investment, quantifying the returns and the variability in
those returns.
The efficiency of an investment portfolio depends critically
on how returns correlate between different stocks.
Resources have the desired low correlation with other
prominent industries, therefore adding resource stocks to a
portfolio will increase its efficiency.
Noll Moriarty
Email:
nmoriart@bigpond.
net.au
return. Over the last 10 years banks still dominated,
however resource performance was a little better, being
closer to industrials.
Return
St. Dev.
Averages
Banks
14.2%
17.0%
for 1980
Indust.
11.5%
17.0%
- 2001
Res.
4.0%
25.5%
Averages
Banks
16.3%
15.2%
for 1990
Indust.
9.7%
8.8%
"Industry Overview Output and employment
by industry" ABS,
/>sstats/abs@.nsf/0/B62C6
D55E5E1C19ACA2569DE0
0263EE8?Open
i
ASX/200
8.2%
18.0%
Table 1.
Return
St. Dev.
- 2001
Res.
6.5%
13.8%
Reserve Bank Statistical
Table F6, accessed 2 Nov
2001
/>tistics/Bulletin/index.html
#table_f
ii
ASX/200
8.8%
7.7%
Table 2.
Given this information, where should investors put their
money to maximise returns? All in banks, or diversify in
some proportion among these sectors?
Fig. 1. (Below)
and Fig. 2. (Bottom)
Mining contribution to GDP
Two measures of an industry's importance are its
contributions to GDP at basic prices and to employment. A
1998-99 ABS surveyi showed that manufacturing is the
most significant industry (12.5% contribution to GDP) and
is the second largest employing industry behind retail
trade.
Where does Mining fit in? Mining contributed 3.9% to GDP
and 0.9% to employment. Another way to look at these
statistics is to compute the ratio of percent GDP to percent
industry employment. Mining is by far the highest
contributing industry. It has a ratio of 4.3, compared with
1.2 average of all industries.
Resources Industry - Stock-market returns
Resources, Banks and Industrials are three main industries
for which stock-market dataii are available from the
Reserve Bank. Figure 1 shows their cumulative stockmarket
returns, assuming an index of 500 at December 1979. For
reference, the ASX/S&P 200 is shown.
During the 1980s, we see that industrials were the best
performer while resources had the lowest growth. During
the 1990s, it was the turn of banks to shine. Resources
growth was strong in the early part of the decade, but
poorer in the later half.
Annual returns of these industries, on a financial year basis,
are shown in Figure 2 and Tables 1 and 2. We see that over
the last 20 years, banks were the standout performer
(average return 14.2%), while resources had a 4% average
Preview DECEMBER 2001
31
Resource Investment
Correlation - Financial Concept
Financial analysts compute another measure of stock
performance - the correlation of its returns with other
stocks and industries. The correlation is required to calculate
the volatility of a portfolio.
A portfolio's expected return is easily found from the
weighted average of returns of the individual projects.
A portfolio's volatility is not the weighted average of
volatilities, but is related to the covariance between stocks'
return (see Moriarty (2001) for more discussion of this
concept).
The outcome is that in a portfolio, individual stock
volatilities cannot be added. As an example, it is possible to
have two industries with high volatilities. Yet when
combined, the portfolio volatility may be considerably lower
than either of the individual volatilities. This happens if the
correlation between these industries is low.
Financial diversification ("not putting all your eggs in one
basket") is mathematically a consequence of selecting
investments that have the lowest correlation. This reduces
the volatility of a portfolio, thereby increasing its efficiency.
Rolling annual correlations for banks/industrials,
resources/banks and resources/industrials are shown in
Figure 3 and Table 3. Note that banks/industrials had the
highest correlation (average 0.8), while resources/banks had
the lowest (average 0.5).
Fig. 3. (Top)
and Fig. 4. (Above)
Before we answer this question, we need to introduce two
concepts used by sophisticated investors - financial
volatility and correlation.
Financial Volatility Concept
Financial analysts consider not only the expected return of
an investment, but also quantify the volatility (uncertainty,
or the range of possible returns). The standard deviation of
the returns is taken as the measure of the volatility. Usually,
investments with a higher return for a given volatility are
favoured [Markowitz (1952, 1957) introduced this concept
of "Efficiency" to the financial world, and was later
awarded the Nobel Prize for Economics].
Tables 1 and 2 show the standard deviation (volatility) for
each of the industries. We see that since 1980, resources
have been the most volatile (25.5%), however in the last 10
years resources were less volatile than banks.
A portfolio of only resource stocks is clearly inefficient. To
be efficient, highest volatility should provide highest
returns.
Therefore, pundits might say that it is a waste of money to
invest in resources… but they would be wrong. There is
another factor to consider - correlation.
32
Preview DECEMBER 2001
Therefore a portfolio of only banks and industrials (which
both have higher returns than resources) is less diversified
than a portfolio of say only banks and resources. The case
is proposed that diversification in a portfolio should
include exposure to resources.
Average Correlation 1980 - 2001
Banks
Indust. Res.
ASX/200
Banks
1.0
0.8
0.5
0.7
Indust.
0.8
1.0
0.7
0.9
Res.
0.5
0.7
1.0
0.9
ASX/200 0.7
0.9
0.9
1.0
Table 3.
As an example, consider the performance of two portfolios
over the last 10 years. One portfolio had 50% banks and
50% industrials, the other had 35% of both banks and
industrials and 30% resources. The financial year average
returns are shown in Figure 4. The average returns for the
two portfolios were 12.4% and 11.6% respectively.
Many investors would prefer the non-resource portfolio,
yet its volatility was 10.6%, higher than the resource
portfolio 9.3%. To be relatively efficient, the non-resource
portfolio having being exposed to higher volatility, is
expected to achieve higher returns. (Note that higher
volatility does not guarantee higher returns, just that it
provides potential to achieve better returns).
Over the last financial year, these portfolios would have
had the same 17% return (Figure 5). The volatilities,
Continued On Page 33
Industry News
Minotaur Resources Announces Copper Find in
South Australia
This month's good news story must surely go to Minotaur
Resources Ltd, which is the operator of the Mt Woods Joint
Venture. On 14 November it announced a significant copper
discovery at the Prominent Hill Prospect (see Fig. right).
Fig. 1. Location of the
Mt Woods Joint Venture
Tenements and the
Prominent Hill Prospect.
The results of the first hole drilled to test a discrete gravity
anomaly measuring about 1500 x 500 m are shown in
Table 1.
From (m)
107.8
200.0
including: 272.0
429.0
To (m) Interval (m) Copper (%) Gold (g/t)
128.0
20.2
0.03
2.3
307.0
107.0
1.94
0.66
307.0
35.0
3.86
0.63
450.0
21.0
0.90
0.46
According to the announcement, "the vertical hole passed
through 108 m of younger sediments before intersecting a
massive haematite-supported breccia. Haematite
dominates both the matrix and breccia clasts. The hole
reached 450 m in mineralised haematite breccia at which
point drilling was terminated pending mineralogical
assessment and analytical data."
"Copper mineralisation (chalcocite) occurs as
disseminations and thin veins within the haematite matrix.
The chalcocite is concentrated at about the -300 m level,
Continued On Page 34
Continued From Page 32
though, were different. The non-resource portfolio had
10.6% volatility, compared with 9.3% for the resource
component portfolio. The latter portfolio is more efficient,
because it achieved the same return with a lower volatility.
The case is made that efficient investment portfolios
should contain some provision for resource stocks, despite
their lower average return. Typically, resource stocks form
about 5 to 20% of sophisticated investor's portfolios.
Determining the relative exposure of a stock in a portfolio
is a factor of each its expected returns, the volatility and
correlation of returns with other stocks. The optimal
exposure of a stock depends on how much volatility an
investor wishes to accept. Given this constraint of desired
volatility, Monte-Carlo modelling is usually employed to
determine the relative exposures that maximise the return.
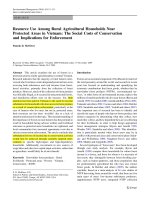
Summary
Resources are a significant and valuable contributor to
Australia's GDP. Cursory inspection of past returns would
suggest their performance is unattractive compared with
glamour stocks such as banking.
During certain periods, resource stocks are good
performers. However, the case is made that even during
times when resource stocks are not the best performers,
they should be included in a personal investment portfolio.
The returns from resource stocks have a lower correlation
with other major industries. Including resources therefore
decreases the volatility of a portfolio, thereby improving
the efficiency (stability) of its returns.
Fig. 5.
Investment in resource stocks should be actively
promoted. If the general public is made aware of concepts
such as portfolio efficiency, it will be to the benefit of all
those work in the resource industry.
References
Markowitz, H. M., 1952, Portfolio Selection: Journal of
Finance, VII, 1, 77-91.
Markowitz, H. M., 1957, Portfolio Selection--Efficient
Diversification of Investments: Blackwell publishers, Inc.,
Malden MA.
Moriarty, N., 2001, Portfolio risk reduction: Optimising
selection of resource projects by application of financial
industry techniques: Exploration Geophysics 32, 75-79.
Preview DECEMBER 2001
33