Chapter 9 Indicators of Sustainable Business Practices
Bạn đang xem bản rút gọn của tài liệu. Xem và tải ngay bản đầy đủ của tài liệu tại đây (1.9 MB, 31 trang )
9
Indicators of Sustainable Business Practices
Hyunkee Bae and Richard S. Smardon
Department of Environmental Studies,
SUNY College of Environmental and Science and Forestry
USA
1. Introduction
Since the end of the 1990s, businesses have started to systematically consider environmental
problems in terms of different positions and levels within a firm, such as design, purchase,
sale, and disposal (Welford, 2000). The United Kingdom published BS 7750, a standardized
specification for an environmental management system in 1994 and the International
Organization for Standardization (ISO) published ISO 14001 - an environmental
management standard in 1996. The main goal of these standards is to help all kinds of
organizations to establish and implement environmental management systems by
systematically setting up environmental policies, practices, objectives, and targets. The
number of organizations with ISO 14001 certification around the world rapidly increased to
13,368 in December of 1999 to 129,031 in December of 2006 (Corporate Risk Management
Company, 2000:2007).
Welford (2000) insisted that Environmental Management Systems (EMSs), such as ISO
14001, are no longer options. However, there are some problems with EMSs. The ISO 14001
standard does not promote the flexibility needed to handle continuously changing
environmental issues (Moxen & Strachan, 1998). The ISO 14001 mostly depends on action
control and results based on environmental impacts, rather than social and ethical control.
Thompson (2002) pointed out three areas of ISO 14001 that should be described: (i) social
aspects and impacts and how to control them; (ii) guidelines for a set of widely recognized
and accepted environmental performance principles; and (iii) a method to communicate
environmental performance information to external stakeholders and decision makers. To
address these areas, businesses should go even further than environmental management
systems and completely integrate all the components of sustainable development into a new
way of doing business (Welford, 2000). In addition, a variety of interested parties, such as
governments, “green” consumers, and “green” investors, are also encouraging firms to
incorporate their environmental management systems and sustainable development into
their decision-making process for sustainable business practices and/or strategies.
Companies could implement sustainable business practice to meet these demands for
interested parties on sustainable business. To effectively implement sustainable business
practices, firms need to know the kinds of indicators that meet the characteristics or
concepts of sustainable business practices.
Based on these needs, we aims to identify whether or not firms have applied sustainable
business practices based on the Triple Bottom Line (Environmental, economic, and social
www.intechopen.com
178
Environmental Management in Practice
areas). To accomplish this goal, we conducted two surveys. The first survey identified the
trends of indicators in terms of the TBL used to describe sustainable business practices. The
second survey assessed the degree to which firms have issued performance reports and
what kinds of keywords were used in the titles of these reports.
2. Literature review
2.1 Sustainable business
There is no single definition of sustainable business, as there is for sustainable development
(Azapagic, 2003). A lack of a common accepted definition of sustainable business is the
most critical problem because the definition is a fundamental tool to carry out new policies
and actions. To overcome this, a few institutions have introduced the definition of
sustainable business. The Evergreen Group (2008), a business brokerage dedicated to
sustainable business, defines that a sustainable business is a business that carries out an
environmentally friendly business processes without negative environmental impacts
related to their activities, products, and services. Sustinable business.Com1 (2009) says that
sustainable business is “a business that contributes to an equitable and ecologically
sustainable economy.” Based on these examples of the definitions of sustainable business,
sustainable business offers products and services that fulfill society's needs while
contributing to the well-being of all earth's inhabitants. Sustainable business is a new,
radical paradigm that considers the ecological, social, and economic impacts in a way that
will not compromise the needs of future generations (Azapagic & Perdan, 2000; Welford,
2000). Azapagic and Perdan (2000) asserted that firms need a paradigm shift if firms want to
integrate sustainable development into their business.
Sustainable business requires effective harmonization of a Triple Bottom Line (TBL), which
is the environmental, economic, and social areas. Since the TBL is the key element of
sustainable development, firms that carry out sustainable business should not only
understand the TBL, but also integrate it into their policies or strategies and decisionmaking processes (Desimone & Popoff, 1998; WBCSD, 2000).
The environmental area consists of environmental impacts related to an organization’s
diverse activities, products, and services. These environmental indicators should be
identified in all stages of the organization’s full life cycle because they are used to track
environmental progress, support environmental policy evaluation and inform the public.
Examples of environmental indicators are energy and water consumption, air pollution, and
solid and hazardous waste produced.
The economic area includes an organization’s economic values and performance that are
explained by economic indicators. The economy provides solutions and methods to invest in
protecting the environment and conservation of natural resources as well as to sustain
society. Examples are annual profits and sales, Research & Development investment, fines,
capital investment, and share values or annual returns.
The social area is related to wider responsibilities that business has to communities within
which it operates and to society in general, including both present and future generations.
Since the importance of social and ethical responsibilities of a company is gradually
1
Sustinablebusiness.Com: SustainableBusiness.com is an organization that “provides global news and
networking services to help green business grow, covering all sectors: renewable energy, green
building, sustainable investing, and organics” />
www.intechopen.com
Indicators of Sustainable Business Practices
179
increasing, its social responsibility has become a constituted element within what society
expects from business. A few international organizations and institutions, such as the
European Commission (EC), have developed and launched a variety of standards relevant
to corporate social and ethical responsibility around the world. For instance, the Social
Accountability 8000 (SA 8000)2 focused on social and ethical issues, and on Corporate Social
Responsibility (CSR). It is not easy to define and quantify social indicators in terms of
physical indicators like economic and environmental indicators. Nevertheless, many firms
have set up a realistic goal to continuously measure these indicators in a comparable
manner across organizations by using qualitative social indicators. These sets of qualitative
social indicators are used to evaluate sustainable business embedded in the concept of
sustainable development. Examples of social indicators are: (i) human development and
welfare (e.g., education and training and health and safety); (ii) equity (e.g., wages, equal
opportunity, and non-discrimination); and (iii) ethical considerations (e.g., human rights
and child labor abolition) (Azapagic, 2003).
2.2 Voluntary communication to the public
A firm that would like to apply sustainable business could voluntarily communicate diverse
performance of their practices to the public because interested parties want to know
information about the firms’ sustainable business practices (Adams, Houldrin & Slomp,
1999). Voluntary reporting information about firms’ environmental and social performance
is becoming a powerful and popular tool to communicate with the public because interested
parties can use such information to evaluate firms’ activities and performance (Feldman,
Soyka, & Ameer, 1996; Sasseville, Willson, & Lawson, 1997). Internal or external reporting
systems can have a significant effect on corporate culture for sustainable business because
they are designed to support positive behaviors in terms of sustainable development.
Since the early 1990s, a few companies, such as Monsanto and Kodak, have disclosed
outcomes of their environmental performance according to their own indicators. However,
the lack of credibility and verifiability of the indicators and outcomes disclosed in these
reports has become a significant problem (Lin & Wang, 2004; Thompson, 2002).
To overcome these problems, in 2002, the Global Reporting Initiative (GRI) published the
2002 GRI Sustainability Reporting Guidelines based on the concepts of sustainable
development (Lin & Wang, 2004 ; Thompson, 2002). The GRI guidelines propose principles
and general indicators to report an organization’s performance in terms of the TBL:
economic, environmental, and social dimensions. After publishing the GRI guidelines, many
companies like 3M have integrated their own indicators into the GRI guidelines. SmiXXX
(06) said that it used the Global Reporting Initiative’s 2002 Sustainability Reporting
Guidelines to increase the credibility of its information and reports. In 2002, the European
Commission (EC) published “Corporate Social Responsibility (CSR): A business
contribution to Sustainable Development”. The EC formally defined corporate social
responsibility:
2 Social Accountability 8000: Social Accountability 8000 was developed by the Council on Economic
Priorities Accreditation Agency in 1997. “SA8000 is promoted as a voluntary, universal standard for
companies interested in auditing and certifying labour practices in their facilities and those of their
suppliers and vendors. It is designed for independent third party certification”
http:// www.mallenbaker.net/csr/CSRfiles/SA8000.html
www.intechopen.com
180
Environmental Management in Practice
CSR is a concept whereby companies integrate social and environmental concerns in
their business operations and in their interaction with their stakeholders on a voluntary
basis. (p. 7)
The Corporate Social Responsibility (CSR) standard includes environmental, financial, and
social performance information related to sustainable development. To meet the demands of
the public for corporate social responsibility, many companies, such as Kodak and Ford, are
annually disclosing the performance reports of their sustainable business practices with
different titles, such as “Corporate Social report,” and “Sustainability Report” to the public.
2.3 Indicators for sustainable business practices
An indicator is a measurement that shows the status of an environmental, economic, or
social system over time (Redefining Progress, Sustainable Seattle, and Tyler Norris
Associates, 1997). The goals of indicators are:
to monitor and evaluate effectiveness and performance of goals and targets of
sustainable business (Bennett & James,1999; Parris & Kates, 2003);
to communicate to diverse stakeholders (Thompson, 2002). Indicators can help
stakeholders, including the pubic, decision makers, and managers, to assist in decisionmaking about sustainable business (Kuhndt & Geibler, 2002); and
to compare actions and performance of firms that may or may not be implementing
sustainable business (Kuhndt & Geibler, 2002).
With these objectives in mind, numerous companies and international organizations, such
as the International Organization for Standardization and the Global Reporting Initiatives,
have developed a set of indicators to measure progress of environmental performance and
sustainable business. Many organizations are using diverse indicators to integrate current
environmental management systems into sustainable business.
Indicators for sustainable business practices can be expressed in many different forms (e.g.,
qualitative or quantitative, general or specific, and absolute or relative), in accordance with
objectives and applications of an indicator. Quantitative indicators are measured in terms of
mass, volume or number of environmental pollutants or physical materials. Examples of
quantitative indicators are total amount of air emissions like CO2, or total volume of
hazardous waste. Not all indicators will be quantitative, and some will have to be expressed
qualitatively because they cannot be defined in physical terms (Azapagic & Perdan, 2000).
Qualitative indicators are expressed interpretively. Qualitative indicators include social
dimensions of a firm’s activities, such as changes in cultural values or equity (Azapagic &
Perdan, 2000). Sustainable business could be described by both qualitative and quantitative
metrics because both are required to explain whether or not an organization’s diverse
activities consider or meet human needs and social demands (Daly, 1990; Azapagic &
Perdan, 2000). Thus, many firms are setting up qualitative indicators as a substantial goal to
measure the progress of the firms’ policies even though qualitative indicators are difficult to
define in physical terms (Azapagic & Perdan, 2000).
Indicators can also be divided into general and specific indicators (Verfaillie & Bidwell,
2000). General indicators are used by businesses across all industries in the world. These
general indicators can be used to measure issues that have already been discussed globally,
such as an international agreement or consensus: Agenda 21, Montreal Protocol, and Kyoto
Protocol (global warming) (Verfaillie & Bidwell, 2000; Muller & Sturm, 2001). General
indicators include energy, water and material consumption, greenhouse gas emissions,
carbon dioxide, methane, and air emissions per unit product. These indicators can be used
www.intechopen.com
Indicators of Sustainable Business Practices
181
to compare one organization’s performance against another’s. Specific indicators are defined
differently and measured in accordance to characteristics of each industry or firm (Verfaillie
& Bidwell, 2000). For instance, Chemical Industries Association (2002) established the
Responsible Care (RC) program for companies in the chemical industry. RC is the chemical
industry's global voluntary initiative program.
Indicators for sustainable business practices can be expressed in absolute or relative forms.
Absolute indicators are used to measure a firm’s quantitative environmental and social
impact related to its activities, products, and services. Thompson (2002) said that absolute
indicators are expressed in terms of measured quantities: total amount of energy consumed
a year, total amount of water consumed, total amount of wastewater, and total amount of
hazardous waste generated. These indicators can provide managers or the pubic with
incomplete information relevant to operational levels because these indicators use a single
value to represent how much a firm has accomplished towards its goals and targets over
time (Bennett & James, 1999). For instance, a firm reduces the total energy consumed this
year by 5% compared to last year’s total. A manager cannot determine whether or not this
reduction is an environmentally positive result since the reduction of energy could be the
result of other factors, such as reduction of productivity, rather than actual improvements of
environmental activities and technologies. Relative indicators were introduced to address
this problem of absolute indicators.
Relative indicators are expressed in terms of a ratio or proportion that compares an absolute
indicator with another absolute indicator (Thompson, 2002). Azapagic and Perdan (2000)
argue that relative indicators enable firms and interested parties to evaluate improvement
from year to year and figure out more sustainable opportunities and practices. Thus, relative
indicators could help stakeholders understand whether or not a company truly increases
efficiency of emissions by measuring levels of pollutant per unit of production (Bennett &
James, 1999). Examples of relative indicators are eco-efficiency indicators, such as carbon
dioxide emissions per unit of output, ratio of waste per unit of input material, ratio of total
hazardous solid waste per unit of product, etc. These relative indicators can be used to
measure the constant economic value of natural capital stocks. However, Bennett and James
(1999) mentioned that relative indicators also have a problem because they do not show the
total amount of pollutants in terms of absolute values, which could be used as firm to firm
benchmarking. To resolve these problems of absolute and relative indicators, many
companies choose to use both types of indicators to evaluate and report their performance.
3. Data collection
We conducted two surveys. To conduct the first survey, we collected firms’ annual
performance reports announced to the public through Internet media. There are two reasons
why these performance reports were collected. The first reason is because the changes in the
types of indicators for sustainable business practices were described in those performance
reports. The second one is that the changes in the performance reports announced through
Internet mass media can be used to investigate the extent to which firms have
communicated their performance reports to the public.
Sample performance reports for the first survey were collected from January 1999 to
December 2006. Since the ISO published ISO 14031 Environmental Performance Evaluation -
www.intechopen.com
182
Environmental Management in Practice
guidelines in 1999, firms might have gained interest in reporting their environmental
performance beginning in 1999. 2006 is the most current year that firms’ performance
reports could be collected through firms’ Internet homepages.
The announcements that were disclosed the performance reports were identified by using
newswire databases; ABI/Inform, Global, Business & Industry, Business & Company
Resource Center, and LexisNexis. The key words used to find the announcement events
were “Environmental Performance,” “Reports,” “Sustainability,” “Corporate Social
Responsibility,” and “Citizenship.” The following criteria were used to collect sample data:
Only publicly traded firms on the New York Stock Exchange (NYSE) were considered;
Companies in the information, finance, and insurance industry were excluded because
their businesses did not generate direct environmental pollution; and
Firms that provide their performance reports (PDF file) were included.
Companies have created and continuously updated their Internet homepages to provide
environmental and social performance reports. After identifying firms that announced their
performance reports, the performance reports of sample firms were collected through each
firm’s Internet homepage. The Internet Archive Organization3 was used to find the
performance reports of companies that did not provide previous performance reports
directly from the current homepage. The internet archive organization provides archive data
of a firm’s Internet homepage according to the day that the firm updated the homepage. The
North American Industry Classification System (NAICS) was used to classify types of
industries A firm’s NAICS code categorized by the Wharton Research Data Service (WRDS)
was used.
The indicators for sustainable business practices were selected by reviewing diverse
environmental and sustainable indicator guidelines, such ISO 14031, GRI guidelines, the
Organisation for Economic Co-operation and Development (OECD), Social responsibility,
and other researchers.
The second survey was conducted to identify the current trend in the titles of firms’
performance reports. The terms used as key words in titles of firms’ performance reports
could be used to identify the main themes or strategies of the reports (Bruemmer, 2000).
Performance reports have been given diverse titles, such as “Environmental Reports,”
“Environmental, Health, and Safety Report,” “Sustainable Reports,” “Corporate Social
Reports,” “Citizenship Report,” etc. If a firm used “Environmental” as a key word in the
titles of its performance report, it means that the firm did not set up social and economic
indicators, which are the fundamental indicators of sustainable business. However, if a firm
used the terms, “Social Responsibility,” “Corporate Social Responsibility,” “Sustainability,”
and “Citizenship” as key words, it could indicate that the firm has likely incorporated the
concepts of sustainable development into its business strategies, which is sustainable
business. This is because these terms are evolved from the concept of sustainable
development.
For the second survey, we used S&P 500 firms as of December 2006 that reported their
performance reports to the public in 2007. Since 2006 performance reports, disclosed in 2007,
were the most current reports that could be collected through the Internet, they were chosen
as the sample. Thus, the Internet homepages of S&P 500 sample companies were searched to
identify annual sustainability or environmental reports for 2006. Among S&P 500 firms, a
3 Internet Archive Organization is “a 501(c)(3) non-profit that was founded to build an Internet library,
with the purpose of offering permanent access for researchers, historians, and scholars to historical
collections that exist in digital format” />
www.intechopen.com
183
Indicators of Sustainable Business Practices
few industries (e.g., Information; Finance and Insurance; Real Estate and Rental and
Leasing; Educational Services; and Health Care and Social Assistance) were excluded from
the sample because they neither generated environmental pollution nor had heavy
environmental burdens.
4. Results and discussion
4.1 Changes in indicators for sustainable business
We found eighty-nine announcements eighty-nine announcements published by 40
companies through Internet media. Approximately eighty-eight percent (78
announcements) of the total sample was taken from the manufacturing industries (NAICS
code 31, 32, and 33). The rest of the total samples (21 announcements) was disclosed by
firms in other industries: the mining industry (NAICS code 21), the utilities industry
(NAICS code 22), the miscellaneous store retailers (NAICS code 45), and the couriers and
messengers industry (NAICS code 49). Table 1 presents the distribution of the sampled
companies based on the NAICS. Table 2 lists the types of manufacturing industries. Of the
NAICS
Title
(Two digit)
Mining (21)
Utilities (22)
Manufacturing
(31,32,33)
Miscellaneous
Store Retailers(45)
Couriers and
Messengers (49)
Total
Year
Three
digit
212
221
311
312
316
321
322
324
325
331
333
334
335
336
'99
'00
'01
'02
'03
Total
'04
'05
'06
Number
%
1
1
2
1
1
2
1
1
2
3
1
1
3.4%
4.5%
2
3
3
2
2
2
1
3
3
4
4
3
4
3
3
11
14
8
4
9
2
13
1
1
1.1%
1
1
3
3.4%
26
28
89
1
1
1
1
2
3
2
1
3
1
1
1
1
1
1
1
1
1
1
1
1
1
2
1
4
2
2
3
1
5
2
453
492
1
2
1
5
4
11
12
Table 1. Distribution of Sampled Companies Based on the NAICS
www.intechopen.com
87.6%
184
Environmental Management in Practice
NAICS
311
312
316
321
322
324
325
331
333
334
335
336
Type of Manufacturing
Food Manufacturing
Beverage and Tobacco Product Manufacturing
Leather and Allied Product Manufacturing
Wood Product Manufacturing
Paper Manufacturing
Petroleum and Coal Products Manufacturing
Chemical Manufacturing
Primary Metal Manufacturing
Machinery Manufacturing
Computer and Electronic Product Manufacturing
Electrical Equipment, Appliance, and Component Manufacturing
Transportation Equipment Manufacturing
Total
Number (%)
4 (5%)
3 (4%)
4 (5%)
3 (4%)
3 (4%)
11 (14%)
14 (18%)
8 (10%)
4 (5%)
9 (12%)
2 (3%)
13(17%)
78
Table 2. Types of Manufacturing in the Sample Announcements
78 announcements in the manufacturing industries, 55 announcements (71%) are from firms
in petroleum and coal products manufacturing, chemical manufacturing, primary metal
manufacturing, computer and electronic products manufacturing, and transportation
equipment manufacturing. The main reason why firms in these manufacturing industries
have disclosed their performance reports more often than in other industries is that firms
producing final consumer goods proactively meet needs and avoid potentially adverse
stakeholders’ reactions (Anton, Deltas & Khanna, 2004). Anton et al. (2004) said that firms
that produce consumer goods are pressured by environmental interests more than firms that
produce industrial goods. To proactively respond to the increasing environmental pressures
and social responsibilities, firms producing consumer goods have actively communicated
their environmental and social information to their interested parties.
We could not find many announcements in the mining sector related to the disclosure of
environmental or sustainable performance reports during 1999 to 2006. Three
announcements were reported by one firm, BXXX Ltd. Other firms in this industry have
reported and provided their environmental performance reports on their Internet
homepages. For instance, CXXX has reported the performance of a few environmental and
social indicators relevant to sustainable development on its Internet homepage. It has
monitored the performance of environmental and social indicators since 2005.
Since the utilities industry has to use natural capital to produce their products, such as
electric power, natural gas, and fuel, it is one of the critical industries for sustaining society,
doing business, and for activities such as the operation of factories and the routine activities
of daily life. We found just four announcements in the utilities industry that were reported
by. It does not seem that many firms in this industry proactively communicate their
performance reports to the public. However, they have started disclosing their performance
reports on Internet homepages since 2005 or 2006. For example, SXXX Company began
providing its Corporate Responsibility Reports in 2006. To proactively respond to the
increasing requirements of firms’ performance reports, they might realize that they should
disclose their social and environmental performance reports.
www.intechopen.com
185
Indicators of Sustainable Business Practices
OXXX in the miscellaneous store retailers industry announced its performance reports based
on the concept of sustainable development and business in 2006. Some firms in this industry
have also reported their environmental or sustainability performance reports. For instance,
StaXXX Inc. has been reporting its corporate responsibility, which includes a few sustainable
business indicators, on its Internet homepage since 2006.
There were three announcements of environmental or sustainable performance reports in
the couriers and messengers industry. They were reported by UXXX. UXXX has disclosed its
sustainability reports since 2003. Like the utilities industry and the miscellaneous store
retailers industry, a few firms like FXXX had provided their environmental or sustainable
performance reports on their Internet homepages.
4.1.1 Increasing announcements
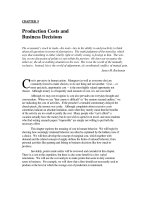
Figure 1 shows the trends of the announcements of the disclosure of firms’ performance
reports during 1999 to 2006. We did not find many firms that announced their performance
reports through diverse Internet media even though they began reporting their
environmental performance in the early 2000s. This is consistent with previous studies.
When Hamilton (1995) studied how media and stock market responded to the disclosure of
the Toxic Release Inventory (TRI) data, he used 50 firms that reported TRI data through the
media. This indicates that firms did not progressively communicate their environmental
information to the public. Firms did not use various communication tools to inform the
public about their environmental performance reports. According to Figure 1, the number of
announcements of the disclosure of firms’ performance reports has been gradually
increasing since 2003. Firms that announced performance reports before 2002 were in the
manufacturing industry. From 2003, firms in other industries, such as the couriers and
messengers, the mining, and the utilities industries, started announcing their performance
reports through diverse Internet media. There are two reasons why the number of
announcements of firms’ performance reports might have increased since 2003.
Number of Event
'
'
'
'
'
'
'
'
Year
Fig. 1. Trends of the Announcements from 1999 to 2006
The first reason is that after 2003 firms might have recognized that voluntarily announcing
their performance reports by using various Internet media is a powerful tool to inform the
public of their performance reports (Feldman et al, 1996; Sasseville et al., 1997). Firms can
www.intechopen.com
186
Environmental Management in Practice
use their socially and environmentally friendly management activities as key information in
their marketing strategies because environmental and social information has been gaining
significance as a marketing tool since the early 2000s. Another reason is that a few
international guidelines relevant to the disclosure of environmental, social, and economic
performance reports have been published since 2002, such as the 2002 GRI Sustainability
Reporting Guidelines which is the fundamental guidelines of all GRI documents (GRI, 2004).
The 2002 GRI guidelines included more detailed performance indicators of three sustainability
dimensions (economic, environmental, and social) than the 2000 GRI guidelines first published
by the GRI in 2000. Thus, many firms have actively adopted the 2002 GRI guidelines not only
to voluntarily implement sustainable business, but also to voluntarily communicate the
performance of sustainable business. After publishing the GRI guidelines, many global firms
have integrated their own indictors into the GRI guidelines to meet the needs of their
interested parties. For example, UXXX announced its first corporate social responsibility report
with the title “Operating in Unison UXXX 2002 Corporate Sustainability Report” on Nov 14,
2003. In this report, they mentioned, “We used the Global Reporting Initiative (GRI) as the
foundation for writing our first Corporate Sustainability Report.”
4.1.2 Identifying sustainable business indicators (SBIs)
After reviewing diverse environmental and sustainable indicator guidelines, such as the GRI
guidelines, a total of 90 general indicators were selected. Table 3 shows the list of 90 general
indicators. These general indicators were separated into seven categories in order to identify
absolute and relative indicators types for sustainable business based on the TBL: 22
Environmental indicators; 14 economic indicators; 16 social indicators; 15 economic and
environmental (eco-efficient) indicators; 7 social and environmental (socio-environmental)
indicators; 6 social and economic (socio-economic) indicators; and 10 environmental,
economic and social (integrated) indicators.
Environmental, economic, and social indicators are absolute indicators. Eco-efficient, socioenvironmental, socio-economic, and integrated indicators are relative indicators used to
implement sustainable business practices. Socio-environmental indicators are focused on
environmental impacts that affect social impacts, and vice versa. Azar, Holmberg, and
Lindgren (1996) mentioned that the goal of the socio-environmental indicators is to serve as
a tool in planning and decision-making processes at various managerial levels within
society. Socio-economic indicators are related to the relationship between a firm’s economic
activities and social effects. Socio-economic requires firms not only to consider one or more
social impacts, but also one or more economic impacts (Etzioni, 2003). Unlike socioenvironmental and socio-economic indicators, eco-efficient indicators are more easily
understood and quantified than those of the socio-environmental and socio-economic
indicators. Eco-efficient indicators incorporated with environmental and economic
indicators mean business’s activities that increase economic values while decreasing
ecological impacts and using natural capital stocks (Desimone & Popoff, 1998). Integrated
indicators are comprehensively incorporated with economic, environmental, and social
issues of the TBL. They are systematic and fundamental indicators that are built from the
concepts of sustainable business as well as supporting the other indicators.
To identify the general indicators for sustainable business, a pilot survey was conducted.
This pilot survey was implemented by identifying whether or not each indicator of 90
general indicators was popularly reported in each pilot sample, which is a firm’s report. Of
the 89 sample firms’ reports, 38 performance reports disclosed in 2004 and 2005 were
selected as pilot samples in order to select a sample of firms in the industries that
www.intechopen.com
187
Indicators of Sustainable Business Practices
significantly affect environmental and social impacts, such as the mining, utilities, and
manufacturing industries. Firms in the mining industry started announcing their
performance reports in 2004 and firms in the utility industries announced their performance
reports in 2005 through Internet media. General indicators that were reported in over 60% of
the samples of the pilot survey are defined as sustainable business indicators (SBIs) for this
research. Table 3 shows the results of the pilot survey.
Based on Table 3, the distribution of general indicators in each category is as follows: 9
environmental indicators; 5 economic indicators; 10 social indicators: and 5 integrated
indicators. We did not find relative indicators, such as socio-environmental and socioeconomic indicators that were reported in over 60% of the pilot sample. Based on the results
Not
Reporting(%)
34(90%)
14(37%)
8(21%)
7(18%)
0(0%)
15(40%)
35(92%)
20(53%)
12(32%)
17(45%)
4(10%)
24(63%)
30(79%)
31(82%)
38(100%)
23(60%)
3( 8%)
18(47%)
26(68%)
21 (55%)
Environmental
Reporting
(%)
1)Total amount of water used
2)Total amount of materials used to package product
3)Total amount of materials used to produce products
4)Total amount of renewable resources used
5)Total amount of non-renewable resources used
6)Total amount of recycled or reused materials used
7)Total amount of energy used
8)Total amount of renewable energy used
9)Total amount of non-renewable energy used (oil)
10)Concentration of a specific contaminant in tissue of a specific plant
species found in the local or regional area
11)Habitats protected or restored
12)Strategies, current actions, and future plans for managing impacts on
biodiversity
13)Total amount of greenhouse gases generated (CO2)
14)Total amount of emissions of ozone-depleting substances
15)Total amount of Volatile Organic Compound (VOC) generated
16)Total amount of air emissions generated (SOx, NOx)
17)Total amount of waste recycled or reused
18)Total amount of solid waste generated
19)Total amount of hazardous waste generated
20)Total number and volume of significant spills and accidents
21)Total amount of wastewater
22)Total number of environmental violations
20(53%)
16 (42%)
18(47%)
22(58%)
38(100%)
18(47%)
24(63%)
28(74%)
26(68%)
32(84%)
31(82%)
21(55%)
16(42%)
30(79%)
0(0%)
20(53%)
14(37%)
10(26%)
12(32%)
6(16%)
7(18%)
17 (45%)
22(58%)
8(21%)
Economic
Indicators
1)Annual profits
2)Annual revenues
3)Annual sales
4)Annual operating costs (based on EHS)
5)Costs saving (based on EHS)
6)Capital expenditure (environmental)
7)Annual productivity
8)Fines
9)R & D investment (Based on EHS)
10)R & D investment (total)
11)Donations
12)Annual turnover
13)Value added
14)Stock price/dividends
23(61%)
18(47%)
30(79%)
14(37%)
8(21%)
11(29%)
15(40%)
28(74%)
8(21%)
24(63%)
37(97%)
3(8%)
0(0%)
19(50%)
15(39.5%)
20(52.6%)
8(21.1%)
24(63.2%)
30(78.9%)
27(71%)
23(60%)
10(26%)
30(79%)
14(37%)
1(3%)
35(92%)
38(100%)
19(50%)
www.intechopen.com
188
Environmental Management in Practice
Reporting
(%)
Not
Reporting(%)
26(68%)
21(55%)
26(68%)
23(61%)
26(68%)
33(87%)
20(53%)
12(32%)
27(71%)
25(66%)
20(53%)
35(92%)
31(82%)
12(32%)
17 (45%)
12(32%)
15(40%)
12(32%)
5 (13%)
18 (47%)
26(68%)
11 (29%)
13(34%)
18(47%)
3( 8%)
7(18%)
27(71%)
10(26%)
7(18%)
11 (29%)
28(74%)
31(82%)
1)Training time/total amount of solid waste generated
2)Employee’s training time /total amount of energy used
3)Total solid waste/employee
4)Total amount of energy used /employee
3(8%)
2(5%)
5(13%)
3(8%)
35(92%)
36(95%)
33(87%)
35(92%)
5)Voluntary activities/total amount of energy used
6)Recordable illness rate/total amount of energy used
7)Lost time rate/total amount of energy used
0(0%)
0(0%)
0(0%)
38(100%)
38 100%)
38(100%)
1)Training time of employee per profit
2)Sales per employee
3)Lost time rate per profits
4)Donations per sales
5)Donations per profit
6)Donations per revenue
2(5%)
0(0%)
0(0%)
0(0%)
0(0%)
0(0%)
36(95%)
38 (100%)
38(100%)
38(100%)
38(100%)
38(100%)
1(3%)
1(3%)
1(3%)
0(0%)
0(0%)
0(0%)
21(55%)
1(3%)
2(5%)
0(0%)
0(0%)
0(0%)
0(0%)
0(0%)
0(0%)
37(97%)
37(97%)
37 (97%)
38 (100%)
38 (100%)
38(100%)
17(45%)
37(97%)
36 (95%)
38 (100%)
38(100%)
38(100%)
38(100%)
38(100%)
38(100%)
Eco-efficiency
Social –
economic
SocialEnvironmental
Social
Indicators
1)Female, disabled person’s rights
2)Abolition of all child labor
3)The recruitment of people from ethnic minorities, older workers, women
4)Empowerment of employees
5)Average hours of training per employee
6)Number of employees
7)Employment creation
8)Employment turn over
9)Recordable Illness rate (RIR)
10)Lost time Rate (LTR)
11)Total number of work-related fatalities
12)Whether or not firms implement a broad range of voluntary activities
13)Whether or not firms provide opportunities to communicate internally
and externally to interested parties
14)Breakdown of employees in terms of gender, age, and minority group
15)Ratio of basic salary of men to women by employee category
16) Whether or not equity was mentioned
1)Total amount of material used / sales
2)Total amount of material used /profits
3)Total amount of solid waste /revenue
4)Total amount of non-renewable energy used / sales
5)Total amount of non-renewable energy used / sales
6)Total amount of non-renewable energy used / revenues
7)Total amount of energy used / sales
8)Total amount of energy used /revenues
9)Total amount of toxic materials generated/sales
10)Total amount of toxic materials generated /profits
11)Total amount of material recycled and reused/ales
12)Total amount of material recycled and reused /revenue
13)Total amount of global warming materials generated/sales
14)Total amount of global warming materials generated/profits
15)Total amount of global warming materials generated/ revenue
www.intechopen.com
189
Indicators of Sustainable Business Practices
Integrated
Indicators
1)Whether or not firms implement voluntary environmental management
systems (ISO 14001, LCA, etc)
2)Whether or not firms implement environmental accounting
3)Whether or not firms make decisions based on the concept of sustainable
business and long-term objective
4)Whether or not firms enlighten consumers and suppliers for the concept
of sustainable business
5)Whether or not firms deal with the impact on the Third World
6)Whether or not being verified their performance reports by third parties
7)Whether or not firms compare GRI
8)Whether or not firms mention culture
9)Whether or not firms survey in the reports (feedback)
10)Whether or not firms compare performance based on standard year (tota
l values/relative values)
Reporting
(%)
Not
Reporting(%)
28(74%)
10(26%)
2(5%)
29(76%)
36(95%)
9(24%)
27(71%)
11(29%)
16(42%)
14(37%)
22 (58%)
24(63%)
25(66%)
28(74%)
16(42%)
21(55%)
13(34%)
10(26%)
22(58%)
17 (45%)
Table 3. The List of 90 General Indicators and the Results of Pilot Survey (Sustainable
Business Indicators over 60% of the sample) (N=38)
of the pilot survey, firms were not familiar with relative indicators. Since many firms had
already measured and reported absolute indicators, absolute indicators made up a larger
proportion of the SBIs than relative indicators such as socio-economic and socioenvironmental indicators. With 29 SBIs identified from the pilot survey, a full survey was
conducted to identify SBIs in the total sample of 89 firm’s reports. Table 4 shows the results
of the full survey.
4.1.3 Changes in sustainable business indicators disclosed in performance
Eighty-nine sample companies were separated into two categories, category I (1999 ~ 2002)
and category II (2003~2006), to compare the trends of sustainable business indicators over a
time period. These two categories were divided based on the year 2003 because the number
of firms that announced their performance reports increased beginning in 2003. To compare
the trends of sustainable business indicators, we chose firms in the manufacturing industries
because all firms in category I were in the manufacturing industries. Among the 89 sample
companies, the 78 announcements disclosed by the manufacturing industries were divided
into category I (12 firms) and category II (66 firms).
To identify the changes in SBIs used in manufacturing firms, we added four indicators to the
previously defined 29 sustainable business indicators; total amount of renewable energy used
(solar energy, clean energy); whether or not firms describe environmentally friendly product
or process; abolition of all child labor; and whether or not firms use relative indicators (ecoefficiency). Although some of these four indicators were not reported at over 60% in the pilot
survey, they are considered necessary by the authors as indicators to evaluate the
characteristics of sustainable business. Total amount of renewable energy used and whether or
not firms develop or describe environmentally friendly product or process are used to evaluate
whether or not firms apply diverse technologies to implement sustainable business; whether
or not firms use relative indicators, such as eco-efficiency, is used to identify the consistency of
natural capital stocks; and abolition of all child labor is used to evaluate the social performance
of sustainable business. Thus, we used a total of 33 SBIs to identify the trends of sustainable
business indicators of firms in the manufacturing industries. The trends of sustainable
business indicators used in category I and category II is shown in Table 5.
www.intechopen.com
190
Environmental Management in Practice
No. of Firms Reporting (%)
Integrated Indicators
(reference)
Social Indicators
Economic
Indicators
Environmental Indictors
Indicators
No. of Firms
Not
Reporting
Sub-total
(%)
Quant.
indicator
Qual.
indicator
1)Total amount of water used
66
13
79(89%)
2)Total amount of energy used
69
16
85(96%)
4(4%)
3)Total amount of greenhouse gases generated (CO2)
70
17
87(98%)
2(2%)
4)Total amount of Volatile Organic Compound (VOC)
generated
38
16
54(61%)
35(39%)
10(11%)
5)Total amount of air emissions generate (SOx, NOx)
65
14
79(89%)
10 (11%)
6)Total amount of waste recycled or reused
51
26
77(87%)
12(13%)
7)Total amount of solid waste generated
54
28
82(92%)
7(8%)
8)Total amount of hazardous waste generated
56
19
75(84%)
14 (16%)
9)Total number of environmental violations
44
24
68(76%)
21(24%)
1)Annual profits
44
13
57(64%)
32(36%)
2)Annual sales
68
12
80(90%)
9(10%)
3)Fines
49
12
61(69%)
28(31%)
4)R & D investment (total)
30
22
52(58%)
37(42%)
5)Donations
52
3
85(96%)
4(4%)
1)Female, disabled person’s rights
0
59
59(66%)
30(34%)
2)The recruitment of people from ethnic minorities, older
workers, women
0
56
56(63%)
33(37%)
3)Empowerment of employees
0
58
58(65%)
31(35%)
4)Average hours of training/ employee
4
71
75(84%)
14(16%)
5)Number of employees
61
20
81(91%)
8(9%)
6)Recordable illness rate (RIR)
68
2
70(79%)
19(21%)
7)Lost time rate (LTR)
64
1
65(73%)
24(27%)
8)Whether or not firms implement a broad range of
voluntary activities
0
82
82(92%)
7(8%)
9)Whether or not firms provide opportunities to
communicate internally and externally to interested
parties
0
78
78(88%)
11(12%)
10)Breakdown of employees in terms of gender, age, and
minority group
0
55
55(62%)
34 (38%)
1)Whether or not firms implement voluntary
environmental management systems (ISO 14001, LCA,
etc)
0
6
68(76%)
21(24%)
2)Whether or not firms make decisions based on the
concept of sustainable business and long-term objective
0
74
74(83%)
15(17%)
3)Whether or not firms enlighten consumers and
suppliers for the concept of sustainable business
0
71
71(80%)
18(20%)
4)Whether or not firms compare GRI
0
60
60(67%)
29(33%)
5)Whether or not firms mention Culture
0
71
71(80%)
18 (20%)
Table 4. List of the Sustainable Business Indicators (SBIs) (1999 ~ 2006) (N=89)
www.intechopen.com
Indicators of Sustainable Business Practices
Table 5. Changes in Sustainable Business Indicators Used in Category I and II
www.intechopen.com
191
192
Environmental Management in Practice
Table 5. Changes in Sustainable Business Indicators Used in Category I and II
www.intechopen.com
Indicators of Sustainable Business Practices
Table 5. Changes in Sustainable Business Indicators Used in Category I and II
www.intechopen.com
193
194
Environmental Management in Practice
Key Words in the Titles in Category I
(1999 ~ 2002)
Key Words in the Titles in Category II
(2003 ~ 2006)
Environmental /
Environmental,
Health, and Safety
Sustainability
Total
Environmental /
Environmental,
Health, and Safety
Sustainability
Total
5 (42%)
7 (58%)
12
11 (17%)
55 (83%)
66
Table 6. Changes in Key Words Used in the Title of Performance Reports in Category
I and II
Daly (1990) and Azapagic and Perdan (2005) said that sustainable development should be
described by qualitative as well as quantitative measurement because it is required to
explain whether or not an organization’s diverse activities consider or meet human needs
and social demands. We also found that firms in category I and II used both qualitative and
quantitative indicators in their sustainable business performance reports.
In category II, most social and integrated indicators except for four social indicators and one
integrated indicator were qualitative indicators. Two quantitative social indicators, the
Recordable Illness Rate (RIR) and the Lost Time Rate (LTR), are used to evaluate firms’
occupational safety and health. The recordable illness rate is the number of full-time
employees suffering a recordable injury or illness during a given calendar year. The LTR is
measured as the number of lost time claims per million hours worked and allows analysis of
the number of lost time claims without the distorting effects of the size of the workforce.
4.1.3.1 Consistency of natural capital
The consistency of natural capital stocks can be measured by identifying the changes in the
constant physical capital stocks, such as renewable energy and resources. This is because
constant physical capital stock is one of the two concepts of the consistency of natural
capital stock (Pearce, Barbier, & Markandya, 1990). Accordingly, the amount of renewable
energy used in firms is a sustainable business indicator. Examples of renewable energy used
in firms’ performance reports are wind, solar energy, hydrogen energy, and biogas. Based
on Table 5, firms in category I reported the performance of this indicator by 25%, but firms
in category II reported it by about 71%. Since 2003, many firms in category II had increased
the use of renewable energy while they reduced the use of non-renewable energy. In the
Corporate Responsibility Report 2005, STXXX electronics (2006) reported that they increased
the use of wind and solar energy from 18.6GWh in 2003 and 30.5GWh in 2004. In the ‘2004
Sustainability Report’ published in 2005, POTXXX Corporate reported that it has started
using renewable energy in 2004.
The consistency of the natural capital stock can also be measured by identifying a constant
economic value, which is another concept of the consistency of natural capital stock (Pearce
et al., 1990). We found firms that disclosed different eco-efficient indicators in their
performance reports, such as energy efficiency, the amount of pollution per dollar, etc.
Based on Table 5, only 25% of the sample firms in category I disclosed eco-efficient
indicators in their performance reports, while about 85% of the sample firms disclosed them
in category II. Many firms in category II reported eco-efficient indicators, such as energy
efficiency, in their performance reports. This is consistent with what WBCSD (2005) and
Desimone and Popoff (1998) stated. They said that firms can integrate sustainable
www.intechopen.com
Indicators of Sustainable Business Practices
195
development into their business by applying constant economic values of the natural capital
stocks, such as eco-efficient indicators.
By providing the performance of various eco-efficient indicators, firms can help interested
parties understand how effectively physical natural capital stocks, such as energy, have
been used to retain an appropriate level of natural capital stock. For instance, AnhXXX
Company (2006) measured and reported a few eco-efficient indicators, such as energy
efficiency in 1,000 gig Joules (gJs) per million dollars Adjusted Net Sales (ANS), and
Hazardous waste generated in kg per million dollars ANS. BaXXX Inc. (2005) defined
energy efficiency as cumulative % improvement in energy use per unit of production value
and reported that energy efficiency increased from 12% in 2002 to 22% in 2004.
Most firms in category I used absolute indicators, such as the total amount of energy
consumed, rather than relative indicators, while firms in category II used absolute indicators
as well as relative indicators, such as eco-efficient indicators based on their own firms’
characteristics. This is because firms in category I did not have diverse and sufficient
guidelines for relative indicators. After a few international guidelines, such as the GRI
guidelines, were published in 2002, firms had opportunities to use or consider relative
indicators, such as various eco-efficient indicators. Those guidelines have introduced and
proposed diverse relative indicators, such as eco-efficient indicators. By comparing firms
that used eco-efficient indicators in category I and II, we found that firms in category II may
have proactively monitored and improved the level of consistency of natural capital stocks
by setting up and evaluating eco-efficiency more so than firms in category I.
4.1.3.2 Culture for sustainable business
We found firms that had described their culture for sustainable business practices. This is
consistent with what the International Institute for Sustainable Development (IISD) et al.
(1992) and what Welford (1995) emphasized. They asserted that a firm should change its
corporate culture to implement sustainable business practices. They also proposed some
examples of corporate culture: employee participation in decision-making processes, the
equitable treatment of women and minority groups, communication with the public, and
the impact on the Third World and indigenous populations. We found these examples as
SBIs. Table 5 shows the trends of these indicators in category I and II.
We searched the terms, “Empower,” “Participation,” and “Decision,” to identify whether or
not firms allow employee participation in the decision making process. Firms in category I
and II reported that they involved their employees in their decision making process by
empowering employees. While 62% of samples firms in category II reported that they
involved their employees in their decision making process by empowering employees, only
about 8% of sample firms in category I described the empowerment of employees. For
instance, SXXXX Inc. in category II addressed, “Within this culture, employees are
empowered and strongly encouraged to use their skills and experience to find better ways
of doing business” (Corporate Social Responsibility Report 2005, p. 4). The CoXXX
Company in category II also stated that its employees are empowered to keep the highest
standards of quality in products, processes and relationships in 2006 Corporate
Responsibility Review. STXXX electronics Company in category I did not mention employee
empowerment in Corporate Environmental Report and Social Review 2001. However,
STXXX electronics Company (2006) in category II stated that employee empowerment is one
of the key principles for its sustainable business in their corporate responsibility report.
www.intechopen.com
196
Environmental Management in Practice
We found one indicator; breakdown of employees in terms of gender, age group, and minority
group membership, as one of the SBIs. This indictor can be used to identify the equitable
treatment of women and minority groups which is one aspect of corporate culture that the
IISD et al. (1992) proposed. Firms in category II reported this indicator by 80% of the firms, and
firms in category I described it 50% of the firms. STXXX electronics Company in category I did
not mention diversity and equitable opportunity of women and minority in Corporate
Environmental report and Social Review 2001. However, in category II, it reported that it not
only ensured diversity and equal opportunity, but also disclosed the changes in percentage of
average employee age and seniority, number of nationalities by regions, and gender
breakdown by regions in Corporate Responsibility Report 2005 and 2006.
4.1.3.3 Harmonization of the triple bottom line
Table 5 presents the trends of the Triple Bottom Line (TBL) used in firms’ performance
reports in category I and category II. Sustainable business indicators that were reported in
over 60% of sample firms in category I are: 9 environmental indicators (82% of total
environmental indicators); 2 economic indicators (40% of total economic indicators); 5social
indicators (45% of total social indicators); and one integrated indicator (20% of total
integrated indicators). Firms in category I focused more on the environmental indicators,
rather than social and economic indicators. On the other hand, many firms in category II
described environmental indicators as well as economic and social indicators in their
performance reports. Based on Table 5, all sustainable business indicators were reported in
over 60% of all sample firms in category II. For example, 17% of firms in category I and 62%
of firms in category II reported abolition of child labor. Only about 8% of firms in category I
mentioned empowerment of employees in their performance reports, but firms in category
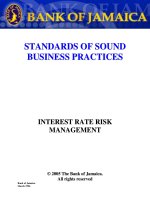
II reported it by approximately 65%. Figure 2 shows the harmonization of the TBL used in
firms in category I and II. It seems that most firms in category I focused more on
environmental indicators and firms in category II tried to harmonize the TBL. Based on
Table 6, about 42% of firms in category I used the term, “Environmental,” “Environmental,
health, and safety” as key words in the titles of their performance reports. While
approximately 58% of sample firms in category I used the term “Sustainability” or
“Corporate social responsibility” as a key word in the title of their performance reports, about
83% of sample firms in category II used the term. These changes indicate that many firms have
shifted the key words in the title of their performance reports from the concept of
environmental performance to the concept of sustainable business practices, which is based on
the concept of the TBL. For instance, STXXX electronics Company used “Environmental
Report” as the title of its performance reports in 2001 and “Social and Environmental Report”
in 2003. In 2004, STXXX electronics Company first used the term, “Corporate Responsibility
Report 2004” as the title of its performance reports on sustainable business practices.
4.1.3.4 Sustainability enlightenment
Young (2000) insisted that sustainable business enlightens its interested parties, such as
investors, customers, and employees, on the concept of sustainable business practices. This
is because interested parties have significant roles in changing traditional consumption,
purchasing, and investing behaviors toward sustainable business practices. We found firms
behaviors that are consistent with Young’s (2000) findings. Based on Table 5, 83% of firms in
category II and 33% of firms in category I reported that they enlightened their interested
parties, such as customers, suppliers, investors, and employees about the concepts of
sustainable business. It seems that firms in category II progressively enlightened their
www.intechopen.com
Indicators of Sustainable Business Practices
197
EN1:Total amount of water used;EN2:Total amount of energy used;EN3:Total amount of greenhouse gases generated
(CO2);EN4:Total amount of Volatile Organic Compound (VOC) generated;EN5:Total amount of air emissions
generated (SOx, NOx);EN6:Total amount of waste recycled or reused;EN7:Total amount of solid waste
generated;EN8:Total amount of hazardous waste generated;EN9:Total number of environmental violations;EN10:
Total amount of renewable energy used (clean fuel, solar energy, clean energy);EN11:whether or not firms describe
environmentally friendly product or process;EC1:Annual profits;EC2:Annual sales;EC3:Fines;EC4:R&D investment
(total);EC5:Donations;SO1:Female, disabled person’s rights;SO2: Abolition of all child labor; SO3:The recruitment of
people from ethnic minorities, older workers, women;SO4:Empowerment of employees;SO5:Average hours of training
per employee;SO6:Number of employees; SO7:Recordable illness rate (RIR);SO8:Lost time rate (LTR);SO9:Whether or
not firms implement a broad range of voluntary activities;SO10:Whether or not firms provide opportunities to
communicate internally and externally to interested parties;SO11:Breakdown of employees in terms of gender, age,
and minority group; I1:Whether or not firms implement voluntary environmental management systems (ISO 14001,
LCA, etc);I2:Whether or not firms make decisions based on the concept of sustainable business and long-term
objective;I3:Whether or not firms enlighten consumers and suppliers for the concept of sustainable
business;I4:Whether or not firms compare GRI;I5:Whether or not firms mention culture;I6:Whether or not firms used
relative indicators (eco-efficiency)
Fig. 2. Trend of Sustainable Business Indicators Reported in Category I and II
www.intechopen.com
198
Environmental Management in Practice
interested parties on sustainable business practices more so than firms in category I did. For
instance, in their 2006 Citizenship Report, GeXXX Electronic Co. reported that it had
required their suppliers to consider the concepts of sustainable business since 2002 by
complying with laws and regulations governing minimum wage, hours of service, and
overtime wages for employees. GeXXX Electronic Co. (2007) introduced “The Spirit & The
Letter” polices so that GeXXX Electronic Co. could help its interested parties, such as
employees, suppliers, and customers, understand the common standards of behaviors
required to implement sustainable business practices of GeXXX Electronic Co. In KimXXX’s
2005 Sustainability Report, KimXXX Corporation reported that they enlightened and shared
tools and technologies with suppliers to meet its social and environmental requirements that
are sustainable business practices.
4.1.3.5 Voluntary programs and communication to the public
We identified whether or not a firm implemented diverse voluntary programs as an
indicator to evaluate a firm’s sustainable business, and found that most of the firms in
category I and II have implemented and reported a variety of voluntary programs. This is
consistent with Thompson (2002) and Scott (2001). They found that sustainable business
should implement diverse voluntary programs to build strong relationships with
stakeholders, increase a firm’s image and reputation, and consider ethical investment for
individual investors and fund managers. In Table 5, about 83% of firms in category I and
97% of firms in category II reported their diverse voluntary programs. In their 2005
Sustainability Report, KimXXX Corporation disclosed that it voluntarily joined the U.S.
Environmental Protection Agency’s Climate Leaders program in December 2005. GeXXX
Company reported that it had implemented various voluntary greenhouse gas management
initiatives to mitigate global climate change in their Corporate Responsibility Report of
2004/5. Many firms in category II implemented their voluntary programs especially for
people employed in developing countries. AlXX X Inc. and KimXXX Corporation disclosed
that they voluntarily implemented HIV/AIDS programs and management systems at places
where they operate their facilities in South Africa. The goal of these programs is to help
employees and their families undergo voluntary counseling and confidential testing for
HIV/AIDS. The increasing number of voluntary HIV/AIDS programs implemented in
developing countries is consistent with changes in corporate culture that the IISD et al.
(1992) and Welford (1995) suggested in order to implement sustainable business.
Many firms in category II have voluntarily applied to the GRI guidelines to report the
performance of their sustainable business practices. AlcXXX Inc. reported that it voluntarily
used the GRI guidelines to help its interested parties to understand its sustain able business
practices in 2004 Sustainability Report.
4.2 Changes in the key words of the performance titles
Data from a total of 287 firms were collected as sample data among all S&P 500 companies,
as of December 2006. The following words were used to codify the results: Environmental;
Report; Environmental, Health, and Safety Report; Sustainability; Corporate Social Responsibility;
Corporate Report; and Citizenship Report. The results of these codes are separated into 3
categories; E (environmental report); EHS (environmental, health, and safety reports);
Sustainability (sustainability, corporate social responsibility, and sustainable report).
Sustainability, corporate social responsibility, corporate report, and sustainable report mean
that the firm considered the concept of sustainable business because these words evolved
from the concept of sustainable development. Table 7 presents the trends in key word usage
www.intechopen.com
199
Indicators of Sustainable Business Practices
NAICS
Mining (21)
E, H, S
Crop Production (111)
0(0%)
0
(0%)
1
(100%)
1
(100%)
0
(0%)
1
Forestry and Logging (113)
1
(100%)
0
(0%)
0
(0%)
1
(100%)
0
(0%)
1
Sub-total
1
(50%)
0
(0%)
1
(50%)
2
(100%)
0
(0%)
2
Oil and Gas Extraction
(211)
0
(0%)
2
(40%)
3
(60%)
5
(62%)
3
(38%)
8
Mining (except Oil and
gas)(212)
1
(33%)
0
(0%)
2
(67%)
3
(75%)
1
(25%)
4
Support Activities for
Mining (213)
0
(0%)
2
(50%)
2
(50%)
4
(57%)
3
(43%)
7
Sub-total
1
(8%)
4
(33%)
7
(58%)
12
(63%)
7
(37%)
19
Utilities (221)
7
(28%)
6
(24%)
12
(48%)
25
(78%)
7
(22%)
32
Construction of Buildings
(236)
0
(0%)
0
(0%)
1
(100%)
1
(20%)
4
(80%)
5
Heavy and Civil
Engineering Construction
(237)
0
(0%)
0
(0%)
0
(0%)
0
(0%)
2
(100%)
2
0
(0%)
0
(0%)
1
(100%)
1
(14%)
6
(86%)
7
Food (311)
1
(14%)
2
(29%)
4
(57%)
7
(50%)
7
(50%)
14
Beverage and Tobacco
Product (312)
3
(60%)
0
(0%)
2
(40%)
5
(50%)
5
(50%)
10
Apparel (315)
0
(0%)
0
(0%)
0
(0%)
0
(0%)
4
(100%)
4
Leather and Allied Product
(316)
0
(0%)
0
(0%)
1
(100%)
1
(50%)
1
(50%)
2
Wood Product
(321)
0
(0%)
0
(0%)
1
(100%)
1
(100%)
0
(0%)
1
Paper (322)
0
(0%)
1
(25)
3
(75%)
4
(57%)
3
(43%)
7
Printing and Related
Support Activities (323)
0
(0%)
0
(0%)
0
(0%)
0
(0%)
1
(100%)
1
Petroleum and
Coal Product (324)
0
(0%)
3
(43%)
4
(57%)
7
(88%)
1
(12%)
8
Chemical (325)
0
(0%)
5
(19%)
22
(81%)
27
(64%)
15
(36%)
42
Plastics and
Rubber Product (326)
0
(0%)
1
(33%)
2
(67%)
3
(75%)
1
(25%)
4
Primary Metal
(331)
1
(50%)
0
(0%)
1
(50%)
2
(40%)
3
(60%)
5
Utilities(22)
Construction
(23)
Sub-total
Manufacturing
(31,32,33)
Total
E
Title(3 digit)
www.intechopen.com
Subtotal
Not
Reporting
Sustain
ability
Title(2 digit)
Agriculture,
Forestry,
Fishing and
Hunting (11)
Reporting
200
Environmental Management in Practice
NAICS
E, H, S
Fabricated Metal
Product (332)
0
(0%)
1
(33%)
2
(67%)
3
(60%)
2
(40%)
5
Machinery (333)
0
(0%)
1
(17%)
5
(83%)
6
(38%)
10
(62%)
16
Computer and
Electronic Product (334)
2
(9%)
3
(14%)
17
(77%)
22
(37%)
37
(63%)
59
Electrical Equipment,
Appliance and Component
(335)
0
(0 %)
0
(0%)
2
(100%)
2
(40%)
3
(60%)
5
Transportation
Equipment (336)
1
(11%)
3
(33%)
5
(56%)
9
(60%)
6
(40%)
15
Furniture and Related
Product (337)
0
(0%)
0
(0%)
1
(100%)
1
(50%)
1
(50%)
2
Miscellaneous
(339)
0
(0%)
0
(0%)
3
(100%)
3
(33%)
6
(67%)
9
8
(8%)
20
(19%)
75
(73%)
103
(49%)
106
(51%)
209
0
(0%)
0
(0%)
0
(0%)
0
(0%)
1
(100%)
1
Rail Transportation (482)
1
(100 %)
0
(0%)
0
(0%)
1
(25%)
3
(75%)
4
Water Transportation
(483)
1
(100%)
0
(0%)
0
(0%)
1
(100%)
0
(0%)
1
Pipeline Transportation
(486)
1
(33%)
2
(67%)
0
(0%)
3
(100%)
0
(0%)
3
Couriers and
Messengers(492)
0
(0%)
0
(0%)
2
(100%)
2
(100%)
0
(0%)
2
3
(43%)
2
(29%)
2
(28%)
7
(64%)
4
(36%)
11
Accommodation (721)
1
(100%)
0
(0%)
0
(0%)
1
(33%)
2
(67%)
3
Food Services and
Drinking Places (722)
0
(0%)
0
(0%)
2
(100%)
2
(50%)
2
(50%)
4
1
(33%)
0
(0%)
2
(67%)
3
(43%)
4
(57%)
7
21
(14%)
32
(21%)
100
(65%)
153
(53%)
134
(47%)
Sub-total
Air transportation
(481)
Transportation
and
Warehousing
(48,49)
Sub-total
Accommodati
on
and Food
Service (72)
Total
E
Title(3 digit)
Sub-total
Total
Subtotal
Not
Reporting
Sustain
ability
Title(2 digit)
Manufacturing
(31,32,33)
Reporting
287
* E: Environment, H: Health, S: Safety
Table 7. Trends of the Key Words Used in the Titles of S&P 500 Firms’ Performance Reports
in 2006
within the titles of performance reports based on the industry of all 287 sample firms. Of the
287 firms, approximately 53% of the firms (153 firms) reported their performance reports.
Performance reports could not be found on the respective Internet homepages for the
remaining firms. Of the 153 firms, 65.4% (100 firms) used “sustainability,” “sustainable,” or
www.intechopen.com
Indicators of Sustainable Business Practices
201
“corporate social” as (a) word(s) used in the titles of their performance reports; 20.9% (32
firms) used “environmental, health, and safety” as (a) word(s) for their performance reports;
and 13.7% (21 firms) used “environmental” as (a) word(s) for their performance titles. This
means that 65.4% of the 153 S&P 500 firms surveyed have reported the performance of
sustainable business indicators; 20.9% have disclosed the performance of environmental,
health, and safety indicators; and 13.7% have reported only environmental performance.
Fifty-three firms, 18.5% of the total 287 S&P 500 firms surveyed reported that their
environmental performance reports used the terms Environmental reports or environmental,
health and safety reports in the title of their performance reports. This result is quite different
from that of a previous study. In 1998, the Investor Responsibility Research Center (IRRC)
conducted a survey to identify how many S&P 500 firms reported their performance reports
to the public. They found that 61% of the 191 S&P 500 companies in 1998 used the term
Environmental as a keyword in the title of their performance reports (Gozali et al., 2002). This
indicates that 61% of the S&P 500 companies surveyed in 1998 focused on the performance
of environmental indicators. The use of the term Environmental in the title of the
performance reports swiftly dropped from 61% in 1998 to18.5% of the total 287 S&P 500
firms (53 firms) in 2006. On the other hand, the IRRC did not find firms that used the term
Sustainability in the titles of their samples. However, we found 34.8% (100 firms) of 287 S&P
500 companies surveyed in 2006 used the term Sustainability as a keyword in the title of their
performance reports. Changing the keywords used in the title of a firm’s performance
reports means that the main strategies of the performance reports have likely changed and
that the firm has informed the readers of what they have implemented and evaluated.
4.2.1 Distribution of industries
As of 2006, of the 287 S&P 500 companies surveyed, 19 firms were in the mining industry.
63.2% of these 19 firms (12 firms) provided their performance reports. Of the 12 firms, seven
firms (58.3% of 12 firms) used the term, Sustainability and five firms (41.7% of 12 firms) used
the term Environmental and EHS. In other words, 58.3% of firms described their performance
in accordance with the concept of sustainable development. It could be said that firms in the
mining industry have begun to progressively apply sustainable business strategies.
Thirty-two firms in the utilities industry provided their performance reports. Among them,
48.0% of the firms used the term Sustainability, and 52% of the firms used the term
Environmental and EHS in the title. Based on these numbers, it appears that many firms had
still focused more on environmental management systems than on sustainable business
even though international organizations had proposed guidelines, such as the Electric
Utilities project proposed by the WBCSD in 2000, to help firms in the utilities industry
implement sustainable business practices.
Seventy-five firms (72.8% of 103 firms) in the manufacturing industry used the term
Sustainability; 8 firms (7.8% of them) used the term Environmental; and 20 firms (19.4% of
them) used the term EHS. It appears that firms in the manufacturing industry have
proactively applied sustainable business practices or labels for such practices. Firms in the
manufacturing industry have changed from environmental management strategies to
sustainable business strategies. This shift was made possible in part because manufacturing
firms could easily apply and implement sustainable business aided by the fact that most had
already established and implemented several environmental management systems, such as
ISO 14001.
www.intechopen.com