Poster session v affinity and efficacy models of g protein coupled receptors
Bạn đang xem bản rút gọn của tài liệu. Xem và tải ngay bản đầy đủ của tài liệu tại đây (866.6 KB, 18 trang )
Poster Session V
Affinity and Efficacy
Models of G-Protein
Coupled Receptors
APPLICATION OF PARM TO CONSTRUCTING AND COMPARING S'HT~AAND
q RECEPTORMODELS
Maria Santagda), Hongming Chen (b5# ), Andrea SantagatiCa),Maria Modica("), Salvatore
Guccione(a) ,Gloria Uccello Barretta@),FedericaBalzano'')
(a) Diprtimento di Scienze Farmaceutiche, Universitd di Catania, viale Andrea Doria 6, Ed
12, I-95125 Catania,Italy
(b)Laboratoryof Computer Chemistry,Institute of Chemical Metallurgy, Chinese Academy of
Sciences, P.O. Box 353 Beijing 100080, P. R China
(')Centre CNR di Studio per le Macromolecole Stereordinate ed Otticamente Attive,
Universita' di Pisa, via Risorgimento 35, I-56126 Pisa, Italy
Based on the Walters' s GERM (GeneticEvolved Receptor Model), PARM (PseudoAtomic
Receptor Model) uses a combination of genetic algorithms and a cross-validationtechnique
to produce atomic-levelpseudo-receptor models starting from a set of known ligands.
These putative pseudo-receptor models can be used to predict bioactivity of virtual
moleculesby aligning these moleculeswith the training set molecules, computing the interaction energy between each molecule and interpolating the computed interaction energy in the
QSAR regression equation to obtain a predicted bioactivity, so reducing the trial-error
procedure in the synthesis of new chemicalentities.
Serotonin modulates many processes in mammalian peripheral and central nervous system
through its interactions with at least 14 receptor subtypes, all but one (5-HT3 subtype) of
which are G protein (heterotrimericGTP-binding protein)-coupled.
The 5-HT3 subtype is a ligand-gated ion channel that shares functional and structural
similaritieswith nicotinic acetylcholinereceptors.
Aim of the present investigationis to create a 5-HTlAmodel capable of aiding the
synthesis of new compounds with improved activities elucidating the possible role of
heteroaromatic interactions'32in the receptor binding, and to compare the predictive ability
of the new paradigm PARM334with two traditional 3D Q S A R techniques such as
Present address: Bayer AG, Pharma-Forschung,PH-R Structurforschung,D-42096,
Wuppertal, Germany.
@
433
CoMFA’(Comparative Molecular Field Analysis) and HASL6 (Hypothetical Active Site
Lattice), as reported in chapter: APPLICATION OF PARM TO CONSTRUCTING AND
COMPARING ~ - H T AND
~ A (xl RECEPTOR MODELS. In addition, worth of interest was
mapping possible features underlying the ~ - H T or
~ Aurpha selectivity, as shown by some
ligands in the investigated thienopyrimidinoneseries7.
In the PARM3 computation, 15 kinds of pseudo-receptor atoms are defined first.
Then, the moleculesin the training set are superimposed on a specific pharmacophore model
and a set of grid points is generatedaround the common surface of the superimposed ligands.
Receptor models are made by placing atoms at these points in 3D space, to simulate a
receptor active site. These atoms interact with the ligands and the interaction energy
between each ligandand the receptor model is computed. By using a genetic algorithm and a
cross-validationtechnique, a number of atomic-level pseudo-receptor models which have a
high correlation between intermolecular energy and bioactivity can be built. A QSAR
equation is constructed for each model in the linear form of Bioactivity = A + B*Ehe,.
Energeticcomputation in PARM3makes use of the TRIPOS 5.0 force field.
PARM3 generates the receptor models in the MOL2 file, so that we can check the
characteristicsof the receptor model within the SYBYL software’.
In this study, (forthcomingpaper) the initial population of pseudo-receptors was
set to 1500, the maximum generation to 2000, the number of grid points was set to 49 and
the cushion distance (the distance between grid point and the closest ligandatom) was 0.5 fL
PARM3 is allowed to run until a series of receptor site models with high conventional
correlation coefficients and cross-validatedR2are obtained. Usually, the top 20 models are
used to predict bioactivity and compared with a test set.
Models fifteen and four (Table I and I0 were found to have the best predictions for the 5H T ~ and
A q-ARdata sets, respectively.
These two models are analysed in Figs 1 and 2. See also Fig 6 and 7 of chapter ~ - H T ~ A
RECEPTORS MAPPING BY CONFORMATIONAL ANALYSIS (2D NOESYMM)
AND “THREE WAY MODELLING (HASL, CoMFA, PARM) .
5069
SDBB
6tW
mw
BBB(1
980%
lW
Fig 1 Analysis of the best predictive 5-HTIAmodel (model fifteen)
434
Table I P A W computation results of tk HT,,- receptor model
carbon
Compd Rl
R2
R3
sulphur
Exp -log IC50 Calc -log IC50
Residual
&te,(kcaVmol)
H
6.005
6.304
0.299
9.267
3 (46) Me
Me H
2-OMe-Ph
7.620
7.891
0.271
-3.306
4 (48) Me
Me H
1-naphtyl
6.450
6.312
-0.138
9.199
5 (49) Me
Me H
2-pyrirnidinyl
6.646
6.424
-0.222
8.314
H
2-OMe-Ph
7.229
7.681
0.452
-1.640
7 (53)
Me
-(CHI).+-
11 (61) H
Ph
H
2-OMe-Ph
6.413
6.898
0.485
4.564
12 (63) H
Ph
H
1-naphtyl
5.697
5.609
-0.088
14.773
2-OMe-Ph
7.337
7.539
0.202
-0.519
2-OMe-Ph
8.921
8.325
-0.596
-6.740
13 (64) -(CH=CH)Z H
P
oxygen
Me 3-C1Ph
2 (44)
VI
W
R4
*
hydrogen nitrogen
14 (65) H
H
17 (68) Me
Me NH2
Ph
8.481
8.616
0.135
-9.047
19 (69) Me
Me Me
2-OMe-Ph
9.523
9.119
-0.404
- 13.03 1
NH2
fa
Table I continued
Compd Rl
R2R3
R4
Exg -log IC50
20 (70) Me
Me NH2
2-OMe-Ph
8.523
21 (71) Me
Me NHPh
2-OMe-Ph
22 (72) Me
Me Me
23 (73) Me
Me NH2
Calc -log IC50
Residual
l$,,,,,,(kcaUmol)
8.618
0.095
-9.068
6.304
6.044
-0.260
11.323
2-pyrimidiny l
8.167
7.697
-0.470
-1.770
2-pyrimidinyl
9.301
9.540
0.239
-16.371
-l0gIC50=7.474-0.126*E~,~~
$=1).962, R2cv=0.906 SDzD.353
1 (43)* Me
Me H
2-OMe-Ph
6.337
7.620
1.283
-1.156
2-CI-Ph
6.074
7.823
1.749
-2.770
6 (50)*
-(CH,)4-
9 (56)*
-(CH*)d- H
1-naphtyl
6.431
6.939
0.508
4.236
10(57)*
-(CH2)4- H
2-pyrimidinyl6.297
6.888
0.591
4.641
15 (66)*
-(CH1)4- Me
2-OMe-Ph
8.155
8.596
0,441
-8.889
16 (67)*
-(CH2)9- NH2
2-OMe-Ph
8.886
8.760
-0.126
-10.193
H
24(74)*' Me
Me NH2
2-OMe-Ph
7.187
7.743
0.556
-2.137
25(78)*b-
-
2-OMe-Ph
9.097
9.468
0.371
-15.801
NHZ
S D*s0.86
*In brackets the number in the paper (see ref 10).
'Test set compounds
*The piperazine ring has beenreplaced by a piperidine nudeus.
The thiophene ring has been replaced by a benzenenudeus
Table I1 PARM computation results of the q - A R model
*
R1
0
carbon hydrogen n i t q e n
Compd
Rl
R4
Exp -log IC50 Calc -log ICSO
Residual
ILter(kcaUmol)
Me 3-C1Ph
H
6.524
6.652
0.128
16.030
3 (46) Me
Me H
2-OMe-Ph
7.389
7.594
0.205
7.128
4 (48) Me
Me H
1-naphtyl
6.053
6.136
0.083
20.900
(49) Me
Me H
2-pyrimidinyl
5.959
5.982
0.023
22.349
-(CH2)4- H
2-OMe-Ph
7.420
7.566
0.146
7.3930
11 (61) H
Ph
H
2-OMe-Ph
6.650
6.697
0.047
15.601
12 (63) H
Ph
H
1-naphtyl
5.610
5.602
-0.008
25.945
13 (64) -(CH=CH)z H
2-OMe-Ph
7.041
7.258
0.217
10.306
14 (65) H
H
2-OMe-Ph
8.538
8.538
0.000
- 1.785
17 (68) Me
Me NH2
Ph
7.367
6.796
-0.571
14.669
19 (69) Me
Me Me
2-OMe-Ph
7.569
7.565
-0.004
7.407
7 (53)
4
R3
sulphur
2 (44) Me
5
e
R2
oxygen
NH2
Compd Rl
R2 R3
R4
20 (70) Me
Me NH2
2-OMe-Ph
8.137
7.962
-0.175
3.652
21 (71) Me
Me NHPh
2-OMe-Ph
7.495
7.403
-0.092
8.932
22 (72) Me
Me Me
2-pyrimidinyl
5.693
5.745
0.0522
4.588
23 (73) Me
Me NH2
2-pyrimidinyl
6.296
6.245
-0.051
19.865
Exp -log IC50 Calc -log IC50 Residual ILte,(kcaVmol)
-l0gIC50=8.349.0.106*E,~,,r=0.975, R,,,2=0.941
SD=0.197
Table 11 continued (Test set molecules)
1 (43)" Me
Me H
2-OMe-Ph
6.793
6.886
0.093
13.811
6 (50). -(CH2)4-
H
2-CI-Ph
6.775
6.581
-0.194
16.696
9 (56)* -(CH2)4-
H
1-naphtyl
6.352
6.593
0.241
16.578
10(57)* -(CH2)4-
H
2-pyrimidiny l
5.741
6.830
1.089
14.341
15(66)* -(CH2)4-
Me
2-OMe-Ph
7.194
7.919
0.725
4.063
16 (67)* -(CH2)4-
NH2
2-OMe-Ph
7.409
7.924
0.515
4.014
Me NH2
2-OMe-Ph
7.444
8.217
0.773
1.251
-
2-OMe-Ph
8.398
7.893
-0.505
4.307
24(74)*' Me
25 (78)*b
-
NH2
SD*=0.61
*In brackets thenumber in the paper (see ref 10).
'Test set oompounds
The piperazine ring has beenreplaced by a piperidine nucleus.
bThe thiophene ring has beenreplaced by a benzenenucleus.
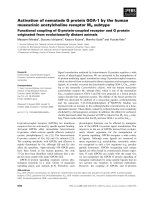
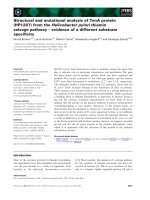
A TESTSET
fl PREDICTING SET
I
5ooo5000
6000
7000
8000
9000
10000
Fig 2 Analysis of the best predictive c+AR model (model four)
Acknowledgements.Financial support (40%) from Italian MURST and the kind technical
support from TECHNOSOFT (via Galliano, 25, 1-95125 Catania, Italy) are gratefully
acknowledged.
S. Guccionethanks Prof. Eric Walters for the helpful discussion and directions.
Hongming Chen thanks Prof. J. J. Zhou for the helpful support and the high scientific
contribution to the ongoingPARM investigations.
References (’)
1. T. M. Fong, H. Yu, R. R. C. Huang, M. A. Cascieri,and C. J. Swain, Relative contribution of polar interactions and conformational compatibility to the binding of neurokinin-1
receptor antagonists,Mol. Phi-macol., 50: 1605 ( 1996) and enclosed references.
2. M. Modica, Synthesis of thieno[2,3-d]pyrimidine derivatives. Ligands to the ~ - H T ~ A
serotoninergic receptor, Tesi di Dottorato di Ricerca (Ztalian PhD.), University of
Catania (1994).
3. H. M. Chen, J. J. Zhou, G. R. Xie, PARM: A genetic evolved algorithm to predict
bioactivity, J Chem. Zn$ Comput. Sci., 38: 243 (1998).
4. D. E. Walters and T. D. Muhammad, Genetically evolved receptor models (GERM): a
procedure for construction of atomic-level receptor site models in the absence of a
receptor crystal structure, in: Genetic Algorithms in Molecular Modelling, J. Devillers,
ed., AcademicPress, London (1996).
(’) Refs. 5.- 8. -see chapter: 5-HTIARECEPTORS MAPPING BY CONFORMATIONAL
ANALYSIS (2D NOESYMM) AND “THREE WAY MODELING (HASL, CoMFA,
PARM), by S. Guccione et al. See refs 13., 7.,10., 11.
439
A NOVEL COMPUTATIONAL METHOD FOR PREDICTING
THE TRANSMEMBRANAL STRUCTURE OF G-PROTEIN
COUPLED ANAPHYLATOXIN RECEPTORS, CSAR and C3AR
Naomi Sew, Anwar Rayan,Wilfried Bautschl and Amiram Goldblum
Department of Medicinal Chemistry, School of Pharmacy, Hebrew University of Jerusalem,
Jerusalem, ISRAEL 91120, and 1Institut fur Medizinische Mikrobiologie, Medizinische
Hochshule, Carl-Neuberg-Str.1, D-30625 Hannover, Germany
Introduction: The receptor C5aR (350 residues) is found in the membranes of
polymorphonuclear leukocytes. When activated by its ligand, C5a, a very potent
chemoatractant, an amplification of the inflammatory process occurs. C3aR (482 residues) is
similarly associated with such events, although to a lesser extent. High levels of C5a (74 aa)
and C3a (77 aa) were connected to inflammatory and autoimmunal diseases, such as
Rheumatoid Arthritis and Adult Respiratory Disease Syndrome, that can even lead to death.
The design and construction of potent antagonists to each of the two receptors is a major
avenue that could lead to control of such conditions. C5aR and C3aR belongs to the
superfamily of G Protein-Coupled Receptors (GPCR), which includes over 700 members,
involved in many important biological activities. The structure of these proteins has not been
determined yet and attempts to rationally design drugs for them are still limited.
One of the very few membranal proteins whose structure was solved is
bacteriorhodopsin, a membranal proton pump. It consists of seven transmembranal helices,
connected by extra- and intra-cellular hydrophilic loops, an extra-cellular N-terminal and an
intra-cellular C-terminal. Bacteriorhodopsin is not a GPCR and has no significant homology
with this family, yet there is experimental evidence that demonstrates a similar topology. The
structure of bacteriorhodopsin has been initially determined by electron microscopy at low
resolutions parallel and perpendicular to the membrane (1BAD). More recently, X-ray
structure of bacteriorhodopsin was determined at 3.5A resolution (2BRD). Due to the fact
that the three dimensional structure of the GPCRs was not solved yet, constructing theoretical
models for these receptors, in order to investigate their interactions with their ligands and
their activation mechanism, has become very common.
Method: We view the process of receptor assembly as a result of two different
mechanisms: An equilibrium of helices between water and the membrane, governed by their
hydrophobicity, followed by an association of helices which may be close to interactions in
globular proteins. We employed a knowledge-based force field constructed from the Protein
Data Bank (globular proteins), where all the interactions between pairs of amino acid residues
have been evaluated according to their occurrence and the appropriate statistical weights
(Miyazawa and Jerniganl ). Seven regions along the sequence, which are assumed to contain
the seven transmembranal helices, were found by means of hydrophobicity profiles and
multiple sequence alignment with other GPCRs, with the program HOMOLOGY. These
regions are input to our program THREAD. Each region is longer than the sequence that is
expected to reside in the membrane in a helical structure. The program suggests the limits for
each helix. It threads the seven sequences simultaneously on the coordinates of
bacteriorhodopsin, combining all the possible options for each helix.
THREAD employs the template structure of 1bad.pdb or 2brd.pdb (or any other template)
and "threads" a GPCR in order to find the best GPCR structure by using two methods:
440
1) Calculating the overall contact energy of the structure. Two residues, whose Ca-Ca
distance is less or equal to 7A (for Gly - 6A) and whose CP-CP distance is less than their
Ca-Ca distance, are considered to be in contact. The contact energy value for every pair is
summed up for the whole protein.The lowest energy structures are retained for further
processing. The detailed structure of side chains of residues are not taken into account at this
stage.
2) Summing up the hydrophobicity values in the membrane and outside. For every
structure threaded, the hydrophobicity values of each residue in the membrane (i.e. in a helix)
are summed. The program searches for the most hydrophobic structure.
Side chains were added by two methods that employ a rotamer library. HOMOLOGY
uses a backbone independent library of rotamers, and the side chains are added depending on
the sequence of addition. SCWRL2 adds side chains from a backbone-dependent library, and
optimizes the results by identifying clashes and combining all clashing side-chains into a
group, for which all combinatorics for the rotamers are tested.
Results: THREAD was first tested on the theoretical set of coordinates for
bacteriorhodopsin, lbad. 9.3*105 structures were threaded. The best result was obtained
(table l),but for some helices other results had very close weights. The hydrophobicity
method is least accurate in the case of helix B (A=two turns), which is more hydrophilic than
other helices. Contact energy gave accurate results for most helices, with helix F being about
one turn distant from experimental.
Table 1. The beginnings of the helices of bacteriorhodowin
For CSaR, 1.7*107structures were checked. The two methods gave fairly close results
(table 2). For helix C we got two possibilities for the beginning in the hydrophobicity
method: residue 104 or residue 111. Helix G could begin at residue 281 or residue 284. In
the contact energy method, helix C fluctuatesbetween 107 and 109, helix F between 245 and
241, and helix G between 281 and 284. The two best solutions for each method are depicted
in table 2. However, quite a few other results with close energies exist. The results for C3aR
based on lbad coordinates gives as helix starts: A, 24; B, 57; C, 98; D, 141; E, 342; F, 379;
G, 410 (contact energy only).
REFERENCES
1. Miyazawa, S. and Jernigan, R. (1985).Macromolocules 18: 534-552.
2 .R. L. Dunbrack, Jr. and M. Karplus (1993) J. Mol. Biol. 230: 543-571
441
RECEPTOR-BASED MOLECULAR DIVERSITY:
ANALYSIS OF HIV PROTEASE INHIBITORS
Tim D.J. Perkins, Nasfim Haque, and Philip M. Dean
Drug Design Group
Department of Pharmacology
University of Cambridge
Tennis Court Road
Cambridge UK CB2 1QJ
INTRODUCTION
Focused combinatorial libraries are a useful way of approaching structure-based drug
design, but they may show unexpected bias in exploring the receptor site. One way to monitor
this coverage is by assessing which hydrogen-bonding groups at the receptor site are used by
each ligand in the library. In this communication, we present an analysis of the hydrogen
bonds formed between inhibitor and enzyme in a set of HIV protease complexes. These data
are a model for a larger combinatorial library, and have allowed us to develop methods for
receptor-based diversity analysis.
ANALYSIS OF HIV PROTEASE INHIBITORS
The Brookhaven Protein Databank’ was searched for X-ray coordinates of HIV proteaseinhibitor complexes with resolution better than 2.5 A, and 3 1 non-mutant entries were selected.
The ligands were extracted, and hydrogen atoms were added semi-automatically, The activesite water molecule (sometimes labelled residue HOH 301) was considered as part of the
protein site and relabelled consistently. Hydrogen bonds were identified between each inhibitor and its enzyme using X-ray crystal criteria.’ These data were then indexed by the 29
site atoms used by at least one ligand. In the cases where two orientations of the inhibitor
are present in the complex, a hydrogen bond from either orientation was sufficient for the site
atom to be marked as occupied.
Each pair of ligands was then compared, in terms of the site atoms occupied, using
two separate metrics: Tanimoto similarity coefficient and Euclidean distance. A similarity or
distance matrix was constructed, and input to cluster analysis using Ward’s minimum variance
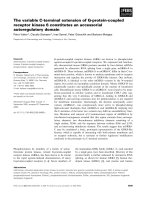
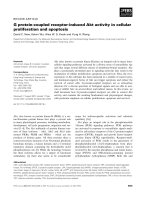
method (see Figure 1). The number of significantly different clusters was determined with
Mojena’s stopping rule? at a significance level of P < 0.05.
442
-1
P
<0.05
0.6
Figure 1. Dendrogram showing clustering of the hydrogen bonds formed by 3 1 ligands in their complexes using
Euclidean distances. The thick line indicates the partitioning suggested by Mojena’s stopping rule.
SELECTION OF REPRESENTATIVE LIGANDS
An alternative to using Mojena’s stopping rule to select the number of clusters is to compare
the diversity (mean inter-object distance) of a subset of objects with the entire set. The
smallest number of clusters where the diversity of the representative ligands (those closest to
the cluster centroid) is at least as large as that for all inhibitors should provide the smallest
feasible set of representatives. For the example shown in Figure 1, the diversity was 0.26 and
4 complexes (1hiv, 1hpx, 1hbv, and 1hvr) provide sufficient coverage.
CONCLUSIONS
Receptor-based diversity using site-point occupancy is a simple approach that provides a
useful way to monitor differences between ligands when the binding mode is known. The
methods outlined also allow the selection of a minimum subset of representative ligands
without a reduction in overall diversity.
ACKNOWLEDGEMENTS
TDJP is a RhBne-Poulenc Rorer Research Fellow; PMD is a Wellcome Principal Research
Fellow.
REFERENCES
1. F.C. Bernstein, T.EKoetzle, G.J.B. Williams, E.F. Meyer, M.D. Brice, J.R. Rodgers, 0. Kennard, T.Shimanouchi and M. Tasmui, The protein data bank: a computer-based archival file for macromolecular
structures, J. Mol. Biol. 112:535 (1977).
2. J.E.J. Mills and P.M. Dean, Three-dimensional hydrogen-bond geometry and probability information from a
crystal survey, J. Cornput.-Aided Mol. Design 10:607 (1996).
3. R. Mojena, Hierarchical grouping methods and stopping rules: an evaluation, Comp. J. 20:359 (1977).
443
APPLICATION OF SELF-ORGANIZING NEURAL NETWORKS WITH
ACTIVE NEURONS FOR QSAR STUDIES
Vasyl V. Kovalishyn,' Igor V. Tetko,'.' Alexander I. Luik,'
, ~ David J. Livingstone4
Alexey G. I ~ a k h n e n k oand
'Institute of Bioorganic & Petroleum Chemistry
Murmanskaya 1, Kyiv, 253660 Ukraine
'Institut de Physiologie, Rue du Bugnon 7
Lausanne, CH- 1005 Switzerland
3Glushkov Institute of Cybernetics
Acad. Glushkov Avenue, 20, Kyiv 252207, Ukraine
4ChemQuest, 19-21 Cheyney Street, Herts, SG8 OLP and Centre for
Molecular design, University of Portsmouth, Hants, PO1 2EG U.K.
INTRODUCTION
The interest for development of rational methods for investigation of relations
between structure and activity of chemical compounds has essentially increased in the last
years. Artificial neural networks have became one of the leading methods in this field.'
However, there are some difficulties (such as limitation in speed, local minima,
overfitting/overtraining problems,' etc.) with an application of these methods for analysis of
data sets with a large number of input parameters and, particularly, three-dimensional
electronic parameters of compounds generated by 3D Q S A R approaches, such as CoMFA.
The current study analyses a new method, i.e. neural networks with active neuron^,'.^ that
could be used in such QSAR studies. We also propose to combine this method with
Kohonen's Self-organizing Maps (SOM) used for preprocessing of 3D Q S A R data sets.
The performance of new method is compared with that of fixed size neural networks.
METHODS
The neural network with active neurons consists of certain number of layers, each of
which is composed of several computing modules. These modules are refer to as the active
neurons.* The neurons at the same layer can differ one from another both in a set of input
and output variables. The process of learning (self-organizing) of an active neuron consists
in estimation of importance of inputs used to minimize the given objective function of the
neuron. The choice of the optimal set of variables is realized by reduced sorting of possible
sets of variables and the variables increasing the objective functions are eliminated. The
choice of links by active neurons defines the structure of the whole network. It is important
to note that the set of output variables in addition to the analyzed activity also includes input
variables. Thus the number of active neurons in each layer is equal to number of variables
given in initial data sampling.
Each layer of active neurons acts similarly to the Kalman filter, i.e. the output set of
variables repeats the input set but with filtration of noise. The output variables of previous
444
layers are used as secondary inputs for the neurons of next layer. The computing modules
are united in a multi layered structure with the purpose to increase the algorithm accuracy by
a more complete processing of the input information.
The self-organization of active neurons was done using the analogues complexing (AC)
a l g ~ r i t h mthat
, ~ is one of the approaches developed within framework of the Group Method
of Data Handling (GMDH) method^.^ This algorithm detects an analog of each analyzed
molecule (i.e., the molecule that is the nearest neighbor of the analyzed molecule in the
Euclidean space) and considers the activity of analog as the predicted value of the molecule.
The total number of layers in neural network was restricted to 10. The analysis of
CoMFA dataset included a preprocessing of input variables using SOM. We used the
regularity criterion of minimum variance of the prediction error4 to calculate the optimal
partitioning of the input parameter space.
RESULTS
The antifilarial activity of 53 antimycin analogues' and charge-transfer properties of 35
monosubstituted benzenes' were analyzed. The both sets have a large number of input
parameters. An optimization of inputs, e.g. by pruning algorithms, improved prediction
ability of the fixed size neural networks applied to these data.'35 The CoMFA dataset
included 82 benzylpiperidine derivatives with AchE inhibitory activity.6
Table 1. The leave-one-out results calculated for analyzed QSAR examples
total
neuronet with active neurons
fixed-size n e u r a l n e t w o r k
p a r a m s no1
first layer
best layer all p a r a m s p r u n e d p a r a m s
53
6
0.74' (0.51)3 0.91 (0.81) 0.66 (0.43)
0.91 (0.67)
31
2
0.74 (0.51)
0.95 (0.89) 0.89(0.78)
0.97 (0.95)
188
4
0.86(0.71)
0.89(0.78) 0.56(0.55)
0.72(0.73)
(28224)4
'cardinal number of the layer (the best layer) with the lowest error of the network; 'correlation coefficient R;
'cross-validated q2; 4number of CoMFA parameters before preprocessing with SOM.
data set
Antimycin analogues
Benzenes
Benzylpiperidines
...
The calculated results for antimycins and benzylpiperidines by neural networks with
active neurons were better than results of back-propagation neural networks, while the
opposite was true for benzenes. The further studies are required to provide a more objective
comparison of the methods.
Acknowledgments
This study was partially supported by INTAS-Ukraine grant 95-0060. The authors
thank Prof. Jacques R. Chretien (University of Orleans) for providing us the CoMFA data.
REFERENCES
1. D.J. Livingstone, D. T. Manallack, and I. V. Tetko, Data Modelling with Neural Networks - Advantages
and limitations, J. Comp. Aid. Mol. Design. 11:135-142.(1997).
2. A.G. Ivakhnenko, G.A. Ivakhnenko, and J.-A. Muller, Self-organization of neural networks with active
neurons, Pattern Recognition and Image Analysis 2:185-196(1994).
3. A.G. Ivakhnenko, V.V. Kovalishyn, I.V. Tetko, A.I. Luik, G.A. Ivakhnenko, and N.A. Ivakhnenko,
Application of self-organizing neural networks with active neurons for prediction of bioactivity of
chemical compounds by the analogues search algorithm, Problems of control and information in press.
4. H.R. Madala, A.G. Ivakhnenko. Inductive Learning Algorithm for Complex Systems Modeling, CRC
Press Inc., Boca Raton (1994).
5. V.V. Kovalishyn, I.V. Tetko, A.I. Luik, V.V. Kholodovych, A.E.P. Villa, and D.J. Livingstone, Neural
network studies. 3. Variable selection in the cascade-correlation learning architecture, J . Chem. In$
Comput. Sci. 38:651-659 (1998).
6. P. Bernard, D.B. Kireev, J.R. Cretien, P-L. Fortier, and L. Coppet, Automated docking of 82 Nbenzylpiperidine derivatives to mouse acetylcholinesterase and comparative molecular field analysis
with "natural" aligment, J . Comp. Aid. Mol. Design. in press (1998).
445
APPLICATION OF ARTIFICIAL NEURAL NETWORKS IN QSAR OF A NEW
MODEL OF PECENYLPIPERAZINE DERIVATIVES' WITH AFFINITY FOR 5HTlA AND 011 RECEPTORS: A COMPARISION OF AN" MODELS
Maria L. Lopez-Rodriguez,"M. Luisa Rosado,'
Fernandez," and Klaus-Jurgen Schaper '
M. Jose Morcillo,' Esther
"Departamento de Quimica Organica I, Facultad de Quimicas, Universidad
Complutense 28040 Madrid, Spain; bSaint Louis University, Avenida del
Valle 34, Madrid Campus; 'Research Center, D-23845 Borstel, Germany
During the last years artificial neural networks (ANN) have been applied successfully
in the QSAR field. It has been demonstrated that this new technique is often superior to the
traditional Hansch approach, providing more accurate predictions. The advantage of ANN
is that with the presence of hidden layers, neural networks are able to perform nonlinear
mapping of the physicochemical parameters and of the corresponding biological activity.
Here, a test series of 32 phenylpiperazines 1 with affinity for S-H.T~Aand a1 receptors
was subjected to QSAR analysis using artificial neural networks ( A N N s ) . Our aim is to get
selectivity in
insight into the structural requirements that are responsible for ~-HT~AIOII
order to design new ligands with high selectivity for the ~ - H T I receptor.
A
0
LvN*N%N#
0
I
-
X = -(CH&, -(CH&-; m= 0 , l ; n= 3,4
R = o-C&, o-OCH3, o-OBu, o-COOPr,
o-OCONHPr, o-CN,m-CF3,m-NH2,
m-NHCOP$, m-Br (selected by
EDISFAR program)
The data set used was the in vitro ~ - H T and
~ A a1 receptor affinities (expressed as pKi
values). Each compound was parametrized with six physicochemical descriptors (F, R, V,,
Vm, no,nm) and three indicator variables (IA = 1 or 0 for X = -(CH&- or -(cH2)3-, IB= 1 or
Oform=l or0,1n=10rOforn=40rn=3).
The neural network employed for this modeling was a filly connected three layer
network (input, hidden, output) trained by back-propagation of error. Initially the number
ofneurons in the input layer was equal to the number of molecular descriptors and indicator
446
variables, whereas the output layer had only one neuron. The number of neurons in the
hidden layer was determined by trial and error. The best ANN models are shown in Table I.
Table I. ANN Models
Receptor
Non significant Parameters
Architecture
r
1.2
S
R,.xm
R
7-2-1
8-2-1
0.983
0.991
0.966
0.982
0.149
0.136
The dependence of biological activity on the physicochemical parameters was
illustrated in 3-D diagrams. On the basis of the obtained plots, the 5-HT1* affinity has a non
linear dependence with F, V,, Vm and no,nevertheless the nonlinear relationship is not far
from the planar one. The a1 affinity has a clear nonlinear dependence with F, V,, Vm, no
and Xm.
A comparison of both analyses gives an additional understanding for 5-HTl~/al
selectivity: (a) High F values increase the binding affinity for 5-HTla receptors and
decrease the affinity for a1 sites; (b) The lipophilicity at the meta position has only
influence for the a1 receptor; (c) The meta position seems to be implicated in the ~ - H T ~ A
/a1 selectivity.' While the ~ - H T I receptor
A
is able to accomodate bulky substituents (about
60 A3) in the region of its active site, the steric requirements of the a1 receptor at this
/~I
position are more restricted (between 0-22 A3). A way to improve ~ - H T ~ Aselectivity
would be the synthesis of long chain derivatives bearing bulky substituents with high F
values and low x values at the meta position. Among the different groups that hlfill these
requirements the m-NHS02Et was chosen (F = 0.419, xm = -0.64, Vm = 65.31). On this
basis, the new ligand EF-7412(X=-(CH&-, m=O, n=4, R=m-NHSOZEt) was designed and
synthesized. This analog bound at ~ - H T I A
sites [Kiobsd (nM)=27.3&5.9;Ki calcd (nM)=36.7]
and showed high selectivity over the a1 receptor (Kiobsd (nM)>lOOo; Ki calcd (nM)=2745).
These results clearly reveal the predictive power of the ANN model and the importance of
the nonlinear relationships mapped by the neural networks.
This work was supported by DGICYT PB940289 and CICYT 960360.
1: (a) Lopez-Rodriguez et nl., 2-[4-(o-Methoxyphenyl)piperazin-l-ylmethyl]1,3-dioxoperhydroimidazo[1,5alpyridine as a new selective 5 - m I A receptor ligand, Bioorg. Med. Chern. Lett. 6:689 (1996). (b) L6pezRodriguez et nl., Synthesis and structure-activityrelationships of a new model of arylpiperazines. 1. 2-[[4-(0Methoxypheny1)piperazin- 1-yl]methylJ - 1,3 -dioxoperhydroimidazo[ 1 3-a]pyridine: a selective 5-HTI
A
receptor agonist, J. Med. Chern. 39:4439(1996). (c) Lopez-Rodriguez et al., Synthesis and structure-activity
relationships of a new model of arylpiperazines. 3. 2-[w-(4-A1ylpiperazin-1-yl)alkyl]perhydropyrrolo[1,2climidazoles and -perhydroimidazo[l,5-a]pyridines:study of the influence of the tenninal amide fragment on
S-HTIA affinity/selectivity, J. Med. Chern. 40:2653 (1997). (d) Lbpez-Rodriguez et al., 1-[w-(4Arylpiperazin-l-yl)alkyl]-3-diphenylmethylene-2,5-p~olidinediones
as 5-ml~
receptor ligands: study of the
steric requirements of the terminal amide fragment on 5 - w l A affinityhelectivity, Bioorg. Med Chem. Left
8581 (1998).
2.Lopez-Rodriguezef al., Synthesis and structure-activity relationships of a new model of arylpiperazines. 2.
Three-dimensionalquantitativestructure-activityrelationships of hydantoin-phenylpiperazine derivatives with
affinity for 5-ml
and
~alreceptors. A comparison of CoMFA models, J. Med. Chern. 40:1648 (1997).
447
Atypical Antipsychotics: Modelling and QSAR
Benjamin G Tehanl, Margaret G Wongl, Graeme J Cross2, Edward J Lloyd3
Themistry Department
Swinbume University of Technology,Australia 3 122
2Water Centre, Monash University, Australia 3 145
3Medicinal Chemistry Department
Victorian College of Pharmacy, Monash University, Australia 3052
Introduction.
Schizophrenia is a debilitating disease that effects approximately 1% of the population
with the onset of the disease occurring usually in the mid 20's and persisting in many cases
for the lifetime of the patient. Researchers have hypothesised that schizophrenia is due to
excessive limbic dopaminergic function within the brain (Jaber et al 1996).
Antipsychotic drugs may be defined as medications that alleviate delusions,
hallucinations and some aspects of formal thought disorder that occur in a variety of
illnesses, most notably schizophrenia. The mechanism of action of these drugs h a s focused on
their interaction with the central nervous system (CNS) neurotransmitter dopamine (DA).
However recent work strongly implicates the neurotransmitter serotonin (5HT)as a further
target of action (Schmidt et a1 1995). Antipsychotic drugs are further loosely classified into
typical or atypical, initially based on animal model tests. Nowadays it is on their reduced
liability to produce extrapyramidal side effects (EPS) (Waddington and O'Callaghan 1997),and
this has lead to hypotheses in terms of limbic selectivity and 5HTz/D2 ratios.
Method
A set of ligands ((R)- and (S)-octoclothepin, clozapine, Org5222, seroquel, olanzapine,
sertindole, risperidone, ziprasidone, zotepine, remoxipride, loxapine) with high affinity for Dz
and ~ H T zand
A classified as atypical and typical antipsychotics were selected for
pharmacophore mapping. Further studies were carried out on sertindole, risperidone,
zotepine, ziprasidone and haloperidol once a pharmacophore model had been established. The
binding affinity data were gathered from Schotte et al. (1996)
A conformational analysis using a systematic search method was performed for each
compound in the set in order to identify low energy conformations for each active molecule.
Sybyl 6.4 from Tripos with Tripos force field and charges assigned to each atom according to
the method of Gasteiger and Marsili, was used in all calculations of initial conformations.
Results
Low energy conformations of the ligands were determined. Molecular superimposition
techniques were used to identify which low-energy conformation from each set of molecular
conformations was to be used in construction of the pharmacophore. The main criteria for
448
each conformation were that the selected pharmacophore elements superimpose within the
set.
The resulting conformations were then run through the program GRID using a variety of
probes to predict the points with the best interactions (Goodford 1984).This produces an
array of energy values that can be used to generate three-dimensional contour surfaces at
selected energy levels which gives additional information as to other possible areas of
interaction.
Discussion
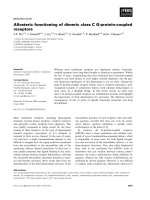
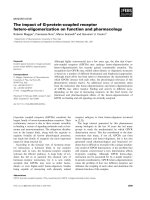
All initial modelling was undertaken using the lone pair off the distal nitrogen and a
region of hydrophobic interaction, such as a phenyl ring, as essential criteria (Petcher). The
electron rich substituent off the phenyl ring is an optional substituent that increases activity
as a Dz antagonist. In the case of clozapine versus iso-clozapine where the electron rich
substituent is moved from the non-interacting position 2 on clozapine to the interactive
position 8 in iso-clozapine, the Dz antagonist binding affinity changes from 330nM to 13nM
respectively (Liao et al.). The position of the nitrogen lone pair from the atypical antipsychotic
Org5222 also fits with the proposed pharmacophore. The GRID probe contours helped
establish other areas of possible interaction. The mirror image of this proposed
pharmacophore is also a viable pharmacophore.
Future Directions
The quantitative aspect of electrostatic potential of the hydrophobic region in question,
in relation to Dz antagonist binding affinity will be investigated. A Neural Network approach
to mixed receptor interaction of atypical antipsychotics is currently being examined, with a
resultant atypical receptor ratio profile to be established.
Y
D
U
N
Hydrophobic Regbn
Bibliography
Goodford, P.J., 1984, A computational procedure for determining energetically favourable
binding sites on biologically important macromolecules. J.Med. Chem. 28, 849-57.
Jaber, S.W. Robinson, Missale, C., Caron M.G., 1996, Review: Dopamine receptors and brain
function. Neuropharmacology, 35: 1503-1519
Liao, Y.; DeBoer, P.; Meirer, E.; Wikstrom, H., 1997, Synthesis and pharmacological
evaluation of triflate-substituted analogues of clozapine: identification of a novel
atypical neuroleptic. J. Med. Chem. 40, 4146-53.
Liljefors, T., Pettersson, I., 1997, "Computer aided development of three-dimensional
pharmacophore models". A Textbook of Drug Design and Development, Larson, P.K.;
Liljefors, T.; Madsen, U. (editors), Publisher, Hanvood Academic.
Petcher, T.J., 1995, "Topology of dopamine receptors" in The Role of Brain Dopamine
Fluckiger, E., Muller, E.E., Thorner, M.O., (Editors), hblisher, Springer Sandoz.
Schmidt, C.J., Sorensen, S.M., Kehne, J.H., Carr, A.A., Palfreyman M.G., 1995, Minireview:
The role of ~ H T zreceptors
A
in antipsychotic activity. Li$e Sciences, 56: 2209-2222
Waddington, J.L., O'Callaghan, E., 1997, What makes an antipsychotic 'atypical'? Conserving
the definition. CNS Drugs, 7: 34 1-6
Schotte, P.F.M., Janssen, W., Gommeren, W.H.M.L., Luyten, P., Van Gompel, A.S., Lesage, De
Loore K., Leysen J.E., 1996, Risperidone compared with new and reference antipsychotic drugs: in vitro and in uivo receptor binding. Psychophannacology, 124: 57-73.
449