SAMPLE OF THREE LINE GRAPH
Bạn đang xem bản rút gọn của tài liệu. Xem và tải ngay bản đầy đủ của tài liệu tại đây (219.42 KB, 2 trang )
IELT TEST BUILDER 2- TEST 1
WRITTEN BY MS LE NA
TIMING: 7 MINUTES
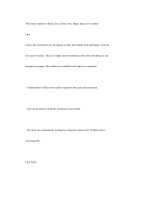
The graph shows the number of passenger railway journeys in
Great Britain from 1950 to 2004.
In general, there were fluctuations in the quantity of passenger
journeys in three railway systems over the years.
To specify, for the first thirty years, National rail network
demonstrated downward fluctuations in the number of
journeys, falling from a high of around 1 billion to about 620
million, before a rise to a peak of above 1.1 billion ones in the
last year.
Meanwhile, after quite a stable trend for the first twenty years
at 620 million, London Underground saw a recovery to the
highest point of nearly 1 billion in the last year.
Strikingly, only in the light rail and metro systems was the
lowest figure seen, being less than 240 million during the entire
period, despite its quick increase in the last twenty years.
In brief, over the years, the former two systems far exceed the
last system in the number of journeys.