IMPACTS OF CLIMATE CHANGE ON WATER RESOURCES AND ADAPTATION MEASURES
Bạn đang xem bản rút gọn của tài liệu. Xem và tải ngay bản đầy đủ của tài liệu tại đây (14.49 MB, 120 trang )
IMPACTS OF CLIMATE CHANGE
ON WATER RESOURCES AND
ADAPTATION MEASURES
FINAL REPORT
Hanoi, 11/2010
DANISH INTERNATIONAL DEVELOPMENT AGENCY (DANIDA)
EMBASSY OF DENMARK IN VIET NAM
MINISTRY OF NATURAL RESOURCES AND ENVIRONMENT (MONRE)
VIETNAM INSTITUTE OF METEOROLOGY,
HYDROLOGY AND ENVIRONMENT
PROJECT
Impacts of Climate Change
on Water Resources and
Adaptation Measures
FINAL REPORT
Adaptation M
e
rces
sou
e
R
ate Change
im
l
C
s
ure
as
W
a
te
r
Implementing Agency : Vietnam Institute of Meteorology, Hydrology and Environment
Supporting Agency : Embassy of Denmark in Viet Nam
CONTENTS
Chapter 1. INTRODUCTION
1.1. Background and justification
1.2. Objectives of the project
14
15
15
Chapter 2. SUMMARY AND CONCLUSION
16
Chapter 3. IMPACTS OF CLIMATE CHANGE ON WATER RESOURCES IN THE
STUDIED RIVER BASINS.
3.1. Climate change scenarios in the study basins
3.1.1. Air temperatures
3.1.2. Rainfall
3.1.3. Potential evapotranspiration (ETo)
3.1.4. Sea level rise
3.2. Impacts of Climate Change on water resources of study basins
3.2.1. Annual flow
3.2.2. Flow in flood season
3.2.3. Flow in dry season
3.2.4. Flooding
3.2.5. Salinity intrusion
3.2.6. Impacts on water demand for agriculture
3.2.7. Impacts on hydropower
22
23
23
25
28
30
32
32
39
49
55
69
77
79
Chapter 4. PROPOSED ADAPTATION MEASURES
84
4.1. Red – Thai Binh River basin
4.1.1. Main impacts of climate change on water resources in the river basins
4.1.2. Consequences
4.1.3. Adaptation measures
85
85
85
85
4.2. Ca River basin
4.2.1. Main impacts of climate change on water resources in Ca River basin
4.2.2. Consequences
4.2.3. Adaptation measures
87
87
87
87
4.3. Thu Bon River basin
4.3.1. Main impacts of climate change on water resources in Thu Bon River basin
4.3.2. Consequences
4.3.3. Adaptation measures
88
88
88
89
4.4. Ba River basin
4.4.1. Main impacts of climate change on water resources in Ba River basin
4.4.2. Consequences
4.4.3. Adaptation measures
90
90
91
91
4.5. Dong Nai River basin
4.5.1. Main impacts of climate change on water resources in Dong Nai River basin
4.5.2. Consequences
4.5.3. Adaptation measures
92
92
92
92
4.6. Cuu Long Delta
4.6.1. Main impact of climate change on water resources in the Cuu Long Delta
4.6.2. Consequences
4.6.3. Adaptation measures
93
93
93
93
REFERENCES
94
FINAL REPORT | 3
APPENDICES
Methodology and tool
97
1.
Climate change and sea level rise scenarios development
98
1.1. Methodology and tool for developing climate change scenarios
98
1.2. MAGICC/SCENGEN software
98
1.3. Statistical downscaling method (SD)
99
2.
Development of climate change scenarios for Vietnam and study areas
100
2.1. Inside Vietnam
100
2.2. Outside Vietnam
108
2.3. Conclusions
108
2.4. Method of estimation for daily future rainfall, temperature for meteorology stations in
study areas
110
2.5. Method for potential evapotranspiration (ETo) estimation
111
2.6. Method for development sea level rise scenarios for Viet nam
115
3.
115
Simulation models
4 | FINAL REPORT
LIST OF TABLES AND FIGURES IN APPENDICES
Table PL1. List of meteorology stations used for development of climate change scenario
101
Table PL2. Adjustment equation for ETo estimated by Hargreaves method on studied basins112
Table PL3. Correlation coefficient equation between average air temperature and ETo in the
baseline period
113
Table PL4. List of used models
115
Figure PL1. Process for assessment of climate change impact on water resources
97
Figure PL2. Diagram of building the transfer function following the PP and MOS approaches 99
Figure PL3. Map of Meteorlogy stations used to develop Climate Change Scenarios
103
Figure PL4. Change of mean monthly temperature (0C) relative to the period of 1980 – 1999
at selected stations, scenario B2
104
Figure PL5. Change of mean monthly rainfall (%), relative to the period 1980 – 1999 at
selected stations, scenario B2
106
Figure PL6. Map of change in mean annual temperature (0C ) relative to period 1980- 1999,
scenario B2
109
Figure PL7. Map of change in annual rainfall (% ) relative to the period 1980- 1999, scenario B2 109
Figure PL8. Map of change in rainfall from November to April (%) relative to the period
1980-1999, scenario (B2)
110
Figure PL9. Prediction rainfall in the future
110
FINAL REPORT | 5
LIST OF TABLES
Table 2-1.
Change in annual mean temperature (oC) relative to the period 1980-1999,
medium emission scenario (B2)
17
o
Table 2-2.
Change in annual mean temperature ( C) relative to the period 1980-1999, high
emission scenario (A2)
17
Table 2-3.
Change in annual rainfall (%) relative to the period 1980-1999, medium emission
scenario (B2)
17
Table 2-4.
Change in annual rainfall (%) relative to the period 1980-1999, high emission
scenario (A2)
19
Table 3-1.
Sea level rise (cm) relative to the period of 1980-1999
30
Table 3-2.
Change in average annual flow relative to the period of 1985 – 2000 at selected
stations in Mekong River basin, under climate change and water use scenarios 33
Table 3-3.
Average annual flow change at selected hydrology stations in the study basins
relative to the period 1980-1999, scenario A2
34
Table 3-4.
Average annual flow change at selected hydrology stations in the study basins
relative to the period 1980-1999, scenario B2
35
Table 3-5.
Change in flood season flows at selected hydrology stations in the study basins
relative to the period 1980-1999, scenario A2
40
Table 3-6.
Change in flood season flows at selected hydrology stations in the study basins
relative to the period of 1980-1999, scenario B2
41
Table 3-7.
Change in flood season flows at selected hydrology stations in Mekong River basin
relative to the period 1980 – 1999, under climate change and water use scenarios 42
Table 3-8.
Change in Flood peak (Qmax) corresponding to exceeding frequency of 1% and 5%
at selected hydrology stations, scenario A2
45
Table 3-9.
Change in Flood peak (Qmax) corresponding to exceeding frequency of 1% and 5%
at selected hydrology stations, scenario B2
46
Table 3-10. Change in dry season flows at selected hydrology stations of the Mekong basin
relative to the period 1980 – 1999, under climate change and water use scenarios 49
Table 3-11.
Change in dry season flows at selected hydrology stations of the study basins
relative to the period 1980-1999, high emissions scenario A2
50
Table 3-12.
Change in dry season flows at selected hydrology stations of the study basins
relative to the period 1980-1999, medium emissions scenario B2
51
Table 3-13. Maximum water level (Hmax) at locations on Red- Thai Binh Rives and Ca River
according to scenarios
55
Table 3-14. Area and population affected by flooding, flood shape in 1999, with reservoir
regulation, Thu Bon basin, scenario A2
58
Table 3-15. Area and population affected by flooding, flood shape in 1999, with reservoir
regulation, Thu Bon basin, scenario B2
59
Table 3-16. Area and population affected by flooding, flood shape in 1993, with reservoir
regulation, Ba basin, scenario A2
60
Table 3-17.
Area and population affected by flooding, flood shape in 1993, with reservoir
regulation, Ba basin, scenario B2
61
Table 3-18. Area and population affected by flooding, flood shape in 2000, with reservoir
regulation, Dong Nai basin, scenario A2
62
6 | FINAL REPORT
Table 3-19. Area and population affected by flooding, flood shape in 2000, with reservoir
regulation, Dong Nai basin, scenario B2
63
Table 3-20. Area and population affected by flooding, Cuu Long Delta, scenario A2
65
Table 3-21. Area and population affected by flooding, Cuu Long Delta, scenario B2
66
Table 3-22. Change in distance of salinity intrusion corresponding to salinity of 1‰ and 4‰
at the rivers of the 7 study basins, scenario A2
70
Table 3-23. Change in distance of salinity intrusion corresponding to salinity of 1‰ and 4‰
at the rivers of 7 study basins, scenario B2
71
Table 3-24. Area and population affected by salinity concentration 1‰
75
Table 3-25. Area and population effected by salinity concentration 4‰
76
Table 3-26. Water requirements for irrigation in study basins
77
Table 3-27. Water requirement for irrigation in Cuu Long Delta
78
Table 3-28. Reservoirs taken into account
79
Table 3-29. Total annual capacity of hydro-power plants in study basins (MW)
80
Table 3-30. Change in monthly capacity of hydro-power plants in study basins
81
FINAL REPORT | 7
LIST OF FIGURES
Figure 2-2.
Location of study basins
Figure 3-1.
Changes in annual mean temperature relative the period 1980-1999,
A2 and B2 scenarios
18
24
o
Figure 3-2.
Change in mean annual temperature relative to the period 1980-1999 ( C)
Figure 3-3.
Change in annual rainfall relative to the period 1980-1999 (%) in study basins. 25
Figure 3-4.
Changes in rainfall in seasons (%) compared to the period 1980-1999 in river
basins/regions
24
26
Figure 3-5.
Change in mean monthly rainfall relative to the period 1980-1999 (%), scenario
B2
27
Figure 3-6.
Changes of average annual potential evapotranspiration (%) compared to the
period 1980-1999, scenarios B2 and A2
28
Figure 3-7.
Change in potential evapotranspiration relative to the period 1980 – 1999,
scenario B2
29
Figure 3-8.
Sea level rise along coastal line of VietNam
31
Figure 3-9.
Average annual flow change (%) at selected hydrology stations in study basins
relative to the period 1980 - 1999
36
Figure 3-10.
Change in annual Rainfall (X) – Evapotranspiration (Z) – Runoff (Y) in some
catchments, Scenario B2
38
Changes in flood flow (%) relative to the period 1980-1999 at selected
hydrology stations, scenario A2 and B2
42
Figure 3-11.
Figure 3-12.
Change in flood peak (%) corresponding to exceeding 1% frequency relative
to the period 1980-1999 at selected hydrology stations
47
Figure 3-13.
Change in daily flood peak (%) at Kratie relative to the period 1985 - 2000
48
Figure 3-14.
Change in dry season flows (%) at selected stations relative to the period
1980-1999
52
Figure 3-15.
Changes in flows by the middle of 21st century at selected hydrology stations
54
Figure 3-16.
Change to flooded area downstream of study basins for big flood, scenario B2
57
Figure 3-17.
Change in flooded area in Cuu Long Delta, scenario B2
64
Figure 3-18.
Flooded map of study basins
67
Figure 3-19.
Salt water intrusion map of Red and Thai Binh Delta
72
Figure 3-20.
Salt water intrusion map of downstream of Dong Nai River basin
73
Figure 3-21.
Salt water intrusion map of Cuu Long Delta
74
Figure 3-22.
Change in water requirement for irrigation in study basins, scenario B2
78
Figure 3-23.
Change in water requirement for irrigation in Cuu Long Delta
79
Figure 3-24.
Change in annual capacity in study basins
80
8 | FINAL REPORT
LIST OF ABBREVIATIONS AND ACRONYMS
CC
Climate Change
DHI
Danish Hydraulic Institute
DANIDA
Danish International Development Agency
GCM
Global Circulation Models/ Climate Models or General Circulation Models
IMHEN
Viet Nam Institute of Meteorology, Hydrology and Environment
IPCC
Intergovernmental Panel on Climate Change
MAGICC/SCENGEN Model for the Assessment of Greenhouse-gas Induced Climate Change/
Regional Climate SCENario GENerator
MARD
Ministry of Agriculture and Rural Development
MONRE
Ministry of Natural Resources and Environment
MOST
Ministry of Science and Technology
MRC
Mekong River Commission
PRECIS
Providing REgional Climates for Impacts Studies
ROMS
Regional Ocean Model System
RCM
Regional Circulation Models
SLR
Sea Level Rise
SEA START
Southeast Asia SysTem for Analysis, Research and Training
UNFCCC
United Nations Framework Convention on Climate Change
FINAL REPORT | 9
FOREWORD
ur Earth is gradually warming from the
impacts of climate change (CC) due to
the increasing concentration of
greenhouse gases in the atmosphere.
O
Vietnam is one of the five countries affected
most severely by climate change because of the
long shoreline and the delta lowlands,
particularly Red – Thai Binh (Hong – Thai Binh)
River Delta and Cuu Long Delta, where the
majority of economic activities and population
are concentrated, but the infrastructure is not
fully developed.
With assigned mandate, Viet Nam Institute of
Meteorology, Hydrology and Environment under
the Ministry of Natural Resources and
Environment have undertaken much research on
climate change. The project "Impact of climate
change on water resources and adaptation
measures" sponsored by the Government of the
Kingdom of Denmark was undertaken with the
participation of consulting experts from the
Danish Hydraulic Institute (DHI) and the
participation of many agencies in the country.
This is one of several specific studies undertaken
by IMHE regarding climate change issues.
10 | FINAL REPORT
The research project focuses on climate change
impacts on water resources of the seven major
river basins of the Red - Thai Binh, Ca, Thu Bon,
Ba, Dong Nai and Cuu Long River. The total
water volume of the seven river basins
constitutes 87% of Vietnam's rivers. In
particular, the basins of the Red River, Ca River
and Cuu Long River have great parts of their
catchment areas outside the territory,
highlighting the difficulties and limitations of
the project. This report presents the findings
for the high and medium emission scenarios
(A2, B2), and is divided into sections as follows:
Chapter I: provides an overview and context for
the project including the objectives.
Chapter II: presents a summary of all results
and conclusions of the project. This can be
considered a summary of independent projects.
Chapter III: analyzes and compares the effects
of climate change impacts on water resources
for the studied basins.
Chapter IV: proposes adaptive measures.
Annexes and technical reports for experts and
technicians are also provided.
In the framework of the project, due to the large
areas under research, it was not possible to
carry out a detailed analysis of the impacts of
climate change on water resources and
subsequent consequences on the socioeconomic aspects. The project has addressed
the most fundamental issues of concern for
each basin, and suggested suitable adaptation
measures as a basis for policy management.
The results of the project have provided basic
information on the impacts of climate change
on water resources of Vietnam for "The 2nd
National Communication to UNFCCC". The
results of the project are important foundations
to assess the trend of changes in national water
resources in the future under the impacts of
climate change, providing scientific basis for
more in-depth studies. This Project is one of
the practical activities in the process of
implementing the National Target Program
(NTP) in response to climate change.
We gratefully acknowledge the support and
contributions of the Government of the
Kingdom of Denmark, Ministry of Foreign
Affairs of Denmark, the Danish Royal Embassy
in Hanoi, the Ministry of Natural Resources and
Environment, and all concerned organizations
and individuals.
Program Officers, Royal Embassy of Denmark in
Hanoi, who for practical guidelines and
supervisions during the project.
We are especially grateful for the group of
international experts from DHI for their most
valuable technical support and contributions to
project activities.
Special gratefulness is expressed to IMHEN for
timely and lucid guidance and encouragement.
Many thanks to the national experts for their
valuable study works which contributed to the
main outputs of the project.
We appreciate the comments and contributions
to the report by the technical experts, research
centers, and institutes in Vietnam, as well as
international experts and the Danish Royal
Embassy in Ha Noi.
It is my honor to introduce these results.
Prof. Dr. Tran Thuc
Project Director
Director of Vietnam Institute of Meteorology,
Hydrology and Environment
Ministry of Natural Resources and Environment
We are especially grateful to Mrs. Helene Bjerre
Jordans, Environment & Culture Counselor, Mr.
Lasse Melgaard, Counselor of Environment,
Climate Change and Energy; Mrs. Nguyen Thuy
Trang and Mrs. Tran Hong Viet, Climate Change
FINAL REPORT | 11
NATIONAL TECHNICAL EXPERTS
1.
Mr. TRAN THUC
Project Director, Director IMHEN.
2.
Mr. HOANG MINH TUYEN
Deputy Project Director, Hydrology and Water Resources Expert,
Deputy Director of Center for Hydrology and Water Resources Research.
3.
Mr. NGO TRONG THUAN
Hydrological Expert.
4.
Mr. TRAN THANH XUAN
Hydrological Expert.
5.
Mr. VU VAN TUAN
Water Supply and Environment Sanitary Expert.
6.
Mr. LE BAC HUYNH
Expert on Strategy of Water Resources Management.
7.
Mr. TRAN HONG THAI
Deputy Director IMHEN.
8.
Mr. PHAN VAN TAN
Climate Expert.
9.
Mr. NGUYEN VAN VIET
Agro-meteorology Expert.
10. Mr. LA THANH HA
Hydrology and Water Resources Expert,
Director of Center for Hydrology and Water Resources Research.
11.
Mr. LUONG TUAN ANH
Hydrology and Water Resources Expert,
Deputy Director of Center for Hydrology and Water Resources Research.
12. Mr. HOANG DUC CUONG
Climate Expert, Deputy Director of Center for Meteorology and Climate Research.
13. Mr. DUONG HONG SON
Oceanography Expert, Director of Center for Environment Research.
14. Mrs. HUYNH THI LAN HUONG
Hydrology and Water Resources Expert, Director Climate Change Department, IHMEN
15. Mr. LUONG HUU DUNG
Hydrology and Water Resources Expert, Center for Hydrology and Water Resources Research.
16. Mr. DANG QUANG THINH
Hydrology and Water Resources Expert, Center for Hydrology and Water Resources Research.
17.
Mr. LE TUAN NGHIA
Hydrology and Water Resources Expert, Center for Hydrology and Water Resources Research.
18. Mr. NGUYEN VAN DAI
Hydrology and Water Resources Expert, Climate Change Department.
19. Ms. NGO THI THUY
Hydrology and Water Resources Expert, Center for Hydrology and Water Resources Research.
20. Mr. VU VAN MINH
Hydrology and Water Resources Expert, Center for Hydromet and Enviroment consultancy.
21. Mr. NGUYEN MANH THANG
Hydrology and Water Resources Expert, Center for Hydromet and Enviroment consultancy.
22. Southern Institute for Water Resources Planning.
12 | FINAL REPORT
INTERNATIONAL TECHNICAL EXPERTS
1.
Mr. ROAR ASKæR JENSEN
Project CTA and hydrological Expert, DHI Water & Environment, Head of Innovation –
Water Management Department.
2.
Mr. FINN HANSEN
Project Modeling Expert, DHI Water & Environment, Head of Innovation –
Water Management Deparment.
FINAL REPORT | 13
Chapter 1 | INTRODUCTION
INTRODUCTION Chapter
1.1. Background and justification
Vietnam has abundant water resources with
total annual river flow volume of about 847 km3;
the amount of flow generated outside
Vietnam’s territory is about 507 km3, accounted
for 60%. However, water availably varies
considerably throughout the year and is
unevenly distributed across areas as well as river
systems. For example, flow volumes in Cuu Long
and Red River systems occupy 63.9% of total
flow.
Vietnam is rated as one of five countries that
will suffer most severely by climate change. The
impacts of climate change are already and will
increasingly during the 21st century be reflected
in the following aspects:
the dry season when the river flow is often
quite low. In the context of climate change,
water availability in the dry season can
decrease dramatically, leading to the risk of
water shortages becoming more acute.
Therefore, it is necessary to carry out studies
to assess fully the impact of climate change to
water resources based on climate change
scenarios in Vietnam to actively implement
appropriate adaptation measures.
1.2. Objectives of the project
General objective
The longterm objective of the project is to
strengthen the capacity of the sectors,
organizations and Vietnamese people to adapt
and response to climate change impacts on
water resources in order to minimize the
negative impacts and losses and effectively
recover from their effects, or by taking
advantage of positive impacts.
l
There is increased rainfall in the rainy
season and decreased rainfall during the dry
season. The number of rainy days will
decreased markedly, while out of season
and anomaly heavy rainfall will occur more
often;
l
The frequency of large floods will increase
in the Central and Southern of VietNam;
Immediate objectives
l
Droughts occur every year in most areas of
the country;
l
To assess the impacts of climate change on
water resources in seven main river basins
of Vietnam (Red, Thai Binh, Ca, Thu Bon, Ba,
Dong Nai and Cuu Long Delta).
l
To propose measures adapting to water
resources changing due to climate change.
l
The typhoon tracks have the tendency of
moving southward and typhoon season
tends to end later;
l
The frequency of cold fronts in northern
VietNam declined sharply over the last
three decades. The number of days of
extreme and damaging cold surges has
reduced remarkably. However, anomalous
events can occur more frequently;
l
The number of hot days in the decade 19912000 has become more frequently relative
to the period of 1961-1990, particularly in
the central and southern regions of
Vietnam.
The immediate objectives are:
In addition, the sea level may rise between
0.65 m to 1.0 m by 2100, therefore Cuu Long,
Red River deltas and coastal areas in the
central part will be subject to inundation,
flooding and salinity intrusion.
On the other hand, population growth and
socio - economic development increase
significantly water demand, especially during
FINAL REPORT | 15
1
Chapter 2 | SUMMARY AND
CONCLUSION
SUMMARY AND CONCLUSION Chapter
The project has analyzed the situation of climate change (rainfall and temperature changes) on
7 of Vietnam largest river basins (Fig. 2-1): Red - Thai Binh, Ca, Thu Bon, Ba, Dong Nai Rivers and
Cuu Long Delta with high (A2) and medium (B2) emissions scenarios. Together the seven basins
are deemed to be representative of the climate change effects in the Country. Some results are
summarised in the tables 2-1 to 2-4.
Table 2-1. Change in annual mean temperature (oC) relative to the period 1980-1999,
medium emission scenario (B2)
Decades in
therelative
21st Century
Table 2-2. Change in annual mean temperature
(oC)
to the period 1980-1999,
River basin/area
high emission scenario
(A2)
2020
2030
2040
2050
2060
2070
2080
2090
2100
Red and
Thai
Binh
0.50
0.73
1.03(%) relative
1.33
1.63
2.35 medium
2.55
Table
2-3.
Change
in
annual
rainfall
to the 1.90
period 2.10
1980-1999,
emission
Cascenario (B2)
0.58
0.83
1.15
1.50
1.83
2.13
2.43
2.65
2.85
Thu Bon
0.50
0.70
1.03
1.33
1.63
1.90
2.10
2.35
2.55
Ba
0.48
0.73
1.03
1.33
1.60
1.88
2.10
2.30
2.50
Dong Nai
0.35
0.53
0.75
0.98
1.15
1.33
1.55
1.70
1.80
Cuu Long Delta
0.35
0.50
0.75
0.98
1.20
1.35
1.58
1.70
1.85
Decades in the 21st Century
River basin/area
2020
2030
2040
2050
2060
2070
2080
2090
2100
Red and Thai Binh
0.55
0.75
0.98
1.28
1.63
2.00
2.35
2.80
3.25
Ca
0.60
0.85
1.13
1.48
1.80
2.23
2.68
3.15
3.65
Thu Bon
0.55
0.73
0.98
1.28
1.60
2.00
2.38
2.80
3.23
Ba
0.55
0.75
0.98
1.25
1.58
1.95
2.35
2.78
3.18
Dong Nai
0.38
0.55
0.68
0.93
1.15
1.43
1.73
2.03
2.33
Cuu Long Delta
0.40
0.50
0.73
0.95
1.15
1.45
1.73
2.05
2.35
Decades in the 21st Century
River basin/area
2020
2030
2040
2050
2060
2070
2080
2090
2100
Red and Thai Binh
0.8
1.3
1.9
2.6
3.4
4.1
4.8
5.4
6.0
Ca
1.3
2.0
2.8
3.6
4.3
5.1
5.7
6.3
6.8
Thu Bon
0.6
0.9
1.2
1.6
1.9
2.3
2.5
2.8
3.0
Ba
0.6
0.9
1.3
1.7
2.1
2.4
2.7
3.0
3.2
Dong Nai
0.3
0.5
0.7
0.9
1.1
1.3
1.4
1.6
1.7
Cuu Long Delta
0.4
0.9
1.3
1.7
2.1
2.3
2.5
2.5
2.5
FINAL REPORT | 17
2
Chapter 2 SUMMARY AND CONCLUSION
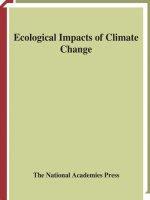
Figure 2-2. Location of study basins
Study Areas
(% of Country)
Cuu Long Delta
Ba
Thu Bon 4.3%
3.3%
Dong Nai
11.3%
12%
Ca 6.2%
Not studied
36%
Hong- Thai Binh
26.9%
Hong
Thai Binh
Population of study areas
(% of Country)
Ba
Thu Bon 1.7% Dong Nai
2.7%
14,9%
Ca 5.1%
20.5%
Ca
Cuu Long Delta
Hong- Thai Binh
35.8%
19.3%
Not studied
Thu Bon
Flow volume
(% of Country)
59.9%
Cuu Long Delta
Ba
Dong Nai 4.3%
Ba 1.2% 2.4%
Thu Bon 2.8%
Ca
16.4%
Hong- Thai Binh
13%
Not studied
Dong Nai
Cuu Long Delta
18 | FINAL REPORT
SUMMARY AND CONCLUSION Chapter
Table 2-4. Change in annual rainfall (%) relative to the period 1980-1999, high
emission scenario (A2)
Decades in the 21st Century
River basin/area
2020
2030
2040
2050
2060
2070
2080
2090
2100
Red and Thai Binh
0.9
1.4
1.9
2.5
3.2
4.1
5.1
6.1
7.2
Ca
1.4
2.0
2.6
3.4
4.3
5.3
6.4
7.5
8.7
Thu Bon
0.6
0.9
1.2
1.5
1.9
2.4
2.8
3.3
3.9
Ba
0.7
1.0
1.2
1.6
2.0
2.5
3.0
3.6
4.1
Dong Nai
0.4
0.5
0.7
0.8
1.1
1.3
1.6
1.9
2.2
Cuu Long Delta
0.5
1.0
1.4
1.8
2.2
2.5
2.7
2.8
2.9
Combining temperature and rainfall data with
the sea level rise scenarios built in the project
"Sea level rise scenarios and possible disaster
risk reduction in Vietnam”, this project
estimated and assessed the impact on water
resources for the 7 study River basins.
Change in the river water resources
By comparing with average flows of the period
1980-1999 some outputs obtained as follow:
Annual flow: For the climate change scenarios
A2 and B2, flows in Red - Thai Binh, Ca, Ba, and
Thu Bon River basins tended to increase by
less than 2% in the period 2040-2059 and up
to 2÷5% in the period 2080-2099, with the
greatest increase in flow up to 5.8%. The
average flow of the Mekong River into Cuu
Long Delta in the period 2010-2050 increases
about 4÷6% over 1985-2000 period.
In contrast, the flows of La tributary of Ca River
and Dong Nai River system trend downward,
reducing by 3%. Flow decrease in Dong Nai River
system is from 3% to 6% in the middle 21st
century and 5% to 7.5% in the late 21st century.
Flood flow: most of flows of Red, Thai Binh, Ca,
Ba and Thu Bon Rivers tend to increase
compared with present, but to varying degrees,
generally from 2% to 4% in the period 20402059 and from 4% to 10% in the period 20802099. Particularly in Thu Bon River and Ngan
Sau River, flood flow changes less than 2% in
the period 2040-2059 and less than 3% in the
period 2080-2099.
Meanwhile, the flow in flood season of Dong
Nai River system falls by 2.5% to 6% and by
4% to 8% in two periods mentioned above.
For the Mekong River, compared with the
period 1985-2000, the average flood flow at
Kratie station of period 2010-2050 increases
only about 5% to 7%.
Apart from Dong Nai River basin, the peak flow
and total volume of the big floods increased in
almost all basins. Flood peak values increase
from 6% to 27%. In the basins with heavy rainfall
in the rainy season such as Ba River, the
branches of Da river system (in Red River basin),
flood peaks rise up to more than 15%. The peak
flow of Dong Nai River basin decreases slightly,
less than 1.5% at the end of the 21st century.
Dry season flows: Climate change can lead into
decreasing dry season flow. Comparing with
baseline period, dry season flows decrease by
2% to 9% in the period 2040-2059 and by 4% to
12% in the period 2080-2099.
However, compared to the period 1985-2000,
average dry season flow of period 2010-2050 of
the Mekong River in Tan Chau has an increasing
tendency of about 10%, while the smallest
monthly flow decreases by 5% in scenarios B2
and increases by 3% in scenarios A2.
FINAL REPORT | 19
2
Chapter 2 SUMMARY AND CONCLUSION
Some main impacts
Climate change impacts are observed to be
greatest in Cuu Long Delta and Red - Thai Binh
River Delta.
In Cuu Long Delta, the saliferous area (salinity
concentration >1‰) accounts for over
2,500,000 ha in 2050. With increased flooding
projected in the mid-21st century, the inundated
area of Cuu Long River Delta increases to over
3,500,000 ha, accounting for nearly 90% of its
area.
In Dong Nai River Basin, the flow decreases
significantly with the impact of sea level rise. By
the end of the 21st century, 300,000 ha
downstream flooding due to upstream floods
and saltwater encroachment will average more
than 10 km. These considerably affect the socioeconomic development, especially in Ho Chi
Minh City.
In Red- Thai Binh River Deltas, saltwater
intrusion into the land ranges more than 3÷9
km by 2100. Upstream floods are bigger. The
flood peak of 1% (Qmax1%) increases from 8% to
10% in 2050 and possibly up to 11% to 25% by
2100. This greatly affects the safety of all
upstream reservoir systems and nearly 2700
km of dyke system protecting the whole delta.
Thu Bon and Ba Rivers are under strong
pressured from water exploitation, and dense
hydroelectric power systems. Under the impact
of climate change, conflicts between water
users would be more critical. At the same time,
greater flooding leads to marked increase in
flooded area of about 4% in 2050 and up to 9%
in 2100. In the dry season, water shortage in
downstream occurs more frequently. Salinity
intrusion is threatening downstream plains
with deeper saltwater encroachment about 3
km from sea in Ba river catchment and possibly
up to 8 km in some branches of Thu Bon River
in 2100.
Ca River is affected less but the basin here has
the highest temperature increase. Annual flow
in La branch is reduced, especially in the dry
season, by 10% by 2100. Flood peak increases
by 4% to 15% in the end of century, which
affects the dyke system protecting the
downstream delta. In the main flow, salinity
intrusion is 4km to 5km further inland.
20 | FINAL REPORT
Proposed Adaptation measures
1) Red-Thai Binh River Basin
l
Continue to develop multi-purpose reservoirs
l
Build the dams, sluices to shut off saltwater
for downstream in the North Delta.
l
Upgrade river and sea dyke systems.
l
Restore forest.
l
Save water in various sectors, especially in
agriculture.
l
Promote and realize cooperation with China in
water resources management.
2) Ca River Basin
l
Carry out the construction of planned multipurpose reservoirs. Develop operating rules for
reservoir systems.
l
Upgrade inland drainage systems.
l
Develop water supply systems.
l
Strengthen cooperation with Lao PDR in the
integrated water resources management to
share water upstream of Ca River in Laos
territory.
3) Thu Bon River Basin
l
Continue to develop reservoir system with
different volumes, including multi-purpose
reservoirs and reservoirs of specific objectives.
l
Establish operating rules for reservoir systems.
l
Upgrade and build water supply plan for
domestic and industrial uses.
l
Maintain small water supply systems and
SUMMARY AND CONCLUSION Chapter
develop priority water supply systems for
districts with concentrated population and
industry.
construction of water plants pumping water
from rivers.
l
Develop irrigation and drainage projects,
including pump stations for expanding
irrigation areas.
Construct dams and sluices to prevent
saltwater.
l
Build dykes and sluices to prevent saltwater
intrusion.
Construct houses to evacuate people from
flooding in sever inundation areas.
l
Strengthen measures to conserve water
quality, prevent pollution from industrial
activities and wastes.
l
Strengthen the capacity of gravity drainage
systems to reduce the impact of inundation.
l
l
4) Ba River Basin
l
l
6) Cuu Long Delta
Review planning of projects for water
resources development based on integrated
planning of river basins.
l
Preserve and afforest at upstream, implement
coordinated land-use planning, soil protection,
erosion control.
Complete and consolidate planning works for
flood protection in Cuu Long Delta, taking into
account the impacts of climate change.
l
Plan and progressively build sea dyke system
along the East Sea and West Sea.
l
Maintain environmental flow downstream of
projects.
l
Construct sluices to prevent saltwater
intrusion.
l
Implement flood prevention measures in the
basin, particularly in the middle and
downstream areas.
l
Shift crop and livestock pattern based on landuse planning.
l
l
Set up fair principles of water resources
allocation
between
upstream
and
downstream areas.
Harvest fresh water (rain water in rainy
seasons) by family size.
l
Apply
measures
conservation
and
prevention.
l
Promote activities in the Mekong River
Commission on issues relating to water
resources of river basins.
5) Dong Nai River Basin
l
Continue to construct reservoirs with adjusted
design parameters by considering the impact
of climate change.
l
Set up mechanism of water resources sharing.
l
Strengthen
water
supply
through
for
environment
water
pollution
the
FINAL REPORT | 21
2
Chapter 3 IMPACTS OF CLIMATE
CHANGE ON WATER
RESOURCES IN THE
STUDIED RIVER
BASINS
IMPACTS OF CLIMATE CHANGE ON WATER RESOURCES IN THE STUDY RIVER BASINS
Chapter 3
3.1. Climate change scenarios in the
study basins
In the project, the software MAGICC / SCENGEN
5.3 and Statistical Dowscaling methods were used
to develop climate change scenarios for Vietnam
in general and the study river basins in particular.
For parts of Red River, Ca River and Mekong River
basins that are external to Vietnam, of the
Dynamic Dowscaling Model (PRECIS) was used
instead, due to lack of meteorological data and
constraining timing.
Scenarios of greenhouse gas emissions were
selected to build climate change scenarios for the
low emissions scenario (B1), the medium emission
scenario (B2) and high emissions scenarios (A2). The
baseline period was 20 years, from 1980 to 1999.
Two important meteorological elements, rainfall
and air temperature, were computed and analyzed
for each scenario. In addition to the changes of
climatic factors, sea level rise was also taken into
account to assess the extent of flooding and
salinity intrusion. The pressure of increased future
water demand due to climate change was also
considered in the project.
3.1.1. Air temperatures
In all scenarios for the 7 study basins, temperature
increase throughout the 21st century. In the B2
scenario, annual mean temperature increases
about 0.9 to 1.5 oC in the mid- 21st century and up
to 1.8to 2.8oC by the end of 21st century (Fig. 3-1).
In the A2 scenario, the increase is more significant.
The annual mean temperature increases 1.0oC to
1.5oC by the mid 21st century and up to 2.3 oC to
3.6oC by the late 21st century (Fig. 3-1). After 2050,
the difference in the extent of temperature change
between the scenarios is more evident (Fig. 3-2).
In Ca River basin, temperatures rises at the highest
rate, followed by Red -Thai Binh River basin. In
Thu Bon and Ba River basins, temperatures have
similar increases in the medium term. In Dong Nai
River basin and Cuu Long Delta, temperatures
increase less, with Dong Nai River basin has the
smallest temperature rise.
In general, in the rainy season, on the river basins
from Red-Thai Binh to Ba River basin, temperature
rises less than in dry season, but on Dong Nai River
basin and Cuu Long Delta, there is an opposite
trend.
FINAL REPORT | 23