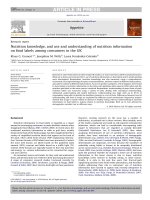
P10042 gibson et al
Bạn đang xem bản rút gọn của tài liệu. Xem và tải ngay bản đầy đủ của tài liệu tại đây (623.93 KB, 13 trang )
FULL-SCALE AND LABORATORY FATIGUE CRACKING PERFORMANCE OF
COMBINED HIGH-RECYCLE AND WARM MIX ASPHALT PAVEMENTS
By:
Nelson Gibson, Federal Highway Administration
Phone: (202) 493-3073
Youngguk Seo, SES Group
Turner Fairbank Highway Research Center
Phone: (202) 493-3472
Xinjun Li, SES Group
Turner Fairbank Highway Research Center
Phone: (202) 493-3089
Adrian Adriescu, SES Group
Turner Fairbank Highway Research Center
Phone: (202) 493-3497
and
Jack Youtcheff, Federal Highway Administration
Phone: (202) 493-3090
6300 Georgetown Parkway
McLean, VA 22101
USA
PRESENTED FOR THE
2014 FAA WORLDWIDE AIRPORT TECHNOLOGY TRANSFER CONFERENCE
Galloway, New Jersey, USA
August 2014
Nelson et al.
1
ABSRTACT
The Federal Highway Administration’s Office of Infrastructure Research and Development
has initiated a full-scale accelerated pavement testing experiment to evaluate the fatigue cracking
performance of sustainable asphalt materials and mix designs. Recycled asphalt pavement (RAP)
contents providing up to 40% asphalt binder replaced (ABR) by 44% by RAP by weight have
been incorporated in hot mix asphalt (HMA) production as well as reduced-temperature warm
mix asphalt (WMA) that was produced with water foaming and chemical additive. Recycled
asphalt shingles (RAS) have been incorporated to provide 20% ABR in HMA. The objective of
the experiment is to establish realistic boundaries for high-RAP & RAS mixtures employing
WMA technologies based on percent binder replacement and binder grade changes when
combined together. This paper will document the construction, the as-built engineering
properties of the 10 different test sections characterized in the laboratory, and the full scale
fatigue cracking performance.
INTRODUCTION
Established in 1986, the Pavement Testing Facility (PTF) at Turner Fairbank Highway
Research Center (TFHRC) of Federal Highway Administration (FHWA) provides pavement
researchers and engineers with the capability to simulate an entire service life of full scale
pavements in just a few months. The PTF is an outdoor laboratory featuring two Accelerated
Loading Facility (ALF) units. Each ALF unit has a moving trolley that closely reproduces the
conditions of one half of a single truck axle with various tire configurations (super single or
standard dual). The trolley speed can be varied up to 11 miles per hour (18 kilometers per hour),
and wheel load levels can be adjusted from 10,000 pounds to 23,000 pounds. The PTF can
accommodate up to 12 full scale ALF pavement test lanes and each lane is further divided into
four test sites furnishing a total of 48 potential case studies. Two ALF units allow simultaneous
testing of two pavement lanes (sites) under the same ambient temperature and moisture
conditions or at the same pavement age.
In October 2013, PTF completed a construction of the test lanes to study the combination of
two sustainable technologies: (1) increased use of recycled materials in roadways and (2)
reduced-temperature warm-mix asphalt. The full scale test lanes were constructed with varying
degrees of recycle content using alternative production technologies that are more
environmentally friendly than previous techniques. FHWA will test the sections to failure
through 2015 to establish realistic boundaries for mixtures with high amounts of recycle content
that employ warm-mix asphalt production technologies. This research is also going to identify
optimal pairings of the two technologies, while ensuring that they have limited or no impact on
performance compared to conventional pavement materials.
This paper summarizes the construction, the as-built engineering properties of the 10
different ALF lanes characterized in the laboratory, and some preliminary data collected from the
full scale fatigue cracking performance tests.
Nelson et al.
2
EXPERIMENTAL DESIGN
The experimental design developed in this study is summarized in Table 1. Based on this
design, ten plant-produced asphalt mixtures are characterized through a series of small laboratory
tests, and their structural response and fatigue cracking performance are evaluated on the full
scale ALF lanes. To implement this testing program, two commonly used asphalt binders in the
State of Virginia were chosen as virgin binders (PG 64-22 and PG 58-28) that were combined
either with recycled asphalt pavement (RAP) or with recycled asphalt shingles (RAS).
RAP contents providing 20% asphalt binder replaced (ABR) by 23% by RAP by weight and
40% ABR by 44% by RAP by weight have been incorporated in hot mix asphalt (HMA)
production as well as reduced-temperature warm mix asphalt (WMA). Either water foaming or
chemical additive (EvothermTM) was used to produce WMA. For RAS mixes, RAS content that
provides 20% ABR by 6% by RAS by weight was introduced only in HMA. With this
comprehensive experimental study, FHWA may find clear answers to the combined effect of
high-recycle and WMA materials on the engineering properties and fatigue cracking
performance.
Table 1.
Experimental Design.
ALF Lane
% ABRa
RAP
1
0
2
40
3
4
20
5
40
6
20
7
8
40
9
20
10
40
a
asphalt binder replacement
b
chemical additive
RAS
20
20
-
Virgin Binder
Production Temp.
WMA Process
64-22
58-28
64-22
64-22
64-22
64-22
58-28
58-28
64-22
58-28
300F-320F
240F-270F
300F-320F
240F-270F
300F-320F
300F-320F
300F-320F
240F-270F
240F-270F
300F-320F
Water Foam
Evothermb
Evothermb
Water Foam
-
CONSTRUCTION OF ALF TEST LANES
Construction of ALF test lanes at PTF started in July 20 of 2014 and ended in October 29 of
2014. It began with the milling of existing asphalt layers on the parking lot and the ALF lanes
shown in Figure 1. The parking lot was used for 2-inch thick asphalt test strips. Each ALF lane
was designed to have a new 4-inch thick (two 2-inch lifts) asphalt layer placed on top of a 22inch thick Crushed Aggregate Base (CAB) and a silt clay subgrade (American Association of
State Highway and Transportation Officials (AASHTO) soil classA-4). Therefore, in some lanes
whose asphalt layers had been thicker than 4 inches for previous studies, a new base material (25
mm Nominal Maximum Aggregate Size (NMSA)) was added to adjust the level of CAB. In
addition, top portion (about 4-inch deep) of CAB was reconditioned and compacted to ensure the
uniform support from CAB. A soil Light Weight Deflectometer (LWD) with a 300 mm loading
Nelson et al.
3
plate was utilized to check the modulus of finished CAB. Figure 2 presents the average modulus
of CAB in each ALF lane.
ALF pavement
test lanes
Test strips
Figure 1.
Aerial Image of ALF Reconstruction Area at TFHRC.
Figure 2.
Modulus of Finished CAB (lane 11 is a reproduction of lane 10).
For quality acceptance of asphalt layers, a test strip was built before each ALF asphalt layer
was placed. This strip was used to determine the appropriate rolling pattern needed to achieve the
desired in place density, to check the uniformity of layer thickness, and to approve each asphalt
mixture by determining its asphalt binder content, aggregate gradation, maximum specific
gravity, and volumetrics. The same quality acceptance test was also performed on all ALF lanes
as illustrated in Figure 3. The paving contractor and FHWA randomly obtained four bucket
samples of each plant-produced mixture according to AASHTO T168. The materials had to meet
the specifications before the ALF pavement could be built.
In this study, a half-inch (12.5 mm) Nominal Maximum Size of Aggregate (NMSA) was
used for all asphalt layers as shown in Figure 4. Density and thickness were checked both by
Nelson et al.
4
sawing rectangular blocks and by coring cylindrical samples from the pavement. Layer thickness
was measured at each survey nail. Figure 5 presents the average thickness of each lane.
Thickness survey nails
Cores for in-place density check
Behind-the paver sampling location
Figure 3.
Sampling and Surveying Scheme for Quality Acceptance Test.
Figure 4.
Target Aggregate Gradation of ALF Test Lanes (lane 11 is a reproduction of lane 10).
Figure 5.
Asphalt Layer Thickness of ALF Test Lanes (lane 11 is a reproduction of lane 10).
Nelson et al. 5
All quality acceptance test data were collected, analyzed and summarized in the “spider
web” charts as shown in Figure 6. Prepared for all test strips and ALF lanes, these charts enabled
paving contractor to overview and improve the quality of construction and materials designed
and produced. Specifications were tight and thus some mixtures in the test strips were rejected in
order to get them produced correctly. Among ALF test lanes only lane 10 was rejected.
However, instead of removing that lane, it was decided to keep it for additional performance at
the final stage of the project. The rejected mixture (40% ABR RAP) originally assigned for lane
10 was redesigned and placed on lane 11. As a result of the reconstruction, 16 test strips and 11
ALF test lanes were built at the PTF.
Figure 6.
Quality Acceptance Result of ALF Lane 1 (Accepted) and Lane 10 (Rejected).
LABORATORY CHARACTERIZATIONS OF RECYCLE MIXTURES
To characterize RAS and RAP, both binder extraction and performance grade evaluation
tests were conducted on samples taken from RAP and RAS stockpiles. The RAP and the RAS
were sampled according with AASHTO T168 (Sampling of Bituminous Paving Mixtures). First,
the materials were dried in the oven at 110°C until constant weight in order to remove the
moisture. The asphalt material contained in the samples was extracted, recovered and the
rheological properties were investigated. The extraction method was based on the AASHTO
T319-08 (Quantitative Extraction and Recovery of Asphalt Binder from Asphalt Mixtures),
while the solvent of choice was trichloroethylene. In brief, the procedure involved soaking the
materials with solvent for about 40 minutes, followed by the removal of the saturated solvent.
Two more subsequent washes were necessary to remove all the asphalt material and to obtain a
light brown color for the final filtrate. About 2 liters of solvent are considered enough for the
extraction of about 5kg of recycled RAP or RAS. The filtrate was passed through a centrifuge
and then through a super-centrifuge to remove all the traces of fines. The remaining aggregates
(for RAP) or fibers and fines (for RAS) were dried and then weighted. The percent difference
between the initial weight and the weight after the extraction procedure represents the asphalt
cement (AC) content. A total of 13 RAP and 6 RAS extractions were performed. Table 2
presents the average AC percent in the extracted materials.
Nelson et al.
6
Table 2.Average Asphalt Cement (AC) Content (%) in RAP and RAS Materials.
Materials
Average ACa, %
RAP
4.72
RAS
20.85
a
ignition oven test yielded slightly higher average AC % values (5.28% for RAS and 22.45% for
RAS)
The solvent containing extracted binders was removed with the use of a rotary evaporator.
The procedure was performed at 135°C under protected conditions (a blanket of CO2 gas and a
mild vacuum of 5in Hg). At the end, for a short period of time (15min) an increase in vacuum to
20in Hg was assumed to eliminate all traces of solvent. The extracted asphalts were tested for
conventional binder rheology. Mixture preparation, mixture aging and the recovery procedure
involved the exposure of the materials at high temperatures for extensive periods of time. It may
be correct to assume that the recovered asphalt aging level was at least at the Rolling Thin Film
Oven (RTFO) level or higher. As a consequence, no specific procedures were used to further age
the extracted materials. Low, Intermediate and High Temperature Performance Grades (LTPG,
ITPG and HTPG respectively) were determined according to the AASHTO standards (T-313-12,
Determining the Flexural Creep Stiffness of Asphalt Binder Using the Bending Beam Rheometer
(BBR) and T 315-12, Determining the Rheological Properties of Asphalt Binder Using a
Dynamic Shear Rheometer (DSR)). Some pertinent properties of the extracted AC from the RAP
material are presented in Table 3.
Table 3.Pertinent Properties of the Extracted AC from the RAP Material.
Binder Performance Grade
Temperature,°C
High Temperature Performance Grade (HTPG)
89.4
Intermediate Temperature Performance Grade (ITPG)
29.1
Low Temperature Performance Grade (LTPG)
-21.7
The asphalt binder obtained from RAS was extremely stiff and subsequent attempts to test it
in DSR have failed to provide a meaningful result. It is fair to say that the High Temperature
Performance Grade (HTPG) was above 140°C, exceeding the normal DSR testing range.
Because of the nature of the material, no attempt was done to investigate other rheological
properties.
Dynamic modulus, phase angle, and time-temperature shift factor are the fundamental
engineering properties of asphalt mixtures, which have also been used as key variables for
performance prediction models. To obtain those properties from control and recycle mixes, a
series of complex modules tests was performed in the laboratory. These tests were conducted at
multiple frequency-temperature combinations that were determined to be adequate to develop a
dynamic modulus master curve. The Asphalt Materials Performance Tester (AMPT) was used
for the tests and data analyses, and small scale cylinder samples were extracted from top and
bottom lift of 6 inch diameter field cores that were taken from each ALF lane. The testing
frequencies range from 0.1 to 25 Hz and the testing temperature from 4.4 to 54.4oC. To minimize
any permanent deformations, testing was conducted with temperatures starting from the lowest
to the highest, and frequencies were applied at each temperature from the fastest to the slowest.
Nelson et al.
7
The load amplitude was adjusted based on the material stiffness, air void content, temperature,
and frequency to keep the strain response with 85-115 µstrains (NCHRP 9-29 default values).
Figure 7 presents the dynamic modulus (E*) master curves. The dynamic moduli measured
from top and bottom lift samples were averaged for this presentation. Overall, dynamic modulus
of lane 1(0% RAP, PG 64-22 HMA), a control mix, was the smallest and dynamic modulus of
lane 5 (40% RAP, PG 64-22 HMA) was the largest. To better understand the effect of recycle
content on dynamic modulus, only lanes 1, 3 (20% RAS, PG 64-22 HMA), 5, and 6 (20% RAP,
PG 64-22 HMA) were plotted in Figure 8. The ranking of the dynamic modulus from high to low
was lane 5, lane 3, lane 6, and lane 1. This suggested that asphalt mixture becomes stiffer as
recycle content increases. As many fatigue prediction models suggest, a higher dynamic modulus
normally causes a shorter fatigue life. Although other model variables need to be considered for
more accurate assessment, it would be fair to say that high recycle content could make asphalt
material more vulnerable to fatigue cracking.
Figure 7.
E* Master Curves of All Control and Recycle Mixtures in Log-Log Scale
Figure 8.
Effect of Recycle Content on E* (Bottom Lift)
Nelson et al.
8
Figure 9 illustrates the effect of soft virgin binder (PG 58-28) on the dynamic modulus. The
dynamic moduli of recycle mixtures of lanes 1, 6, 7 (20% RAS ABR, PG 58-28 HMA), and 8
(40% RAP, PG 58-28, HMA) were compared. As already seen in Figure 7, three mixtures with
RAP or RAS had higher dynamic moduli than that of conventional HMA (lane 1). However, soft
binder seemed effective in reducing the dynamic moduli of recycle asphalt mixtures and thus
increasing the fatigue life even at the higher recycle level (40% ABR RAP).
Finally, the effect of WMA on the dynamic modulus was investigated at the same recycle
content level (20% ABR RAP). Figure 10 shows dynamic moduli of WMA were smaller than
that of HMA. This may be due to the amount of aging induced during the mixture production and
suggests WMA should provide a better performance than HMA counterpart among recycle
mixtures. The effect of WMA technologies (water foam versus chemical additive) was not
significant.
Figure 9.
Effect of Soft Binder on E* (Top Lift)
Figure 10.
Effect of WAM on E* (Top Lift)
Nelson et al.
9
After the complex modulus test, the fatigue test was conducted on both small scale field
samples and standard gyratory samples using the AMPT. Air void content of gyratory samples
was controlled at around 7.0% to simulate the target field air void and the tests were carried out
at 20oC until each specimen completely failed. Table 4 summarizes the fatigue performance of
individual mixtures. Three performance groups were formed: green (better performance), yellow
(intermediate performance) and red (worse performance). Asphalt mixtures used for the
construction of ALF lanes 1, 8, 9, and 10 were categorized into the green group, whereas
mixtures for lanes 3, 5, 7 were into the red group. This is in good agreement with the fatigue
performance ranking estimated based on the dynamic modulus master curves described earlier.
Except for 20% ABR RAP PG 64-22 WMA, both field and gyratory samples yielded the same
fatigue performance.
Table 4. AMPT Fatigue Test Results.
Horizontal Field Core
In-Place Density
Standard Gyratory Sample
Controlled 7% air voids
GREEN
0% Control
PG 64-22
40% ABR RAP PG 58-28
20% ABR RAP PG 64-22 WMA Foam
40% ABR RAP PG 58-28 WMA Chem. #1
0% Control
PG 64-22
40% ABR RAP PG 58-28
20% ABR RAP PG 64-22 WMA Chem.
40% ABR RAP PG 58-28 WMA Chem. #1
YELLOW
40% ABR RAP PG 58-28 WMA Foam
20% ABR RAP PG 64-22 WMA Chem.
20% ABR RAP PG 64-22
40% ABR RAP PG 58-28 WMA Chem. #2
40% ABR RAP PG 58-28 WMA Foam
20% ABR RAP PG 64-22 WMA Foam
20% ABR RAP PG 64-22
40% ABR RAP PG 58-28 WMA Chem. #2
RED
20% ABR RAS PG 64-22
20% ABR RAS PG 58-28
40% ABR RAP PG 64-22
20% ABR RAS PG 64-22
20% ABR RAS PG 58-28
40% ABR RAP PG 64-22
ALF LANE INSTRUMENTATION AND DATA ACQUISITION
Each full scale test lane was 50 m by 4 m (165 feet by 14 feet) which was further divided
into four sites. Immediate before the ALF fatigue testing, seven Layer Deflection Measurement
Assemblies (LDMAs) were installed in each site to collect vertical deflections at the surface of
asphalt layer and at the surface of underlying CAB. At each “milestone” (for instance every
25,000 load repetition), a survey rod was placed on each LDMA and vertical settlements were
viewed and measured with a telescope fixed at a certain location throughout the testing. This
information was used to quantify the rut depths and estimate the contributions of underlying
layers. Also, a semi–automatic laser surface profiler was used to measure transverse pavement
surface profile to support the LDMA measurements.
On each site, twelve K-type thermocouples were also installed at the designated locations
and depths to collect pavement depth temperature (at surface, ¾ -inch, 2-inch, and 3¾-inch) and
to control pavement zone temperature (at 2-inch). An electronic temperature control and data
acquisition system was utilized to record the temperatures at various locations and depths in real
time and to regulate the radiant heaters that provide a target zone temperature. Usually, the zone
Nelson et al. 10
temperature is set at 19~20oC for fatigue cracking can be increased up to 74oC for high
temperature rutting. Figure 11 depicts LDMA and thermocouple instrumentation.
Figure 11.
ALF Test Site Instrumented with Thermocouples and LDMAs.
During the placement of asphalt layers on lanes 9 (site 2) and 10 (site 1), eleven strain
gauges with three different types were installed. However, three longitudinal strain gauges did
not survive the construction due to thin asphalt lift (2-inch) and heavy roller compactors. Strain
responses from survived strain gauges were measured using a multi-channel data acquisition
system before any fatigue loading began and are going to be predicted by the linear viscoelastic
analysis for critical damage to establish relationships between response, axle loads, and
pavement performance after considering the effect of climate and aging.
ALF FATIGUE TESTING
The frequency of load passes was used as a primary way of accelerating the fatigue cracking
in recycled asphalt pavements, whereas wheel load and pavement temperature conditions were
maintained the same throughout the testing. Pavement temperature was conditioned at 20oC so
that no high temperature rutting occurred. The wheel load was 14,200 pounds and was applied in
a unidirectional mode. As the loaded wheel travelled over the test site at a constant speed of 11
miles per hour, it followed a left-to-right wander pattern to simulate the lateral distribution of
road way traffic. The moving trolley was fitted with a super single tire (HTR2 425/65R22.5)
whose pressure was 100 psi (689 kPa).
Prior to the main fatigue test, a shakedown test was conducted on lane 9 (site 2) to estimate
the speed of damage accumulation and the initiation time of macro-cracks. This shakedown test
was also used to check the operation and data acquisition systems. The wheel load was 10,300
pounds in the beginning and was increased to 14,200 pounds after 125,000 passes because
researchers at TFHRC felt that the 10,300-pound of wheel load was too light to induce cracking
in a reasonable amount of time. Currently, main fatigue cracking tests are being conducted at
lane 11 (site 2) and lane 1(site 2) with the 14,200 pounds of the wheel load.
The moduli of asphalt layers were measured at each milestone using an asphalt LWD with a
30 mm loading pin and a Portable Seismic Pavement Analyzer (PSAP) to monitor the modulus
changes and to associate them with the damage accumulation. Both modulus tests were
conducted at LDMA locations of each site, and PSPA test was conducted in longitudinal (PSPA-
Nelson et al. 11
L) and transverse (PSPA-T) directions. Figure 12 depicts the moduli measured at lane 9 and lane
11. No modulus and fatigue data were available on lane that has been subjected to only 5,000
loading passes. The moduli decreased as the number of loading passes increased, suggesting
damages were gradually accumulated in asphalt layers. The first surface macro-cracks were
observed about at 225,000 passes on lane 9 and 75,000 passes on lane 11.
Figure 12.
Modulus Change in Lane 9 (left) and Lane 11 (right).
Rut depth and cracks were also measured manually on both lanes (sites). As illustrated in
Figure 13, rut depths increased fast up to certain load cycle and gradually increased thereafter
until the end of test. Crack surveys usually consisted of a manual measurement of cracks along
the wheel track and characterization of extent and severity. Crack maps were sketched at each
milestone and documented on transparent plastic sheet (Mylar® sheet). Figure 14 presents the
accumulative crack lengths. So far, forensic study indicates most of cracks initiated at the bottom
of asphalt layer and propagated upward (i.e., bottom-up cracking).
Figure 13.
Rut Depth in Lane 9 and Lane 11.
Figure 14.
Fatigue Cracking in Lane 9 and Lane 11.
Nelson et al. 12
SUMMARY
In general, increasing recycle content stiffened the mixes and could shorten the fatigue life of
recycle mixes
Among virgin asphalt binders, the softer one (PG 58-28) that is one grade lower on both the
high and low end softened the high ABR mixes and the RAS mix
Reduced temperature WMA seemed to help reduce the stiffness of the 20% ABR RAP
mixtures, but this effect was less clear at 40% ABR RAP.
AMPT fatigue performance results were in good agreement with the fatigue life ranking
estimated based on dynamic modulus master curves.
Full scale fatigue performance is being evaluated using two ALF units with 14,200 pounds of
wheel loads at 20oC after a shakedown test. As more date become available, correlation
between full scale performance and laboratory performance can be made to provide realistic
boundaries for high-RAP & RAS mixtures employing WMA technologies.
REFERENCES
1. Nelson Gibson and Alicia Sindlinger,“Pushing the Limits of Pavement,” Public Roads, US
DOT, Federal Highway Administration, Washington, DC, March/April 2014.
2. Nelson Gibson, Xicheng Qi, Aroon Shenoy, Ghazi Al-Khateeb, M. Emin Kutay, Adrian
Adriescu, Kevin Stuart, Jack Youtcheff, and Thomas Harman, “Performance Testing for
Superpave Structural Validation,” Technical Report FHWA-HRT-11-045, U.S. Department
of Transportation, Federal Highway Administration, Office of Infrastructure Research and
Development, Washington, DC, November 2012.
3. AASHTO T 168, Standard Method of Test for Sampling Bituminous Paving Mixtures,
American Association of State Highway and Transportation Officials, AASHTO,
Washington, DC, 2003.
4. AASHTO T 319-08, Standard Method of Test for Quantitative Extraction and Recovery of
Asphalt Binder from Asphalt Mixtures, American Association of State Highway and
Transportation Officials, AASHTO, Washington, DC, 2008.
5. Athar Saeed and Jim W. Hall, Jr., “Accelerated Pavement Testing: Data Guidelines,”
Transportation Research Board, National Cooperative Highway Research Program Report
512, Washington, DC, 2003.