Principles of macroeconomics (canadian edition)
Bạn đang xem bản rút gọn của tài liệu. Xem và tải ngay bản đầy đủ của tài liệu tại đây (989.02 KB, 199 trang )
The 2009-2014 World
Outlook for Advertising for
Social Media Web Sites
by
Professor Philip M. Parker, Ph.D.
Chaired Professor of Management Science
INSEAD (Singapore and Fontainebleau, France)
The 2009-2014 World Outlook
for Advertising for Social
Media Web Sites
By
Philip M. Parker, Ph.D.
Chaired Professor of Management Science
INSEAD (Singapore and Fontainebleau, France)
www.icongrouponline.com
© 2008 Icon Group International, Inc.
ii
COPYRIGHT NOTICE
ISBN 0-497-83780-3
All of Icon Group International, Inc. publications are copyrighted. Copying our
publications in whole or in part, for whatever reason, is a violation of copyright laws
and can lead to penalties and fines.
Should you want to copy tables, graphs or other materials from our publications,
please contact us to request permission. Icon Group International, Inc. often grants
permission for very limited reproduction of our publications for internal use, press
releases, and academic research. Such reproduction requires, however, confirmed
permission from Icon Group International, Inc. Please read the full copyright notice,
disclaimer, and user agreement provisions at the end of this report.
IMPORTANT DISCLAIMER
Neither Icon Group International, Inc. nor its employees or the author of this report
can be held accountable for the use and subsequent actions of the user of the
information provided in this publication. Great efforts have been made to ensure the
accuracy of the data, but we can not guarantee, given the volume of information,
accuracy. Since the information given in this report is forward-looking, the reader
should read the disclaimer statement and user agreement provisions at the end of
this report.
www.icongrouponline.com
© 2008 Icon Group International, Inc.
iii
About the Author
Dr. Philip M. Parker is the Eli Lilly Chaired Professor of Innovation, Business and Society at INSEAD where he has
taught courses on global competitive strategy since 1988. He has also taught courses at MIT, Stanford University,
Harvard University, UCLA, UCSD, and the Hong Kong University of Science and Technology. Professor Parker is
the author of six books on the economic convergence of nations. These books introduce the notion of
“physioeconomics” which foresees a lack of global convergence in economic behaviors due to physiological and
physiographic forces. His latest book is Physioeconomics: the basis for long-run economic growth (MIT Press
2000). He has also published numerous articles in academic journals, including, the Rand Journal of Economics,
Marketing Science, the Journal of International Business Studies, Technological Forecasting and Social Change, the
International Journal of Forecasting, the European Management Journal, the European Journal of Operational
Research, the Journal of Marketing, the International Journal of Research in Marketing, and the Journal of
Marketing Research. He is also on the editorial boards of several academic journals.
Dr. Parker received his Ph.D. in Business Economics from the Wharton School of the University of Pennsylvania
and has Masters degrees in Finance and Banking (University of Aix-Marseille) and Managerial Economics
(Wharton). His undergraduate degrees are in mathematics, biology, and economics (minor in aeronautical
engineering). He has consulted and/or taught courses in Africa, the Middle East, Asia, Latin America, North
America, and Europe.
About this Series
This series was created for international firms who rely on foreign markets for a substantial portion of their business
or who might be threatened by international competition. The estimates given in this report were created using a
methodology developed by and implemented under the direct supervision of Professor Philip M. Parker, the Eli Lilly
Chaired Professor of Innovation, Business and Society, at INSEAD. The methodology relies on historical figures
across countries. Reported figures should be seen as estimates of past and future levels of latent demand.
Acknowledgements
Some of the methodologies and research approaches used in this report have benefited from the R&D Committee at
INSEAD, whose research support is gratefully acknowledged.
www.icongrouponline.com
© 2008 Icon Group International, Inc.
iv
About Icon Group International, Inc.
Icon Group International, Inc.’s primary mission is to assist managers with their international information needs.
U.S.-owned and operated, Icon Group has published hundreds of multi-client databases, and global/regional market
data, industry and country publications.
Global/Regional Management Studies: Summarizing over 190 countries, management studies are generally
organized into regional volumes and cover key management functions. The human resource series covers minimum
wages, child labor, unionization and collective bargaining. The international law series covers media control and
censorship, search and seizure, and trial justice and punishment. The diversity management series covers a variety of
environmental context drivers that effect global operations. These include women’s rights, children’s rights,
discrimination/racism, and religious forces and risks. Global strategic planning studies cover economic risk
assessments, political risk assessments, foreign direct investment strategy, intellectual property strategy, and export
strategies. Financial management studies cover taxes and tariffs. Global marketing studies focus on target segments
(e.g. seniors, children, women) and strategic marketing planning.
Country Studies: Often managers need an in-depth, yet broad and up-to-date understanding of a country’s strategic
market potential and situation before the first field trip or investment proposal. There are over 190 country studies
available. Each study consists of analysis, statistics, forecasts, and information of relevance to managers. The studies
are continually updated to insure that the reports have the most relevant information available. In addition to raw
information, the reports provide relevant analyses which put a more general perspective on a country (seen in the
context of relative performance vis-à-vis benchmarks).
Industry Studies: Companies are racing to become more international, if not global in their strategies. For over 2000
product/industry categories, these reports give the reader a concise summary of latent market forecasts, pro-forma
financials, import competition profiles, contacts, key references and trends across 200 countries of the world. Some
reports focus on a particular product and region (up to four regions per product), while others focus on a product
within a particular country.
www.icongrouponline.com
© 2008 Icon Group International, Inc.
Table of Contents
1
INTRODUCTION
1.1
1.2
1.3
1.3.1
1.3.2
1.3.3
1.3.4
1.3.5
1.3.6
1.3.7
2
Step 1. Product Definition and Data Collection
Step 2. Filtering and Smoothing
Step 3. Filling in Missing Values
Step 4. Varying Parameter, Non-linear Estimation
Step 5. Fixed-Parameter Linear Estimation
Step 6. Aggregation and Benchmarking
Step 7. Latent Demand Density: Allocating Across Cities
SUMMARY OF FINDINGS
2.1
3
Overview
What is Latent Demand and the P.I.E.?
The Methodology
The Worldwide Market Potential
AFRICA
3.1
3.2
3.3
3.4
3.5
3.6
3.7
3.8
3.9
3.10
3.11
3.12
3.13
3.14
3.15
3.16
3.17
3.18
3.19
3.20
3.21
3.22
3.23
3.24
3.25
3.26
3.27
3.28
3.29
Executive Summary
Algeria
Angola
Benin
Botswana
Burkina Faso
Burundi
Cameroon
Cape Verde
Central African Republic
Chad
Comoros
Congo (formerly Zaire)
Cote d'Ivoire
Djibouti
Egypt
Equatorial Guinea
Ethiopia
Gabon
Ghana
Guinea
Guinea-Bissau
Kenya
Lesotho
Liberia
Libya
Madagascar
Malawi
Mali
www.icongrouponline.com
1
1
1
2
4
5
6
6
7
7
7
9
9
11
11
12
13
14
14
15
16
16
17
18
18
19
20
21
21
22
23
23
24
25
26
26
27
28
28
29
30
30
31
© 2008 Icon Group International, Inc.
Contents
3.30
3.31
3.32
3.33
3.34
3.35
3.36
3.37
3.38
3.39
3.40
3.41
3.42
3.43
3.44
3.45
3.46
3.47
3.48
3.49
3.50
3.51
3.52
3.53
3.54
4
Mauritania
Mauritius
Morocco
Mozambique
Namibia
Niger
Nigeria
Republic of Congo
Reunion
Rwanda
Sao Tome E Principe
Senegal
Sierra Leone
Somalia
South Africa
Sudan
Swaziland
Tanzania
The Gambia
Togo
Tunisia
Uganda
Western Sahara
Zambia
Zimbabwe
ASIA & OCEANA
4.1
4.2
4.3
4.4
4.5
4.6
4.7
4.8
4.9
4.10
4.11
4.12
4.13
4.14
4.15
4.16
4.17
4.18
Executive Summary
American Samoa
Australia
Bangladesh
Bhutan
Brunei
Burma
Cambodia
China
Christmas Island
Cook Islands
Fiji
French Polynesia
Guam
Hong Kong
India
Indonesia
Japan
www.icongrouponline.com
vi
32
32
33
34
34
35
36
37
37
38
39
39
40
41
41
42
43
43
44
45
46
47
47
48
49
50
50
51
52
53
54
54
55
56
56
57
58
58
59
60
60
61
62
63
© 2008 Icon Group International, Inc.
Contents
4.19
4.20
4.21
4.22
4.23
4.24
4.25
4.26
4.27
4.28
4.29
4.30
4.31
4.32
4.33
4.34
4.35
4.36
4.37
4.38
4.39
4.40
4.41
4.42
4.43
4.44
4.45
4.46
4.47
4.48
4.49
4.50
4.51
5
Kiribati
Laos
Macau
Malaysia
Maldives
Marshall Islands
Micronesia Federation
Mongolia
Nauru
Nepal
New Caledonia
New Zealand
Niue
Norfolk Island
North Korea
Palau
Papua New Guinea
Philippines
Seychelles
Singapore
Solomon Islands
South Korea
Sri Lanka
Taiwan
Thailand
The Northern Mariana Island
Tokelau
Tonga
Tuvalu
Vanuatu
Vietnam
Wallis and Futuna
Western Samoa
EUROPE
5.1
5.2
5.3
5.4
5.5
5.6
5.7
5.8
5.9
5.10
Executive Summary
Albania
Andorra
Austria
Belarus
Belgium
Bosnia and Herzegovina
Bulgaria
Croatia
Cyprus
www.icongrouponline.com
vii
64
64
65
66
67
67
68
69
69
70
71
71
72
73
73
74
75
75
76
77
77
78
79
79
80
81
82
82
83
84
84
85
86
87
87
88
89
90
91
92
93
94
95
95
© 2008 Icon Group International, Inc.
Contents
5.11
5.12
5.13
5.14
5.15
5.16
5.17
5.18
5.19
5.20
5.21
5.22
5.23
5.24
5.25
5.26
5.27
5.28
5.29
5.30
5.31
5.32
5.33
5.34
5.35
5.36
5.37
5.38
5.39
5.40
5.41
5.42
5.43
5.44
6
Czech Republic
Denmark
Estonia
Finland
France
Georgia
Germany
Greece
Hungary
Iceland
Ireland
Italy
Kazakhstan
Latvia
Liechtenstein
Lithuania
Luxembourg
Malta
Moldova
Monaco
Norway
Poland
Portugal
Romania
Russia
San Marino
Slovakia
Slovenia
Spain
Sweden
Switzerland
The Netherlands
The United Kingdom
Ukraine
LATIN AMERICA
6.1
6.2
6.3
6.4
6.5
6.6
6.7
6.8
6.9
Executive Summary
Argentina
Belize
Bolivia
Brazil
Chile
Colombia
Costa Rica
Ecuador
www.icongrouponline.com
viii
96
97
98
98
99
100
101
102
103
104
105
105
106
107
108
109
109
110
111
111
112
113
114
115
116
117
117
118
119
120
121
122
123
124
125
125
126
127
128
129
130
131
132
132
© 2008 Icon Group International, Inc.
Contents
6.10
6.11
6.12
6.13
6.14
6.15
6.16
6.17
6.18
6.19
6.20
6.21
6.22
6.23
7
NORTH AMERICA & THE CARIBBEAN
7.1
7.2
7.3
7.4
7.5
7.6
7.7
7.8
7.9
7.10
7.11
7.12
7.13
7.14
7.15
7.16
7.17
7.18
7.19
7.20
7.21
7.22
7.23
7.24
7.25
7.26
8
El Salvador
French Guiana
Guatemala
Guyana
Honduras
Mexico
Nicaragua
Panama
Paraguay
Peru
Suriname
The Falkland Islands
Uruguay
Venezuela
Executive Summary
Antigua and Barbuda
Aruba
Barbados
Bermuda
Canada
Cuba
Dominica
Dominican Republic
Greenland
Grenada
Guadeloupe
Haiti
Jamaica
Martinique
Puerto Rico
St. Kitts and Nevis
St. Lucia
St. Vincent and the Grenadines
The Bahamas
The British Virgin Islands
The Cayman Islands
The Netherlands Antilles
The U.S. Virgin Islands
The United States
Trinidad and Tobago
THE MIDDLE EAST
8.1
Executive Summary
www.icongrouponline.com
ix
133
134
134
135
136
137
138
138
139
140
141
141
142
143
144
144
146
146
147
148
148
149
150
151
152
153
153
154
155
155
156
157
158
158
159
160
160
161
162
163
164
165
165
© 2008 Icon Group International, Inc.
Contents
8.2
8.3
8.4
8.5
8.6
8.7
8.8
8.9
8.10
8.11
8.12
8.13
8.14
8.15
8.16
8.17
8.18
8.19
8.20
8.21
8.22
8.23
8.24
9
Afghanistan
Armenia
Azerbaijan
Bahrain
Iran
Iraq
Israel
Jordan
Kuwait
Kyrgyzstan
Lebanon
Oman
Pakistan
Palestine
Qatar
Saudi Arabia
Syrian Arab Republic
Tajikistan
The United Arab Emirates
Turkey
Turkmenistan
Uzbekistan
Yemen
166
167
168
169
170
171
172
172
173
174
174
175
176
177
177
178
179
180
180
181
182
182
183
DISCLAIMERS, WARRANTEES, AND USER AGREEMENT PROVISIONS
9.1
9.2
Disclaimers & Safe Harbor
Icon Group International, Inc. User Agreement Provisions
www.icongrouponline.com
x
185
185
186
© 2008 Icon Group International, Inc.
1
1.1
INTRODUCTION
OVERVIEW
This study covers the world outlook for advertising for social media Web sites across more than
200 countries. For each year reported, estimates are given for the latent demand, or potential
industry earnings (P.I.E.), for the country in question (in millions of U.S. dollars), the percent
share the country is of the region and of the globe. These comparative benchmarks allow the
reader to quickly gauge a country vis-à-vis others. Using econometric models which project
fundamental economic dynamics within each country and across countries, latent demand
estimates are created. This report does not discuss the specific players in the market serving the
latent demand, nor specific details at the product level. The study also does not consider shortterm cyclicalities that might affect realized sales. The study, therefore, is strategic in nature,
taking an aggregate and long-run view, irrespective of the players or products involved.
This study does not report actual sales data (which are simply unavailable, in a comparable or
consistent manner in virtually all of the 230 countries of the world). This study gives, however,
my estimates for the worldwide latent demand, or the P.I.E. for advertising for social media Web
sites. It also shows how the P.I.E. is divided across the world’s regional and national markets. For
each country, I also show my estimates of how the P.I.E. grows over time (positive or negative
growth). In order to make these estimates, a multi-stage methodology was employed that is often
taught in courses on international strategic planning at graduate schools of business.
Another reason why sales do not equate to latent demand is exchange rates. In this report, all
figures assume the long-run efficiency of currency markets. Figures, therefore, equate values
based on purchasing power parities across countries. Short-run distortions in the value of the
dollar, therefore, do not figure into the estimates. Purchasing power parity estimates of country
income were collected from official sources, and extrapolated using standard econometric
models. The report uses the dollar as the currency of comparison, but not as a measure of
transaction volume. The units used in this report are: US$ Million.
1.2
WHAT IS LATENT DEMAND AND THE P.I.E.?
The concept of latent demand is rather subtle. The term latent typically refers to something that is
dormant, not observable or not yet realized. Demand is the notion of an economic quantity that a
target population or market requires under different assumptions of price, quality, and
distribution, among other factors. Latent demand, therefore, is commonly defined by economists
as the industry earnings of a market when that market becomes accessible and attractive to serve
by competing firms. It is a measure, therefore, of potential industry earnings (P.I.E.) or total
revenues (not profit) if a market is served in an efficient manner. It is typically expressed as the
total revenues potentially extracted by firms. The “market” is defined at a given level in the value
www.icongrouponline.com
© 2008 Icon Group International, Inc.
Introduction
2
chain. There can be latent demand at the retail level, at the wholesale level, the manufacturing
level, and the raw materials level (the P.I.E. of higher levels of the value chain being always
smaller than the P.I.E. of levels at lower levels of the same value chain, assuming all levels
maintain minimum profitability).
The latent demand for advertising for social media Web sites is not actual or historic sales. Nor is
latent demand future sales. In fact, latent demand can be lower or higher than actual sales if a
market is inefficient (i.e. not representative of relatively competitive levels). Inefficiencies arise
from a number of factors, including the lack of international openness, cultural barriers to
consumption, regulations, and cartel-like behavior on the part of firms. In general, however,
latent demand is typically larger than actual sales in a country market.
For reasons discussed later, this report does not consider the notion of “unit quantities”, only total
latent revenues (i.e. a calculation of price times quantity is never made, though one is implied).
The units used in this report are U.S. dollars not adjusted for inflation (i.e. the figures incorporate
inflationary trends) and not adjusted for future dynamics in exchange rates. If inflation rates or
exchange rates vary in a substantial way compared to recent experience, actually sales can also
exceed latent demand (when expressed in U.S. dollars, not adjusted for inflation). On the other
hand, latent demand can be typically higher than actual sales as there are often distribution
inefficiencies that reduce actual sales below the level of latent demand.
As mentioned in the introduction, this study is strategic in nature, taking an aggregate and longrun view, irrespective of the players or products involved. If fact, all the current products or
services on the market can cease to exist in their present form (i.e. at a brand-, R&D specification,
or corporate-image level) and all the players can be replaced by other firms (i.e. via exits, entries,
mergers, bankruptcies, etc.), and there will still be an international latent demand for advertising
for social media Web sites at the aggregate level. Product and service offering details, and the
actual identity of the players involved, while important for certain issues, are relatively
unimportant for estimates of latent demand.
1.3
THE METHODOLOGY
In order to estimate the latent demand for advertising for social media Web sites on a worldwide
basis, I used a multi-stage approach. Before applying the approach, one needs a basic theory from
which such estimates are created. In this case, I heavily rely on the use of certain basic economic
assumptions. In particular, there is an assumption governing the shape and type of aggregate
latent demand functions. Latent demand functions relate the income of a country, city, state,
household, or individual to realized consumption. Latent demand (often realized as consumption
when an industry is efficient), at any level of the value chain, takes place if an equilibrium is
realized. For firms to serve a market, they must perceive a latent demand and be able to serve that
demand at a minimal return. The single most important variable determining consumption,
assuming latent demand exists, is income (or other financial resources at higher levels of the
www.icongrouponline.com
© 2008 Icon Group International, Inc.
Introduction
3
value chain). Other factors that can pivot or shape demand curves include external or exogenous
shocks (i.e. business cycles), and or changes in utility for the product in question.
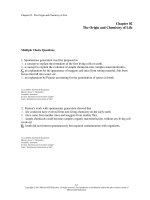
Ignoring, for the moment, exogenous shocks and variations in utility across countries, the
aggregate relation between income and consumption has been a central theme in economics. The
figure below concisely summarizes one aspect of problem. In the 1930s, John Meynard Keynes
conjectured that as incomes rise, the average propensity to consume would fall. The average
propensity to consume is the level of consumption divided by the level of income, or the slope of
the line from the origin to the consumption function. He estimated this relationship empirically
and found it to be true in the short-run (mostly based on cross-sectional data). The higher the
income, the lower the average propensity to consume. This type of consumption function is
labeled "A" in the figure below (note the rather flat slope of the curve). In the 1940s, another
macroeconomist, Simon Kuznets, estimated long-run consumption functions which indicated that
the marginal propensity to consume was rather constant (using time series data across countries).
This type of consumption function is show as "B" in the figure below (note the higher slope and
zero-zero intercept).1 The average propensity to consume is constant.
Latent
Demand
B
A
Income
Is it declining or is it constant? A number of other economists, notably Franco Modigliani and
Milton Friedman, in the 1950s (and Irving Fisher earlier), explained why the two functions were
different using various assumptions on intertemporal budget constraints, savings, and wealth. The
shorter the time horizon, the more consumption can depend on wealth (earned in previous years)
1
For a general overview of this subject area, see Principles of Macroeconomics by N. Gregory Mankiw, SouthWestern College Publishing; ISBN: 0030340594; 2nd edition (February 2002).
www.icongrouponline.com
© 2008 Icon Group International, Inc.
Introduction
4
and business cycles. In the long-run, however, the propensity to consume is more constant.
Similarly, in the long run, households, industries or countries with no income eventually have no
consumption (wealth is depleted). While the debate surrounding beliefs about how income and
consumption are related and interesting, in this study a very particular school of thought is
adopted. In particular, we are considering the latent demand for advertising for social media Web
sites across some 230 countries. The smallest have fewer than 10,000 inhabitants. I assume that
all of these counties fall along a "long-run" aggregate consumption function. This long-run
function applies despite some of these countries having wealth, current income dominates the
latent demand for advertising for social media Web sites. So, latent demand in the long-run has a
zero intercept. However, I allow firms to have different propensities to consume (including being
on consumption functions with differing slopes, which can account for differences in industrial
organization, and end-user preferences).
Given this overriding philosophy, I will now describe the methodology used to create the latent
demand estimates for advertising for social media Web sites. Since ICON Group has asked me to
apply this methodology to a large number of categories, the rather academic discussion below is
general and can be applied to a wide variety of categories, not just advertising for social media
Web sites.
1.3.1
Step 1. Product Definition and Data Collection
Any study of latent demand across countries requires that some standard be established to define
“efficiently served”. Having implemented various alternatives and matched these with market
outcomes, I have found that the optimal approach is to assume that certain key countries are more
likely to be at or near efficiency than others. These countries are given greater weight than others
in the estimation of latent demand compared to other countries for which no known data are
available. Of the many alternatives, I have found the assumption that the world’s highest
aggregate income and highest income-per-capita markets reflect the best standards for
“efficiency”. High aggregate income alone is not sufficient (i.e. China has high aggregate income,
but low income per capita and can not assumed to be efficient). Aggregate income can be
operationalized in a number of ways, including gross domestic product (for industrial categories),
or total disposable income (for household categories; population times average income per capita,
or number of households times average household income per capita). Brunei, Nauru, Kuwait,
and Lichtenstein are examples of countries with high income per capita, but not assumed to be
efficient, given low aggregate level of income (or gross domestic product); these countries have,
however, high incomes per capita but may not benefit from the efficiencies derived from
economies of scale associated with larger economies. Only countries with high income per capita
and large aggregate income are assumed efficient. This greatly restricts the pool of countries to
those in the OECD (Organization for Economic Cooperation and Development), like the United
States, or the United Kingdom (which were earlier than other large OECD economies to liberalize
their markets).
www.icongrouponline.com
© 2008 Icon Group International, Inc.
Introduction
5
The selection of countries is further reduced by the fact that not all countries in the OECD report
industry revenues at the category level. Countries that typically have ample data at the aggregate
level that meet the efficiency criteria include the United States, the United Kingdom and in some
cases France and Germany.
Latent demand is therefore estimated using data collected for relatively efficient markets from
independent data sources (e.g. Euromonitor, Mintel, Thomson Financial Services, the U.S.
Industrial Outlook, the World Resources Institute, the Organization for Economic Cooperation
and Development, various agencies from the United Nations, industry trade associations, the
International Monetary Fund, and the World Bank). Depending on original data sources used, the
definition of “advertising for social media Web sites” is established. In the case of this report, the
data were reported at the aggregate level, with no further breakdown or definition. In other words,
any potential product or service that might be incorporated within advertising for social media
Web sites falls under this category. Public sources rarely report data at the disaggregated level in
order to protect private information from individual firms that might dominate a specific productmarket. These sources will therefore aggregate across components of a category and report only
the aggregate to the public. While private data are certainly available, this report only relies on
public data at the aggregate level without reliance on the summation of various category
components. In other words, this report does not aggregate a number of components to arrive at
the “whole”. Rather, it starts with the “whole”, and estimates the whole for all countries and the
world at large (without needing to know the specific parts that went into the whole in the first
place).
Given this caveat, in this report we define the sales of advertising for social media Web sites as
including all commonly understood services falling within this broad category, such as
advertising for online communities of people who share interests and activities, or who are
interested in exploring the interests and activities of others. Companies participating in this
industry include Facebook, Hi5, Myspace, Bebo, and LinkedIn. In addition to the sources
indicated below, additional information available to the public via news and/or press releases
published by players in the industry (including reports from AMR Research, Global Industry
Analysts, Forrester Research, Frost & Sullivan, Gartner, IDC, and MarketResearch.com) was
considered in defining and calibrating this category.
1.3.2
Step 2. Filtering and Smoothing
Based on the aggregate view of advertising for social media Web sites as defined above, data
were then collected for as many similar countries as possible for that same definition, at the same
level of the value chain. This generates a convenience sample of countries from which
comparable figures are available. If the series in question do not reflect the same accounting
period, then adjustments are made. In order to eliminate short-term effects of business cycles, the
series are smoothed using an 2 year moving average weighting scheme (longer weighting
schemes do not substantially change the results). If data are available for a country, but these
reflect short-run aberrations due to exogenous shocks (such as would be the case of beef sales in a
www.icongrouponline.com
© 2008 Icon Group International, Inc.
Introduction
6
country stricken with foot and mouth disease), these observations were dropped or "filtered" from
the analysis.
1.3.3
Step 3. Filling in Missing Values
In some cases, data are available for countries on a sporadic basis. In other cases, data from a
country may be available for only one year. From a Bayesian perspective, these observations
should be given greatest weight in estimating missing years. Assuming that other factors are held
constant, the missing years are extrapolated using changes and growth in aggregate national
income. Based on the overriding philosophy of a long-run consumption function (defined earlier),
countries which have missing data for any given year, are estimated based on historical dynamics
of aggregate income for that country.2
1.3.4
Step 4. Varying Parameter, Non-linear Estimation
Given the data available from the first three steps, the latent demand in additional countries is
estimated using a “varying-parameter cross-sectionally pooled time series model”.3 Simply
stated, the effect of income on latent demand is assumed to be constant across countries unless
there is empirical evidence to suggest that this effect varies (i.e. . the slope of the income effect is
not necessarily same for all countries). This assumption applies across countries along the
aggregate consumption function, but also over time (i.e. not all countries are perceived to have
the same income growth prospects over time and this effect can vary from country to country as
well). Another way of looking at this is to say that latent demand for advertising for social media
Web sites is more likely to be similar across countries that have similar characteristics in terms of
economic development (i.e. African countries will have similar latent demand structures
controlling for the income variation across the pool of African countries).
This approach is useful across countries for which some notion of non-linearity exists in the
aggregate cross-country consumption function. For some categories, however, the reader must
realize that the numbers will reflect a country’s contribution to global latent demand and may
never be realized in the form of local sales. For certain country-category combinations this will
2
This report was prepared from a variety of sources including excerpts from documents and official reports or
databases published by the World Bank, the U.S. Department of Commerce, the U.S. State Department, various
national agencies, the International Monetary Fund, the Central Intelligence Agency, various agencies from the
United Nations (e.g. ILO, ITU, UNDP, etc.), and non-governmental sources, including Icon Group International,
Inc., Euromonitor, the World Resources Institute, Mintel, the U.S. Industrial Outlook, and various public sources
cited in the trade press.
3
The interested reader can find longer discussions of this type of modeling in Studies in Global Econometrics
(Advanced Studies in Theoretical and Applied Econometrics V. 30), by Henri Theil, et al., Kluwer Academic
Publishers; ISBN: 0792336607; (June 1996), and in Principles of Econometrics, by Henri Theil John Wiley & Sons;
ISBN: 0471858455; (December 1971), and in Econometric Models and Economic Forecasts by Robert S. Pindyck,
Daniel L. Rubinfeld McGraw Hill Text; ISBN: 0070500983; 3rd edition (December 1991).
www.icongrouponline.com
© 2008 Icon Group International, Inc.
Introduction
7
result in what at first glance will be odd results. For example, the latent demand for the category
“space vehicles” will exist for “Togo” even though they have no space program. The assumption
is that if the economies in these countries did not exist, the world aggregate for these categories
would be lower. The share attributed to these countries is based on a proportion of their income
(however small) being used to consume the category in question (i.e. perhaps via resellers).
1.3.5
Step 5. Fixed-Parameter Linear Estimation
Nonlinearities are assumed in cases where filtered data exist along the aggregate consumption
function. Because the world consists of more than 200 countries, there will always be those
countries, especially toward the bottom of the consumption function, where non-linear estimation
is simply not possible. For these countries, equilibrium latent demand is assumed to be perfectly
parametric and not a function of wealth (i.e. a country’s stock of income), but a function of
current income (a country’s flow of income). In the long run, if a country has no current income,
the latent demand for advertising for social media Web sites is assumed to approach zero. The
assumption is that wealth stocks fall rapidly to zero if flow income falls to zero (i.e. countries
which earn low levels of income will not use their savings, in the long run, to demand advertising
for social media Web sites). In a graphical sense, for low income countries, latent demand
approaches zero in a parametric linear fashion with a zero-zero intercept. In this stage of the
estimation procedure, low-income countries are assumed to have a latent demand proportional to
their income, based on the country closest to it on the aggregate consumption function.
1.3.6
Step 6. Aggregation and Benchmarking
Based on the models described above, latent demand figures are estimated for all countries of the
world, including for the smallest economies. These are then aggregated to get world totals and
regional totals. To make the numbers more meaningful, regional and global demand averages are
presented. Figures are rounded, so minor inconsistencies may exist across tables.
1.3.7
Step 7. Latent Demand Density: Allocating Across Cities
With the advent of a “borderless world”, cities become a more important criteria in prioritizing
markets, as opposed to regions, continents, or countries. This report also covers the world’s top
2000 cities. The purpose is to understand the density of demand within a country and the extent
to which a city might be used as a point of distribution within its region. From an economic
perspective, however, a city does not represent a population within rigid geographical boundaries.
To an economist or strategic planner, a city represents an area of dominant influence over
markets in adjacent areas. This influence varies from one industry to another, but also from one
period of time to another.
www.icongrouponline.com
© 2008 Icon Group International, Inc.
Introduction
8
Similar to country-level data, the reader needs to realize that latent demand allocated to a city
may or may not represent real sales. For many items, latent demand is clearly observable in sales,
as in the case for food or housing items. Consider, again, the category “satellite launch vehicles.”
Clearly, there are no launch pads in most cities of the world. However, the core benefit of the
vehicles (e.g. telecommunications, etc.) is "consumed" by residents or industries within the
world's cities. Without certain cities, in other words, the world market for satellite launch vehicles
would be lower for the world in general. One needs to allocate, therefore, a portion of the
worldwide economic demand for launch vehicles to regions, countries and cities. This report
takes the broader definition and considers, therefore, a city as a part of the global market. I
allocate latent demand across areas of dominant influence based on the relative economic
importance of cities within its home country, within its region and across the world total. Not all
cities are estimated within each country as demand may be allocated to adjacent areas of
influence. Since some cities have higher economic wealth than others within the same country, a
city’s population is not generally used to allocate latent demand. Rather, the level of economic
activity of the city vis-à-vis others.
www.icongrouponline.com
© 2008 Icon Group International, Inc.
9
2
SUMMARY OF FINDINGS
Based on the methodology described above, the latent demand for advertising for social media
Web sites is estimated to be $12.3 billion in 2009. The distribution of the world latent demand (or
potential industry earnings), however, is not be evenly distributed across regions. North America
& the Caribbean is the largest market with $3.4 billion or 27.62 percent, followed by Asia &
Oceana with $3.8 billion or 30.58 percent, and then Europe with $3.1 billion or 25.32 percent of
the world market. In essence, if firms target these top 3 regions, they cover come 83.52 percent of
the global latent demand for advertising for social media Web sites.
2.1
THE WORLDWIDE MARKET POTENTIAL
Worldwide Market Potential for Advertising for Social Media Web Sites (US$
Million): 2009
Region
Latent Demand US$ Million
% of Globe
3,771
3,406
3,123
959
600
475
12,334
30.6
27.6
25.3
7.8
4.9
3.9
100.0
_________________________________________________________________________________________________________
Asia & Oceana
North America & the Caribbean
Europe
Latin America
Middle East
Africa
Total
_________________________________________________________________________________________________________
Source: Philip M. Parker, INSEAD, copyright 2008, www.icongrouponline.com
Worldwide Market Potential for Advertising for Social Media Web Sites (US$
Million): 2009
Europe
North America & the
Caribbean
Latin America
Other
Asia & Oceana
www.icongrouponline.com
© 2008 Icon Group International, Inc.
Summary of Findings
10
World Market for Advertising for Social Media Web Sites: 2004 - 2014
Year
World Market US$ Million
2004
2005
2006
2007
2008
2009
2010
2011
2012
2013
2014
3,825.75
4,153.99
4,511.91
5,316.66
8,638.15
12,333.79
15,740.19
18,961.82
21,938.41
23,991.27
26,035.64
_________________________________________________________________________________________________________
_________________________________________________________________________________________________________
Source: Philip M. Parker, INSEAD, copyright 2008, www.icongrouponline.com
www.icongrouponline.com
© 2008 Icon Group International, Inc.
11
3
AFRICA
3.1
EXECUTIVE SUMMARY
Market Potential for Advertising for Social Media Web Sites in Africa (US$
Million): 2009
Country
Latent Demand US$ Million
% of Africa
85.15
79.33
53.96
48.89
22.86
20.24
15.33
14.37
14.12
10.55
10.22
7.98
7.23
5.91
5.75
5.71
4.82
4.39
3.75
3.65
3.65
3.50
3.28
3.18
2.91
33.79
474.53
17.94%
16.72%
11.37%
10.30%
4.82%
4.27%
3.23%
3.03%
2.98%
2.22%
2.15%
1.68%
1.52%
1.24%
1.21%
1.20%
1.02%
0.93%
0.79%
0.77%
0.77%
0.74%
0.69%
0.67%
0.61%
7.12%
100.00%
_________________________________________________________________________________________________________
South Africa
Egypt
Nigeria
Algeria
Morocco
Sudan
Angola
Libya
Tunisia
Kenya
Ethiopia
Tanzania
Cameroon
Cote d'Ivoire
Uganda
Ghana
Equatorial Guinea
Botswana
Senegal
Madagascar
Gabon
Congo (formerly Zaire)
Mozambique
Burkina Faso
Zambia
Other
Total
_________________________________________________________________________________________________________
Source: Philip M. Parker, INSEAD, copyright 2008, www.icongrouponline.com
www.icongrouponline.com
© 2008 Icon Group International, Inc.
Africa
12
Market Potential for Advertising for Social Media Web Sites in Africa (US$
Million): 2009
Nigeria
Algeria
Egypt
Other
South Africa
The Market for Advertising for Social Media Web Sites in Africa: 2004 - 2014
Year
US$ Million
% of Globe
171.01
185.87
202.07
233.40
348.13
474.53
586.67
689.92
784.77
853.94
923.57
4.47
4.47
4.48
4.39
4.03
3.85
3.73
3.64
3.58
3.56
3.55
_________________________________________________________________________________________________________
2004
2005
2006
2007
2008
2009
2010
2011
2012
2013
2014
_________________________________________________________________________________________________________
Source: Philip M. Parker, INSEAD, copyright 2008, www.icongrouponline.com
3.2
ALGERIA
Advertising for Social Media Web Sites (US$ Million): Algeria 2004 - 2014
Year
Algeria
% of Region
% of Globe
2004
2005
2006
2007
2008
2009
2010
2011
2012
2013
2014
18.36
19.81
21.37
24.45
36.09
48.89
60.07
70.16
79.24
85.56
91.81
10.74%
10.66%
10.57%
10.48%
10.37%
10.30%
10.24%
10.17%
10.10%
10.02%
9.94%
0.48%
0.48%
0.47%
0.46%
0.42%
0.40%
0.38%
0.37%
0.36%
0.36%
0.35%
_________________________________________________________________________________________________________
_________________________________________________________________________________________________________
Source: Philip M. Parker, INSEAD, copyright 2008, www.icongrouponline.com
www.icongrouponline.com
© 2008 Icon Group International, Inc.
Africa
13
Algeria: Advertising for Social Media Web Sites in 2009, US$ Million
City
World Rank
US $ mln
%Country
%Region
%World
144
270
372
490
719
744
746
793
863
864
871
916
952
17.68
7.38
5.17
3.59
2.14
2.01
1.99
1.80
1.53
1.51
1.49
1.35
1.26
48.89
36.17
15.09
10.58
7.34
4.37
4.10
4.08
3.67
3.12
3.10
3.05
2.76
2.57
100.00
3.73
1.56
1.09
0.76
0.45
0.42
0.42
0.38
0.32
0.32
0.31
0.28
0.26
10.30
0.14
0.06
0.04
0.03
0.02
0.02
0.02
0.01
0.01
0.01
0.01
0.01
0.01
0.40
_________________________________________________________________________________________________________
Algiers
Oran
Constantine
Annaba
Batna
Blida
Setif
Sidi-Bel-Abbes
Ech-Cheliff
Skikda
Tlemcen
Bejaia
Bechar
Total
_________________________________________________________________________________________________________
Source: Philip M. Parker, INSEAD, copyright 2008, www.icongrouponline.com
3.3
ANGOLA
Advertising for Social Media Web Sites (US$ Million): Angola 2004 - 2014
Year
Angola
% of Region
% of Globe
2004
2005
2006
2007
2008
2009
2010
2011
2012
2013
2014
4.28
4.89
5.59
6.83
10.86
15.33
19.62
23.92
28.25
31.97
35.96
2.50%
2.63%
2.76%
2.93%
3.12%
3.23%
3.34%
3.47%
3.60%
3.74%
3.89%
0.11%
0.12%
0.12%
0.13%
0.13%
0.12%
0.12%
0.13%
0.13%
0.13%
0.14%
_________________________________________________________________________________________________________
_________________________________________________________________________________________________________
Source: Philip M. Parker, INSEAD, copyright 2008, www.icongrouponline.com
Angola: Advertising for Social Media Web Sites in 2009, US$ Million
City
World Rank
US $ mln
%Country
%Region
%World
194
1,106
1,136
1,352
1,362
1,482
1,558
12.03
0.87
0.82
0.51
0.49
0.34
0.26
15.33
78.48
5.65
5.38
3.34
3.23
2.21
1.72
100.00
2.54
0.18
0.17
0.11
0.10
0.07
0.06
3.23
0.10
0.01
0.01
0.00
0.00
0.00
0.00
0.12
_________________________________________________________________________________________________________
Luanda
Lubango
Namibe
Huambo
Lobito
Benguela
Malanje
Total
_________________________________________________________________________________________________________
Source: Philip M. Parker, INSEAD, copyright 2008, www.icongrouponline.com
www.icongrouponline.com
© 2008 Icon Group International, Inc.
Africa
3.4
14
BENIN
Advertising for Social Media Web Sites (US$ Million): Benin 2004 - 2014
Year
Benin
% of Region
% of Globe
2004
2005
2006
2007
2008
2009
2010
2011
2012
2013
2014
0.83
0.90
0.97
1.11
1.63
2.21
2.72
3.17
3.58
3.87
4.15
0.49%
0.48%
0.48%
0.47%
0.47%
0.47%
0.46%
0.46%
0.46%
0.45%
0.45%
0.02%
0.02%
0.02%
0.02%
0.02%
0.02%
0.02%
0.02%
0.02%
0.02%
0.02%
_________________________________________________________________________________________________________
_________________________________________________________________________________________________________
Source: Philip M. Parker, INSEAD, copyright 2008, www.icongrouponline.com
Benin: Advertising for Social Media Web Sites in 2009, US$ Million
City
World Rank
US $ mln
%Country
%Region
%World
958
1,334
1,678
1,720
1,731
1.24
0.53
0.17
0.14
0.13
2.21
56.24
24.02
7.62
6.24
5.89
100.00
0.26
0.11
0.04
0.03
0.03
0.47
0.01
0.00
0.00
0.00
0.00
0.02
_________________________________________________________________________________________________________
Cotonou
Porto-Novo
Parakou
Abomey
Natitingou
Total
_________________________________________________________________________________________________________
Source: Philip M. Parker, INSEAD, copyright 2008, www.icongrouponline.com
3.5
BOTSWANA
Advertising for Social Media Web Sites (US$ Million): Botswana 2004 - 2014
Year
Botswana
% of Region
% of Globe
2004
2005
2006
2007
2008
2009
2010
2011
2012
2013
2014
1.64
1.77
1.92
2.19
3.24
4.39
5.40
6.31
7.13
7.70
8.26
0.96%
0.95%
0.95%
0.94%
0.93%
0.93%
0.92%
0.91%
0.91%
0.90%
0.89%
0.04%
0.04%
0.04%
0.04%
0.04%
0.04%
0.03%
0.03%
0.03%
0.03%
0.03%
_________________________________________________________________________________________________________
_________________________________________________________________________________________________________
Source: Philip M. Parker, INSEAD, copyright 2008, www.icongrouponline.com
www.icongrouponline.com
© 2008 Icon Group International, Inc.