The political economy of world mass migration comparing two global centuries
Bạn đang xem bản rút gọn của tài liệu. Xem và tải ngay bản đầy đủ của tài liệu tại đây (284.06 KB, 69 trang )
The Political Economy of
World Mass Migration
THE HENRY WENDT LECTURE SERIES
The Henry Wendt Lecture is delivered annually at the American
Enterprise Institute by a scholar who has made major contributions
to our understanding of the modern phenomenon of globalization
and its consequences for social welfare, government policy, and
the expansion of liberal political institutions. The lecture series is
part of AEI’s Wendt Program in Global Political Economy, established through the generosity of the SmithKline Beecham pharmaceutical company (now GlaxoSmithKline) and Mr. Henry Wendt,
former chairman and chief executive officer of SmithKline Beecham
and trustee emeritus of AEI.
GROWTH AND INTERACTION IN THE WORLD ECONOMY:
THE ROOTS OF MODERNITY
Angus Maddison, 2001
IN DEFENSE OF EMPIRES
Deepak Lal, 2002
THE POLITICAL ECONOMY OF WORLD MASS MIGRATION:
COMPARING TWO GLOBAL CENTURIES
Jeffrey G. Williamson, 2004
The Political Economy of
World Mass Migration
Comparing Two Global Centuries
Jeffrey G. Williamson
The AEI Press
Publisher for the American Enterprise Institute
WASHINGTON, D.C.
Available in the United States from the AEI Press, c/o Client Distribution
Services, 193 Edwards Drive, Jackson, TN 38301. To order, call toll free:
1-800-343-4499. Distributed outside the United States by arrangement
with Eurospan, 3 Henrietta Street, London WC2E 8LU, England.
Library of Congress Cataloging-in-Publication Data
Williamson, Jeffrey G.
The political economy of world mass migration / Jeffrey G. Williamson.
p. cm.
Includes bibliographical references and index.
ISBN 0-8447-7181-3 (alk. paper)
1. Alien labor—Economic aspects. 2. Emigration and immigration—
Government policy. 3. Globalization. I. Title.
HD6300.W55 2004
331.6'2--dc22
10 09 08 07 06 05 04
2004019234
1 2 3 4 5
© 2005 by the American Enterprise Institute for Public Policy Research,
Washington, D.C. All rights reserved. No part of this publication may be
used or reproduced in any manner whatsoever without permission in
writing from the American Enterprise Institute except in the case of brief
quotations embodied in news articles, critical articles, or reviews. The
views expressed in the publications of the American Enterprise Institute
are those of the authors and do not necessarily reflect the views of the
staff, advisory panels, officers, or trustees of AEI.
Printed in the United States of America
Contents
LIST OF ILLUSTRATIONS
vi
ACKNOWLEDGMENTS
vii
THE POLITICAL ECONOMY OF WORLD MASS MIGRATION
1
Immigrants during Two Global Centuries:
Rising Quantity and Falling Quality 1
A Framework 8
Looking at Local Labor Markets 11
Immigration Shocks and Labor Market
Absorption: Two Modern Examples 19
Immigrants, Wages, and Inequality: The Global
Centuries Compared 23
Policy and the Demise of Mass Migration in the
First Global Century 25
Population and Labor Force Impact of the
Quotas 33
Did the Absence of Immigrants Contribute to
the Great Income Leveling in America? 36
Explaining Immigration Policy before the 1930s:
Political Debate and Backlash 43
Summing Up 48
NOTES
51
REFERENCES
53
ABOUT THE AUTHOR
59
v
Illustrations
TABLES
1 The Migrant Stock around the World, 1965–2000 3
2 Source-Area Composition of U.S. Immigrants,
1951–2000 4
3 Education of Those Staying in the Sending Country
and Its Emigrants in Host Countries, c. 1990 7
4 Estimated Effects of Immigration on Wages and
Employment of Natives 12–13
5 Net U.S. Immigration by Region of Origin,
1910–1939 28
6 U.S. Labor Force Growth, 1910–1940: Some
Counterfactuals 35
FIGURES
1 The Economic Effects of Immigration 10
2 Immigration to Israel, 1980–2000 20
3 Labor Supply and the Real Wage in Israel,
1980–2000 21
4 Emigration from Europe, 1871–1939 27
5 Immigration into Chief New World Destinations,
1881–1939 27
6 Initial Labor Scarcity and Distribution Trends in the
Greater Atlantic Economy, 1870–1913 39
7 Initial Labor Scarcity and Distribution Trends in the
Greater Atlantic Economy, 1921–1938 39
8 Labor Supply and the Skill Premium in the United
States, 1820–1973 40
9 American Inequality Trends, 1890–1965 41
vi
Acknowledgments
This lecture draws heavily on recent collaborative work with
Timothy J. Hatton, especially on our joint forthcoming book,
World Mass Migration: Two Centuries of Policy and Performance. I also
acknowledge with pleasure financial support from the National
Science Foundation SES-0001362, and the work environment at
the University of Wisconsin Economics Department, where this
was written while I was on leave from Harvard.
vii
The Political Economy of
World Mass Migration
Jeffrey G. Williamson
Immigrants during Two Global Centuries:
Rising Quantity and Falling Quality
The first global century took place between about 1820 and World
War I, characterized by falling barriers to trade and to the flows of
labor and capital. All three boomed. Since about 1950, the second
global century has tried to reintegrate these three markets in the
wake of the interwar autarchic retreat. This paper is about the political economy of immigration in both global centuries.
Annual immigration to North America and Oceania rose gradually to the mid-1970s before surging to a million per year in the
1990s. The absolute numbers by then were similar to those reached
during the age of mass migration about a century earlier, but they
were smaller relative to the destination country populations that had
to absorb them. The U.S. annual immigration rate fell from 11.6
immigrants per thousand in the 1900s to 0.4 immigrant per thousand in the 1940s, before rising again to 4 immigrants per thousand
in the 1990s. The proportion of the U.S. population born in a foreign
land had fallen from a 1910 peak of 15 percent to an all-century low
of 4.7 percent in 1970. The postwar immigration boom increased the
foreign-born share to more than 8 percent in 1990 and more than 10
percent in 2000. Thus, the United States has come two-thirds of
the way back to reclaiming the title “a nation of immigrants” after a
1
2 THE POLITICAL ECONOMY OF WORLD MASS MIGRATION
half-century retreat. While the immigration rate is now only a third
that achieved at its peak in the first decade of the twentieth century,
the contribution of immigration to population and labor force growth
is similar, because the rate of natural increase has also declined.
What happened to the United States after World War II also
happened worldwide. Table 1 reports trends in the foreign born
around the world over the thirty-five years since the mid-1960s.
The data are based on country censuses, sources that are likely to
be of higher quality than those that report annual immigrant flows,
and they deal with unambiguous net permanent moves. The most
revealing entries appear in the last three rows of the table. There
we see that the foreign-born share in the total population increased
by about one third in Oceania between 1965 and 2000 (from 14.4
to 19.1 percent), more than doubled in North America (from 6 to
13 percent), and more than tripled in Europe (from 2.2 to 7.7 percent). North America is defined to exclude emigrating Mexico, so in
this case we are talking exclusively about a high-wage immigrantabsorbing region. The same is not true of Europe, since it is defined
to include Eastern Europe and the former Soviet Union, two net emigrating regions and, increasingly, a significant source of migrants for
the European Union (EU). The foreign-born share in Western Europe
rose much more dramatically than it did for Europe as a whole.
While the Organisation for Economic Co-operation and Development (OECD) immigration has surged, the labor market quality of
these immigrants has declined. For example, U.S. immigrant men
earned 4.1 percent more than native-born men in 1960, but they
earned 16.3 percent less in 1990 (Borjas 1999, 1724). Some of this
was due to the decline in immigrant educational attainment, but
when we control for this effect, the adjusted relative wage still fell by
13.3 percent over these thirty years. Recent immigrants always suffer
an earnings disadvantage before they assimilate, and that was even
true in 1960. But their initial wage relative to the native born deteriorated by 24 percentage points over those thirty years.
Most of this decline in immigrant “quality” is due to changes
in the source-area composition of U.S. immigrants (table 2). The current debate over the impact of shifting immigrant source on the labor
JEFFREY G. WILLIAMSON 3
TABLE 1
THE MIGRANT STOCK AROUND THE WORLD, 1965–2000
Year
1965
1975
1985
1990a 1990b
2000
75.2
8.0
31.4
5.9
84.5
11.2
29.7
5.9
105.2
12.5
38.7
6.4
119.8
15.6
43.0
7.5
154.0
16.2
50.0
7.1
174.9
16.3
50.0
5.9
12.7
14.7
2.5
15.0
19.5
3.3
20.5
23.0
4.1
23.9
25.1
4.6
27.6
48.4
4.8
40.8
56.1
5.8
Migrant Stock (millions)
World
Africa
Asia
Latin America/
Caribbean
North America
Europe
Oceania
Percentage of World Migrant Stock
World
Africa
Asia
Latin America/
Caribbean
North America
Europe
Oceania
100.0
10.6
41.8
7.9
100.0
13.2
35.1
6.8
100.0
11.9
36.8
6.1
100.0
13.1
35.9
6.2
100.0
10.5
32.4
4.6
100.0
9.3
28.6
3.4
16.9
19.6
3.3
17.8
23.1
3.9
19.5
21.8
3.9
20.0
20.9
3.9
17.9
31.4
3.1
23.3
32.1
3.3
Migrant Stock as a Percentage of Population
World
Africa
Asia
Latin America/
Caribbean
North America
Europe
Oceania
2.3
2.5
1.7
2.4
2.1
2.7
1.3
1.8
2.2
2.3
1.4
1.6
2.3
2.5
1.4
1.7
2.9
2.6
1.6
1.6
2.9
2.1
1.4
1.1
6.0
2.2
14.4
6.3
2.7
15.6
7.8
3.0
16.9
8.6
3.2
17.8
9.8
6.7
18.0
13.0
7.7
19.1
SOURCE: Hatton and Williamson 2004, table 10.1.
NOTE: There are differences of definition in the figures for 1965–1990a and 1990b–2000,
mainly involving the breakup of the Soviet Union.
4 THE POLITICAL ECONOMY OF WORLD MASS MIGRATION
TABLE 2
SOURCE-AREA COMPOSITION OF U.S. IMMIGRANTS, 1951–2000
(percent of total)
Region of Origin
Europe
West
East
Asia
Americas
Canada
Mexico
Caribbean
Central America
South America
Africa
Oceania
Total (thousands)
1951–60 1961–70 1971–80 1981–90 1991–2000
52.7
47.1
5.6
6.1
39.6
15.0
11.9
4.9
1.8
3.6
0.6
0.5
2,515
33.8
30.2
3.6
12.9
51.7
12.4
13.7
14.2
3.1
7.8
0.9
0.8
3,322
17.8
14.5
3.3
35.3
44.1
3.8
14.2
16.5
3.0
6.6
1.8
0.9
4,493
10.3
7.2
3.1
37.3
49.3
2.1
22.6
11.9
6.4
6.3
2.4
0.6
7,338
14.9
5.6
9.4
30.7
49.3
2.1
24.7
10.8
5.8
5.9
3.9
0.6
9,095
SOURCE: Hatton and Williamson 2004, table 10.2.
NOTES: National origin is based on country of last residence. Totals include 2.7 million former illegal aliens receiving permanent resident status under the Immigration Reform and
Control Act, 1986. Of these, 1.3 million fall in the decade 1981–1990 and 1.4 million in
the decade 1991–2000.
market quality of immigrants certainly has its parallel in the pre-1914
era, years that culminated in the influential Dillingham Commission
Report in 1911 and the subsequent country-of-origin quotas
imposed a decade later. An ominous comparison, perhaps, but it provides an obvious benchmark. So how do the two eras match up?
In 1909, the wage for the average male immigrant in industry was
6.4 percent lower than for native-born men, a figure comparable with
the late 1970s. Recent male immigrant arrivals in 1909 earned 20.4
percent less than natives, a figure also similar to the 1970s. But note
this important fact: The variation in immigrant quality by source is
five times greater in modern times than it was in the past—the standard deviation of the log wage across twenty-six immigrant nationalities was 0.056 in 1909 as compared with 0.295 across forty-one
JEFFREY G. WILLIAMSON 5
immigrant nationalities in 1980.1 Much of the source country difference in labor market performance is accounted for by the wage gap
between “old” and “new” immigrants. The wage gap in 1909 between
immigrants from northwest Europe (old) and the rest (new) was 6.7
percent. By contrast, the wage gap in 1980 between Europeans and
those from Africa, Asia, and South America was 30.7 percent.
The implication, of course, is that any shift in immigrant source
away from high-quality and toward low-quality origins has a much
bigger impact on the average quality of immigrants today than a
century ago. And so it was. Between 1873 and 1913, the effect of
changing source-country composition was to reduce the immigrant wage by 4.7 percentage points (2.3 percentage points after
1893). Between 1940 and 1980, source-country composition shifts
reduced the immigrant wage by 27 percentage points (17 percentage
points after 1960). So, while immigrants experienced an earnings disadvantage in 1980 similar in magnitude to that which prevailed on
the eve of World War I, the decline that preceded it was much larger
in the modern era and it continued for an additional decade as well.
In the earlier era, shifts in the source-country composition were
the result of rising incomes and demographic booms in Europe combined with falling transport costs between sending and receiving
regions, forces amplified by the friends and relatives effect. These
forces slowly reduced positive selection: The really poor could not
finance the move until late in the first global century, as their incomes
at home rose and the cost of passage fell (Hatton and Williamson
1998, chapter 3). The same forces have also been at work in the
modern era, but policy served to accelerate the demise of what the literature calls positive selection. These policy changes included the abolition of the country-of-origin quotas that previously favored Europe,
the shift to a worldwide quota, and the emphasis on family reunification over skills as the key criteria for admission. Other OECD
countries also opened their doors more widely and experienced shifts
in immigrant composition and quality, but the effects have not been
as dramatic. For example, as the sources of Canadian immigration
widened after the 1960s, immigrant quality fell but by less than it did
in the United States (Baker and Benjamin 1994). Some have argued
6 THE POLITICAL ECONOMY OF WORLD MASS MIGRATION
that the difference can be explained by policy, the Canadian points
system selecting immigrants with higher average labor quality (Borjas
1993). Perhaps, but note that the difference is accounted for by one
dominant fact: Latin Americans are 47 percent of U.S. immigrants
but only 14 percent of Canadian immigrants, and Mexicans account
for most of that disparity (Antecol, Cobb-Clark, and Trejo 2003).
While this Latin difference may be partly due to immigration policy,
it also reflects location. Distance matters enormously in explaining
who migrates to the United States (Clark, Hatton, and Williamson
2002). Because of its closer proximity to Latin America and its long
land border with Mexico, the United States would need an even more
skill-selective immigration policy than Canada (or even quotas for
Latin Americans) to raise immigrant quality to the Canadian level.
What about the selection of immigrants from a given country?
According to the Roy model, immigrants should be more negatively
selected the higher is the return to skills (and the greater is earnings inequality) at the origin (Borjas 1987). Given that Mexican
inequality exceeds American inequality, Mexican emigrants should be
unskilled. So much for theory. In terms of observable skills, however,
immigrants from Mexico were drawn predominantly from the middle
of the distribution, not from the bottom (Chiquiar and Hanson
2002). A good example of this is offered by table 3, which reports
education data for adult migrants in OECD host countries by sending
source and for adults in the same sending source countries. While
migrants in the OECD have 7.2 more years of education than the
adults they left back home, Mexican migrants (mostly in the United
States) had only 1.2 more years of education than did Mexican adults
back home. The data in table 3 do not adjust for the fact that immigrants are younger than the average adult back home or that immigrants may have received some education in host countries after their
arrival. However, it is very clear that the gap between mover and
stayer is much smaller for Mexicans (close to the United States) and
for East Europeans, Balkans, and Turks (close to the European Union).
It appears that the revealed weaker positive selection is because, as a
share of income, migration costs decrease sharply with skill level, offsetting the positive selection effects of greater inequality at the source.
JEFFREY G. WILLIAMSON 7
TABLE 3
EDUCATION OF THOSE STAYING IN THE SENDING COUNTRY AND ITS
EMIGRANTS IN HOST COUNTRIES, C. 1990
Years of Schooling
Region
(no. of sending
countries)
Africa (4)
Mexico (1)
Caribbean, Central America (14)
South America (10)
Asia (15)
Eastern Europe, Balkans, Turkey (3)
Total (47)
Those
Staying
Migrants
to Host
Countries
Difference
(migrants -stayers)
4.6
6.3
5.4
5.9
5.8
7.8
5.7
15.4
7.5
11.2
12.5
14.4
12.6
12.9
10.8
1.2
5.8
6.6
8.6
4.8
7.2
SOURCE: Based on Hendricks 2002, table B1.
NOTES: All figures are unweighted averages. The column of those who stayed is based on
Barro-Lee, while the migrant column is based on OECD censuses around 1990. The two
columns use country observations only if they supply information on both the stayers and
the migrants.
Although Latin American immigrants are not, on the whole,
negatively selected, it seems likely that they are less positively
selected than migrants from poorer and more distant sources. To
repeat, high migration costs favor positive selection and low
migration costs favor negative selection. Mexico is close enough to
the United States and countries to the immediate east and southeast are close enough to the EU, so that they all share lower migration costs and therefore can send poorer and less-skilled immigrants.
Greater distances, lower source-country inequality, weaker friends
and relatives effect, and (for the poorest regions) the poverty constraint all imply that U.S. and EU migrants coming from farther
away should be more positively selected. So it was that the 1990
share of U.S. immigrants with tertiary schooling was more than
three times higher for Asians and Africans than for Mexicans and
Central Americans. One implication of this is that the brain drain
8 THE POLITICAL ECONOMY OF WORLD MASS MIGRATION
must be more serious the poorer, the more distant, and the more
egalitarian is the sending nation.
The United States faced rising immigrant quantity and falling
immigrant quality before World War I, and it faces them again today.
It appears that the same is true of the EU. What was the political
economy of immigration backlash then? Do these lessons of history
apply today?
A Framework
Most developed countries moved decisively to restrict immigration
during the first third of the twentieth century. Those restrictive controls introduced between World War I and the 1930s were the result
of a combination of factors: public assessment of the impact of immigration on the labor market, growth in the political participation of
those affected, and as a triggering mechanism, the sudden shocks
delivered by the 1890s depression, World War I, the postwar adjustment, and the 1930s depression. Public opinion was becoming
increasingly negative toward immigration, in part as a response to the
imagined or real economic threats delivered by immigration. When
asked for their opinions by state labor bureau interviewers in the
middle of the 1890s depression, here is how some workingmen in
the Midwest responded: Almost 63 percent of the Kansas wage earners surveyed in 1895 thought immigration should be restricted and
another 24 percent thought it should be outright suppressed, adding
up to 87 percent who wanted to retreat from the free-immigration
status quo; almost 68 percent of the Kansas wage earners surveyed in
1897 thought immigration should be restricted and another 24 percent thought it should be suppressed, adding up to 92 percent favoring a retreat from the status quo; about half the Michigan railway
employees surveyed in 1895 thought that immigration injured their
occupation; and almost 62 percent of the Michigan owners of public
conveyances surveyed in 1895 thought immigration hurt their business through greater competition, and more than 92 percent favored
restriction (Hatton and Williamson 2004, chapter 8).
JEFFREY G. WILLIAMSON 9
Negative public opinion is on the rise today, too (Mayda 2003;
O’Rourke and Sinnott 2004). A 1995 international survey asked
whether immigration should be reduced in their country, where a
score of 3 meant remain the same, 4 meant reduce a little, and 5
meant reduce a lot. The figures for three big immigrating countries
were Germany 4.2, Britain 4.1, and the United States 3.9—ranging
between “reduce a little” and “reduce a lot” (O’Rourke and Sinnott
2004, table 1). Furthermore, these responses were given during
boom times in these labor markets. One can well imagine what
they would be now, as the OECD struggles out of its recent slump.
While the labor market effects of immigration are again at issue,
fiscal effects matter now as well, and they matter far more today
than a century ago when governments were much smaller and immigrants were never a big net fiscal burden. Nevertheless, the labor
market effect of immigration has always been the key focus in
debate over immigration policy, and it is what I focus on here.
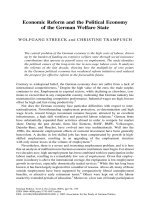
The debate can be motivated by reference to the textbook picture of labor supply and demand in figure 1, where we simplify by
assuming for the moment only one type of output and one type
of labor. As usual, labor demand slopes downward to the right,
capital and technology are taken to be fixed, and exogenous
changes in immigration increase the total labor supply from S1 to
S2. Immigration lowers the wage rate from W1 to W2 while it raises
total profits from the area X to the area X + Y + Z (the area under
the demand curve down to the wage). The total loss to resident
wage earners is area Y and the net gain to society, excluding the
immigrants themselves, is Z. Two points emerge immediately from
figure 1. First, the overall gain to all residents collectively is likely
to be small. One estimate for the United States puts the annual gain
(Z) from the accumulated stock of immigrants at 0.1 percent of
national income (Borjas 1999, 1701). Second, distributional effects
are unambiguous—wage earners lose while their employers gain—
and they are likely to be large. Immigration has different effects,
therefore, on different interest groups, but if wage earners have the
voting majority and immigration policy reflects majority preference, then policy is likely to be restrictive.2
10 THE POLITICAL ECONOMY OF WORLD MASS MIGRATION
FIGURE 1
THE ECONOMIC EFFECTS OF IMMIGRATION
Wage
S1
X
S2
a
c
W1
Y
W2
Z
b
D1
D2
Labor Force
SOURCE: Hatton and Williamson 2004, table 14.1.
Things get more complicated the farther we depart from the
assumptions underlying the simple textbook analysis underlying
figure 1. Four complications are particularly important. First, if
labor markets fail to clear through wage adjustment (in the short
run at least), then immigrants add more to the labor force than to
employment. If immigrants gain employment, they rob jobs from
residents, pushing some of them into unemployment or out of the
labor force. If, on the other hand, immigrants are the last hired and
first fired, then the immigrants themselves dominate the unemployed, or the “informal,” sector, where wages are more flexible and
productivity lower. Second, labor market effects may be attenuated
by adjustments in goods or capital markets. For example, if capital is the only other input and it is perfectly mobile internationally, then the new equilibrium in figure 1 is at c rather than b, as
capital chases after the migrants in response to the incipient rise in
returns (shifting the labor demand curve to the right from D1 to
D2). Under perfect world capital mobility, and thus elastic capital
JEFFREY G. WILLIAMSON 11
supplies, the incomes of the domestic owners of capital and the
wages of resident workers remain unchanged: Residents are neither
better nor worse off, and the immigrants are absorbed without a
hitch. Third, suppose there are two or more types of labor. If the
immigrants are mainly unskilled, then unskilled residents may
lose as a result of the increased job competition, but skilled workers may gain. The more are skilled and unskilled workers complements in production (and the less they are substitutes), the more
likely skilled workers gain from unskilled immigration. Finally,
some of the economic effects of immigration may come through
fiscal transfer rather than labor market adjustment. If immigrants
earn low wages and have low labor market participation, high
unemployment, and high dependency rates, they are likely to be
supported by residents through redistributive tax and welfare systems. If immigrants lack those attributes, then they are likely
instead to support residents through transfers.
These are some of the more obvious effects of immigration on
the incomes of resident populations. Listing them is easy enough;
measuring them is not.
Looking at Local Labor Markets
One obvious way to measure the impact of immigration is to
look across local labor markets that have different rates of immigration from abroad to see if those with higher rates of immigration also have slower wage or employment growth (or higher
unemployment growth) among resident workers. One advantage of
this so-called spatial correlations approach is that, by focusing on
local labor markets within a nation, country-specific shocks and
institutions are held constant. Because of these attractive features, a
number of studies have employed this methodology to investigate
the effects of immigration. The results of a representative sample of
these are summarized in table 4, covering four OECD countries
over the last four decades. The penultimate column reports the
impact on wages in percent from an immigrant-induced 1-percent
12 THE POLITICAL ECONOMY OF WORLD MASS MIGRATION
TABLE 4
ESTIMATED EFFECTS OF IMMIGRATION ON WAGES AND
EMPLOYMENT OF NATIVES
Study
Country/Region, Time
Altonji and Card (1991)
U.S. cities, 1970–80
Lalonde and Topel (1991)
U.S. cities, 1970–80
Borjas, Freeman, and Katz (1997)
U.S. states, 1960–90 (men)
Card (2001)
U.S. cities, by occupation,
1985–90
De New and Zimmermann (1994)
German industries
Pischke and Velling (1997)
German counties, 1985–89
Addison and Worswick (2002)
Australian states, by occupation,
1982–96
Dustmann et al. (2002)
UK regions, 1983–2000
SOURCE: Hatton and Williamson 2004, table 14.1.
NOTE: The estimates reported here are based on regression coefficients that are
often not significantly different from zero. Many of the authors offer a range of
change in the labor force. The last column reports the impact of the
same immigrant-induced labor force impact on employment or
unemployment, this in percentage points.
Table 4 makes it clear that there is little consensus among
economists regarding the amount by which an immigrant influx
(equivalent to 1 percent of the resident workforce) reduces the
wage. In some cases, resident wages of the native born (and previous
JEFFREY G. WILLIAMSON 13
Effect on Earnings of Equivalent
to 1% of the Labor Force (percent)
Effect on Employment/Unemployment of Equivalent to 1% of the Labor
Force (percentage points)
–1.2 (less skilled)
NA
–0.63 (immigrants); –0.83
(young blacks)
NA
0.59 (1960–70); 0.07 (1970–80);
–0.01 (1980–90)
Employment: –0.03 (1960–1970);
0.13 (1970–1980); –0.05 (1980–1990)
–0.15
Employment: –0.05
–4.1 (all); –5.9 (blue collar);
3.5 (low-experienced white collar)
NA
NA
Employment: 0.05
Unemployment: 0.2
1.5 (all); 2.7 (less educated)
No effects on unemployment
1.9 (all); 2.2 (skilled); 1.2 (semiskilled);
2.2 (unskilled)
Unemployment: 0.2 (all); 0.1 (skilled);
0.4 (semiskilled); 0.03 (unskilled)
estimates using different methods, and the ones presented here are considered
the most representative. Since the model specifications vary, the estimates
from different studies are not strictly comparable.
immigrant cohorts) are reduced; in other cases, they are not.
Lack of strong negative wage and crowding-out effects might
be explained by the fact that, in the short run, immigration
increases unemployment, as immigrants either “rob jobs” from
locals or remain unemployed themselves. This impact would
be expected if wage rates are sticky downward, as we think they
are in the short run. However, there is no consistent evidence
14 THE POLITICAL ECONOMY OF WORLD MASS MIGRATION
confirming adverse effects on employment or unemployment in
local labor markets.
Findings like these contributed to a general consensus by the
mid-1990s that the effects of immigration on host country labor
markets are small (Borjas 1994; Friedberg and Hunt 1995). Yet,
three nagging doubts suggested that the “small-impact” view was
premature. First, the finding that immigration neither reduces the
wage nor raises unemployment seems to be inconsistent with elementary theory: Labor demand curves slope downward to the
right. It seems justified to insist that analysts offer an explicit explanation for any finding that rejects such a powerful weapon from the
economists’ arsenal. Furthermore, such findings are inconsistent
with decades of empirical work by economists who estimated
the labor demand curve to have elasticities around –0.5 or higher
(Hammermesh 1993). Second, there is little consistency across
these modern immigration studies, even for the same country.
Third, economists have ignored the first global century and that
pre–World War I history shows unambiguously that immigrants
crowded out natives.
So where has the modern economist gone wrong? There are several reasons why the spatial correlation approach is biased against
finding large crowding-out effects. One reason is simply that the
annual flow of immigration is usually small relative to the size of the
labor market. Since immigrants gravitate toward a few major urban
centers, most regions in most countries that make up the bulk of
the observations in local area studies have immigrant inflows that
are very small relative to local labor supply. Nearly a third of the
U.S. foreign born live in just three metropolitan areas: New York,
Los Angeles, and Miami. About 40 percent of immigrants to Britain
go to London alone and the same share of immigrants to Australia
go to Sydney, while more than a third of those arriving in France
locate in the greater Paris area. Hence, systematic immigration
effects are hard to assess anywhere but in the few areas where new
immigrants concentrate. To make matters worse, immigrants tend
to locate in areas where economic conditions are favorable: where
unemployment is low and falling and wages are high and rising.
JEFFREY G. WILLIAMSON 15
Local immigration is, at least in part, endogenous; and where immigration is endogenous, the direction of causation is reversed and of
the opposite sign. When both this endogenous effect and the “true”
labor market impact are present, the net result is to bias estimates
of crowding out downward. That downward bias could be big.
More important still, the markets for labor and goods are likely
to be very well integrated within developed countries, much more
so than between countries. Suppose goods markets adjust quickly:
As immigrants are absorbed in one region, it expands its production of the goods that use most intensively the skills that immigrants bring. In short, a boom in the region’s export sector absorbs
the immigrants. Labor markets are also likely to be far better integrated within a country than between countries. As immigrants
enter a local labor market, they induce interregional migration by
the native born and previous immigrant cohorts with whom they
compete. As a result, the crowding-out effect is not observed accurately at the local level. Indeed, it may not be observed at all.
Integrated national goods and labor markets imply that the effects
of immigration are spread across the entire country: All boats rise
and fall together as the immigrant tide flows and ebbs. The better
integrated are the markets for goods and labor across regions within a country, the less is an immigration shock reflected in local labor
markets, even though the effects of immigration could still be large
for the country as a whole.
If regional markets are well integrated, then the effects of
immigration can be observed only at the national level. But how?
George Borjas (2003) argued recently that if different types of labor
(defined by schooling and labor market experience) are not good
substitutes for each other, then the effects of immigration can be
inferred by estimating the relative wage impacts of changes in the
supply of different types of labor at the national level. One advantage of this approach is that mobility between these skill groups is
limited. Intercensal changes between 1960 and 2000 reveal strong
negative effects consistent with labor demand elasticities ranging
between –0.3 and –0.4, a little below the –0.5 elasticity typically
found for labor demand. Therefore, the 11 percent increase in labor
16 THE POLITICAL ECONOMY OF WORLD MASS MIGRATION
supply brought about by immigration between 1980 and 2000
must have reduced the wage of the average nonimmigrant worker
by 3.2 percent. Not surprisingly, these impacts vary greatly across
the skill groups: Immigration reduced the wage by 8.9 percent for
high school dropouts, 4.9 percent for college graduates, 2.6 percent
for high school graduates, and almost nothing for those with some
college education (Borjas 2003, 36). Thus, to the extent that immigrants cluster in the group competing with high school dropouts,
the crowding-out impact is very big (bringing that elasticity closer
to –0.5). As we shall see, this result is consistent with assessments
of immigration’s impact on host labor markets during the age of
mass migration before World War I.
An alternative approach is to look across countries whose labor
markets are linked only very loosely. One recent study examined the
short-run impact of immigration on native employment rates in
eighteen European countries between 1983 and 1999, using the
“shock” of asylum immigrants from Eastern Europe to better identify the effects (Angrist and Kugler 2003). The study found that the
addition of one hundred immigrants to a country’s labor force
reduced native employment by between thirty-five and eighty-five,
for an average of sixty (close again to that –0.5 elasticity). These job
losses were largest for young men; and overall job loss was greater
in countries with the least flexible labor markets and the highest
benefit replacement rates (for example, the European welfare states).
It seems reasonable to conclude that the initial effects on employment would eventually translate into wage effects, the adjustment
process depending on the degree of labor market flexibility.
These new findings seem to have solved the riddle of why the
modern, spatial correlation approach so often fails to find big
negative immigration effects on either wage rates or resident
employment. Immigrants do lower the incomes of those residents
with whom they compete most directly, just as they did a century ago. But why did the spatial correlation approach fail to find
big labor market effects? Was it goods market integration, labor
market integration, or something else? Let us begin with the
goods market.
JEFFREY G. WILLIAMSON 17
The Rybczynski theorem suggests that a globally integrated region
can absorb changes in relative factor supply without changes in relative factor prices (in this case, wages relative to other factor prices).
As noted previously, when unskilled immigrants arrive in a local
market, the theorem predicts a relative expansion of industries that
use the additional unskilled labor most intensively and a shift in the
pattern of trade with other regions toward exporting those goods
that use the newly abundant factor most intensively. A recent study
isolated these effects by looking at the skill composition across forty
industries in fourteen U.S. states. The study found that a significant
part of the difference across states in their skill mix was accounted
for by changes in their output mix “consistent with the hypothesis
that state-specific factor-supply shocks do not trigger large statespecific wage effects” (Hanson and Slaughter 2003, 19).3 While these
results offer an impressive confirmation of market integration among
U.S. states, they do not tell us whether the goods market or the labor
market does the adjusting. So, let us turn to the labor market.
In April 1980, Fidel Castro declared that Cubans were free to
emigrate from the port of Mariel. In just a few months, 125,000
took up Castro’s offer and about half of these settled in Miami. The
Cuban influx added 7 percent to the Miami labor force, and they
were mainly unskilled. In his celebrated study of this Mariel
boatlift, David Card (1990) found that this large Cuban influx had
almost no effect on the wage rates of the unskilled relative to skilled
in Miami or relative to the wage rates of the unskilled in other
states. Even previous cohorts of Cubans and other Hispanics did
not seem to have suffered from competition with the Marielitos.
Why? It looks like the answer is displacement. In-migration to
Miami of the native born (or previous immigrants) slowed down
dramatically in the early 1980s, so much so that interregional
migration accounted for most of the adjustment.
How general are the Mariel findings? Is the interregional displacement effect of natives by immigrants large at the economywide level?
One post-Mariel study found that an influx of immigrants 1975–80
equivalent to 1 percent of a standard metropolitan statistical area’s
labor force displaced native workers equivalent to 1.2 percent of the