Mapping social values of ecosystem services, what is behind the map?
Bạn đang xem bản rút gọn của tài liệu. Xem và tải ngay bản đầy đủ của tài liệu tại đây (2.11 MB, 13 trang )
Copyright © 2016 by the author(s). Published here under license by the Resilience Alliance.
Nahuelhual, L., F. Benra, F. Rojas, G. Ignacio Díaz, and A. Carmona. 2016. Mapping social values of ecosystem services: What is
behind the map? Ecology and Society 21(3):24. />
Research
Mapping social values of ecosystem services: What is behind the map?
Laura Nahuelhual 1,2,3, Felipe Benra Ochoa 4, Fernanda Rojas 5,6, G. Ignacio Díaz 7,8 and Alejandra Carmona 3
ABSTRACT. A growing interest in mapping the social value of ecosystem services (ES) is not yet methodologically aligned with what
is actually being mapped. We critically examine aspects of the social value mapping process that might influence map outcomes and
limit their practical use in decision making. We rely on an empirical case of participatory mapping, for a single ES (recreation
opportunities), which involves diverse stakeholders such as planners, researchers, and community representatives. Value elicitation
relied on an individual open-ended interview and a mapping exercise. Interpretation of the narratives and GIS calculations of proximity,
centrality, and dispersion helped in exploring the factors driving participants’ answers. Narratives reveal diverse value types. Whereas
planners highlighted utilitarian and aesthetic values, the answers from researchers revealed naturalistic values as well. In turn community
representatives acknowledged symbolic values. When remitted to the map, these values were constrained to statements toward a much
narrower set of features of the physical (e.g., volcanoes) and built landscape (e.g., roads). The results suggest that mapping, as an
instrumental approach toward social valuation, may capture only a subset of relevant assigned values. This outcome is the interplay
between participants’ characteristics, including their acquaintance with the territory and their ability with maps, and the mapping
procedure itself, including the proxies used to represent the ES and the value typology chosen, the elicitation question, the cartographic
features displayed on the base map, and the spatial scale.
Key Words: cultural ecosystem services; recreation opportunities; social value mapping; southern Chile
INTRODUCTION
Spatial representation of ecosystem services (ES) is acknowledged
as a key footstep for mainstreaming the ES framework into
decision making (Hauck et al. 2013, Villamagna et al. 2013). In
the last decade, a range of methods has been proposed for this
endeavor (see Nelson et al. 2009 and Nahuelhual et al. 2015 for
comprehensive reviews). The first category of methods involves
the assessment of multiple ES, where a reduced number of
economic value estimates are spatially transferred to other
locations (Wong et al. 2015). A second category consists of
modeling the provision of one or few ES at small scales using
ecological production functions (Laterra et al. 2012) that relate
ES flows with spatial variables that stand for ecological functions
and processes. The third category consists of the use of landscape
capacity matrices that relate land uses and covers to the provision
of ES (Burkhard et al. 2009).
A fourth and most recent kind is the mapping of social values of
ES, a mode of spatially explicit valuation, which stresses social
perceptions, values, and priorities over economic and ecological
indicators. It is a participatory approach that engages
stakeholders, individually or in groups, through the use of
different elicitation instruments such as online surveys (Sherrouse
et al. 2014), open-ended interviews (Plieninger et al. 2013), and
workshops (Palomo et al. 2014). Studies may rely on a previous
classification of social values, to which participants are referred
(Sherrouse et al. 2014). Or, participants are allowed to freely
express values, which are afterwards linked to a bundle of ES by
the researcher and spatially represented (Raymond et al. 2009).
Map outcomes usually convey social values as measures of
diversity, richness, abundance, and rarity (Bryan et al. 2010,
Palomo et al. 2014, Sherrouse et al. 2014).
Although valuation of ES using social value mapping has been
supported by the academic sector as an approach to increase
awareness of nature’s benefits, to foster local empowerment, to
effectively incorporate local knowledge in management decisions,
and as a potentially more pluralistic and heterogeneous
alternative toward value and valuation (Scholte et al. 2015),
ecological and economic approaches and indicators still dominate
ES research and policy (Kenter et al. 2015). A central reason for
this comes from the disparate ways of conceptualizing,
measuring, and mapping social values (Kenter et al. 2014). For
example, several terms are used to refer to social values such as
cultural (Darvill and Lindo 2015), shared (Kenter et al. 2015),
socio-cultural (Sholte et al. 2015), and societal values (FelipeLucía et al. 2014). Furthermore, these terms are applied
indistinctly in different contexts (Ives and Kendal 2014, Kenter
et al. 2014), to refer to community norms, the public interest, the
worth of public goods, values that people hold in social situations,
contribution to well-being, and willingness to pay among others
(Kenter et al. 2014, 2015).
For some disciplines contributing to the ES literature and social
value assessment (sociology and psychology), the term value is
used to describe the values of people, also referred to as underlying
or held values. Held values can be classified as “desirable modes
of conduct (e.g. honesty), end-states of existence (e.g. freedom),
or qualities (e.g. beauty)” (Bengston 1994:232). In other
disciplines (economics and geography), the concept of value lies
1
Instituto de Economía Agraria, Universidad Austral de Chile, 2Centro FONDAP de Investigación en Dinámica de Ecosistemas Marinos de Altas
Latitudes (IDEAL), 3Centro de Ciencia del Clima y la Resiliencia (CR2), 4Escuela de Ingeniería en conservación de Recursos Naturales, Facultad de
Ciencias Forestales y Recursos Naturales, Universidad Austral de Chile, 5Instituto de Ciencias de la Tierra, Universidad Austral de Chile, 6Instituto
de Ciencias Ambientales y Evolutivas, Universidad Austral de Chile, 7Doctorado en Ciencias Forestales, Escuela de Graduados Facultad de Ciencias
Forestales y Recursos Naturales, Universidad Austral de Chile, 8Instituto de Conservación, Biodiversidad y Territorio, Universidad Austral de Chile.
Ecology and Society 21(3): 24
/>
in the object realm and is concerned with the relative importance
or worth of an object, often called the object’s assigned value
(Brown 1984, Bengston 1994).
Different typologies to classify ES social values have been
proposed within the ES literature. Chan et al. (2012)
distinguished eight binary and nonmutually exclusive
dimensions of values, e.g., market mediated vs nonmarket
mediated, self-oriented vs other-oriented. Brown (2013),
proposed 14 types of place-based values, which the author
described as an operative form of ES social values. Under this
typology, social values of ES have been defined as “the perceived
qualities carried by a natural environment that provide benefits
to support human wellbeing” (van Riper et al. 2012:164). In
Brown’s typology, the names given to values coincide with the
definition of ES such as the case of spiritual values, or with the
description of benefits such as economic and therapeutic, a
problem that Chan et al. (2012) named the conflation between
ES, benefits, and values, a problem that has also been raised by
other authors (Spangenberg et al. 2014). Kenter et al. (2015)
identified seven nonmutually exclusive shared/social values,
which were classified in transcendental, cultural and societal,
communal, group, deliberated, other-regarding values, and value
to society. In turn, Kellert (1995) proposed a human value
typology based on the notion of the Biophilia hypothesis (Wilson
1984), which asserted a human dependence on nature that
extends beyond material and physical sustenance to include
aesthetic, intellectual, and spiritual meanings, and is the one used
in this study.
Along with this conceptual diversity, social value assessments
have used different methods of valuation (see Kenter et al. 2015
for a thorough revision) without considering the theoretical
underpinnings (Ives and Kendal 2014, Raymond et al. 2014).
Particularly, mapping of social values is a noneconomic
instrumental approach (Raymond et al. 2014) that focuses on
scoring, grading and spatially identifying social values.
In synthesis, social value mapping studies currently target a range
of ES types, a diversity of value concepts, use different
techniques, and declare different purposes for their endeavors.
These purposes range from scientific inquiry, e.g., relation
between land covers and social values, to private and public
decision making, e.g., regulation and control of protected areas.
Recent contributions acknowledge that if social values of ES are
to be considered in decision making, gaining conceptual and
methodological clarity is essential for their application (Kenter
et al. 2014, 2015, Gould et al. 2015). We aimed at contributing
to such clarity by qualitatively exploring aspects of the social
value mapping process that influence map outcomes and limit
their practical use in decision making. We did so by critically
analyzing the details of the implementation of a participatory
nondeliberative mapping exercise for a single ES, namely
recreation opportunities. We aimed at answering questions such
as what types of social values are expressed and mapped by
participants, what these values held for or assigned to, how much
do the notion and spatial representation of social values differ
across stakeholders, and what factors explain these differences.
We hypothesized that map outcomes (spatial social values of ES)
are influenced by aspects of the methodological setting as well
as aspects inherent to the stakeholders and the relationship
between the two. Such aspects should be taken into consideration
and uncovered if the resulting social value maps are to be of utility
for decision making. This is particularly important in countries
with developing economies where valuation of ES faces a myriad
of methodological, practical, ontological, epistemological, and
policy challenges (Christie et al. 2012). Although social valuation
of ES can be highly context-specific, our results provide more
general insights that contribute to the improvement of social value
mapping assessments.
METHODS
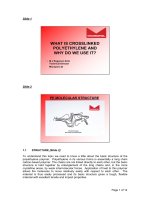
This study was carried out in the municipality of Panguipulli, in
the Los Ríos Region, southern Chile. Panguipulli municipality
(38°30'-40°5' South, 71°35'-72°35' West) has an area of 3292 km²,
and a total population of 33,273 people, of which 52.2% are
considered rural and 25.3% are indigenous (INE 2002).
According to the Chilean Native Vegetation Resource Cadaster
(CONAF 2014), the main land cover is 154,200 ha of old-growth
native forest (42.38% of the total municipality area), followed by
59,400 ha (16.32%) of secondary native forests, and 53,100 ha
(16%) of agricultural lands and pastures. Exotic-tree plantations
constitute 7000 ha (1.92%) and urban and industrial areas cover
712 ha (0.19 %; Fig. 1).
Panguipulli has outstanding natural features such as lakes, rivers,
waterfalls, volcanoes, snow patches, pristine forests, and hot
springs, all of which have granted the municipality a renowned
reputation for tourism and made it a top tourist destination. In
2006, the municipality was formally declared a national tourist
destination and it became part of the group of Areas of Touristic
Interest (Ministerio de Economía, Fomento y Reconstrucción
2005, Ministerio de Economía, Fomento y Turismo 2012).
Currently, Panguipulli is part of the Reserve of the Biosphere of
the Temperate Rainforests of the southern Andes declared by the
UNESCO in 2007 (CONAF 2007, Pino-Piderit et al. 2014). An
important part of the municipality’s total area is publicly
protected by Villarrica National Park and Mocho Choshuenco
National Reserve with 16,928 ha (5.14%) and privately protected
by six private conservation areas making up 48,515 ha (14.7%).
Despite rapid growth of tourism in the last years (near 16%
between 2013 and the present), the main economic activities in
the municipality continue to be cattle ranching, agriculture, and
forestry (timber and firewood extraction from native forests and
pulp from exotic-tree plantations; Municipalidad de Panguipulli
2008, 2012).
Selection of stakeholders
We defined a stakeholder following Freeman (1984) and Reed et
al. (2009), as one who is affected by the decisions and actions
taken by decision makers, and one who has the power to influence
the outcome of such decisions. The identification of stakeholders
relied on previously constructed actors’ maps and power-interest
matrices (Benra 2014, Tapia 2014), as well as our own knowledge
of the study area and local representatives from different groups
and institutions. Fourteen stakeholders were selected making up
the following groups: seven planners from CONAF, the regional
office of the National Tourism Service (SERNATUR), the
municipality tourism office, the Regional Government of Los
Ríos Region, and Panguipulli Model Forest; three researchers
from the Center for Transdisciplinary Environmental Studies and
Ecology and Society 21(3): 24
/>
Fig. 1. Study area in Panguipulli municipality, Los Ríos Region, Southern Chile.
Sustainable Human Development (CEAM) of University Austral
de Chile; four community representatives from the Panguipulli
Environmental Coalition, the Coz-Coz Indigenous Parliament,
Puhuincul Community Tourism Association, and the Liquiñe’s
Association of Ecotourism and Guides.
Within the public institutions, CONAF’s aim is for the sustainable
management of forest ecosystems. SERNATUR is in charge of
promoting tourist activities and infrastructure throughout the
country. Regional governments are responsible for the
administration of each of the country’s regions, with the aim of
fostering social, cultural, and economic development. Model
Forests are public-private alliances that lead inclusive and
participatory processes seeking sustainability goals (CATIERIABM 2012). In Chile, the Panguipulli Model Forest was
implemented in 2005 with the goals of native forest management
and conservation, promotion of local economic initiatives, and
the implementation of mechanisms to foster associativity among
stakeholders ( CEAM
is a research center that focuses on nature conservation and local
development programs.
Among social representatives, the Parliament of Coz-Coz is an
indigenous organization whose mission it is to ensure the
fulfillment of ancient rights of indigenous communities.
Panguipulli’s Environmentalist Coalition is a civil society
organization that ensures sustainable development of the
territory, as an agency reporting on the projects and actions that
are undertaken in Panguipulli. The Community Tourism
Association, Puhuincul, is a group of local inhabitants of the
Mapuche ethnic group dedicated to small-scale tourism. Liquiñe’s
Association of Ecotourism and Guides is an organization
dedicated to the implementation of local tourism, which
emphasizes Mapuche culture and its relationship with nature.
Representatives of the private sector, specifically owners of
private protected areas and managers of ENDESA Electricity
Company (Empresa Nacional de Electricidad S.A) were also
contacted, but they did not answer the invitation.
Ecosystem service selection
We decided to evaluate a single cultural ES (recreation
opportunities) instead of a bundle, to delve deeper and achieve a
better understanding of the factors that might influence social
valuation. To guide the exercise of mapping social values, two
spatial proxies were chosen to represent recreation opportunities:
natural capital and recreation activities (aquatic and terrestrial).
These proxies were selected on the basis that a recreational
opportunity is defined as a particular mixture of the natural
setting (the physical landscape) and recreation activities that rely
upon the physical as well as the built landscape, e.g., roads (MEA
2005, Chan et al. 2011). We used the following definitions, which
were explained in simpler terms to the participants: recreational
activities in natural environments were activities that depend on
the ecosystem for their realization, and do not harm the
Ecology and Society 21(3): 24
/>
environment; these activities were selected based on secondary
data and the research team’s knowledge and were grouped as
activities carried out in the aquatic environment (e.g., kayaking,
thermal waters, observation of flora and fauna) and activities
carried out in the terrestrial environment (e.g., trekking, canopy
rides in forests). Natural capital was defined as the stock of natural
objects and relationships between these objects that are capable
of producing a sustainable flow of biophysical resources that
sustain both life and the human economy (Wackernagel and Rees
1997).
Social value concept and typology
We did not adopt a particular definition of social value, but we
did focus on the distinction between held and assigned values. We
expected both types of values to arise from the interviews.
According to Brown (1984), values belong in three realms: the
conceptual, the object, and the relational realm. Held values
belong to the conceptual realm, where a value is defined as “an
enduring conception of the good and is sometimes referred to as
an ideal value” (Bengston 1994:520). Value in the object realm is
concerned with the relative importance or worth of an object,
often called the object’s assigned value. In the relational realm,
value arises from a connection between a subject and an object
in a given particular context. In words of Bengston (1984:520),
“The conceptual realm is concerned with an important part of
the basis of value, the relational realm is concerned with the
valuation process, and the object realm is concerned with the end
result of the valuation process.” Thus, by defining values in terms
of one of the three realms, researchers focus on part of a broader
valuation process (Bengston 1994).
Along with the distinction between held and assigned values, we
selected a particular typology to interpret the values expressed by
participants, specifically the typology of human values for nature
proposed by Kellert (1995) (Table 1). As far as we know, this
typology has not been used in the context of ES’s social valuation,
but it is largely similar to the structure of values proposed by other
authors (Chan et al. 2012).
Table 1. Human values toward nature (Adapted from Kellert
1995).
Value
Description
Utilitarian
Naturalistic
Value related to the material exploitation of nature
Value related to a sense of fascination, wonder, and
admiration derived from the close experience of
nature
Value related to the motivational need for precise
study and systematic inquiry of nature (function and
structure)
Value derived from the physical attractiveness and
beauty of nature
Value derived from the use of nature for language
and reflection
Value related to the emotional attachment and love
for nature
Value derived from the spiritual amazement and
ethical concern for nature
EcologisticScientific
Aesthetic
Symbolic
Humanistic
Moralistic
Interview design, testing, and application
The elicitation instrument combined an open-ended interview
and a mapping exercise, and was based on the works of Raymond
et al. (2009), Bryan et al. (2010), Hatton-MacDonald et al. (2013),
and Palomo et al. (2014). In order to adjust the instrument and
the elicitation procedure, a small workshop was held in May of
2014 with a total of six participants, who were researchers and
students from Universidad Austral de Chile, engaged in research
and development projects in Panguipulli. This workshop allowed
for several modifications: a nondeliberative over a deliberative
format was chosen; the quality of the map was improved (scale
and resolution); recreational activities were included, along with
natural capital, as spatial proxies of recreation opportunities; the
number of marking possibilities was attuned; and the general
handling of the mapping exercise was defined.
The final interview was conducted between June and August of
2014, and was registered using paper notes. It began by presenting
the objectives of the research followed by the collection of
personal information (e.g., gender, educational level, and ethnic
background) and familiarity of participants with the territory.
Some of the questions asked were the following: Do you
acknowledge the administrative limits of the municipality? What
proportion of the municipality are you familiar with? Have you
carried out recreational activities in the municipality? After this
first stage, the definitions of recreational activities and natural
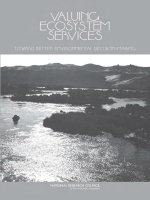
capital were given to the interviewees. Spatial representation of
natural capital and recreational activities relied on a printed map
of the municipality of 102.5 by 75.5 cm and of 1:350,000 scale,
showing current land uses and covers (henceforth the base map;
Fig. 2). The base map also displayed rivers, main road networks,
urban areas, names of particular places, and landscape attributes
such as lakes, rivers, and volcanoes.
For each interview, a sheet of tracing paper (102.5 x 75.5 cm) was
previously prepared delineated with rectangular cells of 2.2 by
2.3 cm. Each cell accounted for a real area of 5.2² kilometers.
Thus, the tracing paper comprised a total of 720 cells distributed
in 33 rows and 45 columns (Fig. 2). During the mapping exercise,
this tracing paper was placed on top of the base map for
participants to position marks using markers of different colors.
This exercise was repeated for natural capital and recreational
activities leading to two maps per person.
Based on previous studies (Bryan et al. 2010) and the pilot testing,
a total of 60 possibilities of marks were allowed for natural capital
and 40 for recreational activities. Only one mark was permitted
in each cell of the tracing paper. Every participant was
encouraged, but not obligated to assign all the given possibilities.
Two valuation questions were asked to participants, leading to
two different maps: “In which cells do you think there is value for
natural capital?” and “In which cells do you think there is value
for recreational activities?” These questions were intended to
capture values based on the past and current experience of
stakeholders with their territory as planners, scientists, or local
inhabitants. Participants were allowed to express themselves freely
about these questions and any other issues that could be of their
interest. The interviewers used the participant observation
technique, which is characterized by factors such as openmindedness, absence of prejudice, interest in learning more about
others, and careful observation and listening (DeWalt and
DeWalt 2010).
Interview analysis
Interviews provided information about the participants such as
their experience in the territory and their relationship with it,
Ecology and Society 21(3): 24
/>
Fig. 2. Mapping exercise showing the base map and tracing paper on which participants marked places of value
of natural capital and recreational activities.
among other evidence. The most relevant details of the interviews
emerged when the participants looked at the map. This was
because the participants responded with personal stories,
experience from institutions that they represented, and critical
thinking about the objective of mapping natural capital and
recreational activities in the territory. Because the interviews were
not recorded, the qualitative analysis relied on the revision of the
notes and on the interviewers’ observations.
for each group we would have a minimum rate of 0 and a
maximum rate of 1. To visualize and analyze the data we created
a raw grid map with standardized cell values. Each cell had a
particular standardized value, that is, the ratio between the
number of marks given to a particular cell and the sum of all
marks given by all participants of every group. We then separated
the cell values in four categories to better display the differences
within and across groups.
Geographic Information System (GIS) analysis
GIS analysis complemented the examination of the narratives
and was aimed at exploring questions such as the following:
“What are the values expressed by different stakeholders held for
or assigned to and how much do these values differ across
stakeholders?” Specifically the position of marks by the different
groups (as indication of social values) was expected to be related
to particular features of the physical and built landscape. These
spatial outcomes, along with the narratives, allowed us to infer
some response patterns and relate them to specific aspects of the
participants or the methodology itself, e.g., expertise in using
maps, map extent. Nonetheless, it is important to remark that
exploring causality was beyond the purpose of the study.
A first GIS analysis was intended to explore whether or not there
was a relationship between the positioning of marks for natural
capital and recreational activities and particular elements of the
physical (rivers, volcanoes, and lakes) and built landscape (road
near settlements and settlements). This analysis relied on
proximity rules detailed in Table 2, and aimed at revealing the
elements from the map that could act as attractors for mark
placement, which in turn could be influenced by the features
shown on the base map during the exercise.
First, a binomial database containing all the results for each
participant was created and joined to the respective spatial grid
from each of the three stakeholder groups (we uploaded an excel
spreadsheet to the GIS program for each of the three stakeholder
groups). Second, because the three groups had a different number
of participants, we transformed (standardized) the data (0-1), so
In turn, to understand whether the spatial representation of social
values (as reflected in the placement of marks) differed across
stakeholders, we calculated measures of centrality and dispersion
(Mean Weighted Center and Standard Deviational Ellipses,
respectively). These measures served the purpose of identifying
central tendencies and geographical dispersal of marks placed by
each stakeholder group. The Mean Weighted Center of the marks
was calculated to identify the center of gravity, considering
individual weights in a set of points (Buzai and Baxendale 2006),
which in this case were the aggregated number of marks placed
Ecology and Society 21(3): 24
/>
on each cell by the participants. Standard Deviation Ellipses were
generated for natural capital and recreational activities to
measure the trend of the marks. The calculation of the standard
distance separately in the x and y directions is a common way of
measuring the trend for a set of points or areas. These two
measures define the axes of an ellipse encompassing the
distribution of features. The ellipse is denoted as the standard
deviational ellipse, because the technique calculates the standard
deviation of the x co-ordinates and y co-ordinates from the mean
center to define the axes of the ellipse (Mitchell 2005). Both
procedures were conducted in ArcGis 9.3 (Spatial Statistics Tools
module).
Table 2. Proximity rules defined to identify attributes that
influenced the positioning of marks for natural capital and
recreation activities.
Attribute
Description of the rule
Volcanoes
Cells within a buffer radius of 10 km from the
volcano summit
Lakes
Cells intersecting water bodies
Rivers
Cells intersecting river lines
Roads
Cells intersecting road lines
Settlements (cities, Cells within a buffer radius of 3.16 km from the
towns, and villages) urban settlement centroid.
RESULTS
Stakeholder characteristics and values
From the narratives, different types of values emerged,
associated to participants’ relationships with the territory
(planners, scientists, or local representatives) and their degree of
familiarity with it (Table 3). Planners were all men and had
completed university education. Three out of seven resided in
the municipality. All had a large involvement in tourism and
forest planning at different administrative scales, and were well
acquainted with the entire municipality area. The majority had
participated in the creation of policies, plans, and programs
oriented toward positioning Panguipulli as an important
national and international tourist destination. Their
professional training considerably facilitated the mapping
exercise. When placing their marks on the map, a professional
perspective predominated, although all of them recalled
particular recreational experiences in the territory. In the case of
natural capital, they distinguished those landscape features that
are acknowledged by the tourism authority as icons for the
expansion of tourism in the region, e.g., Panguipulli Lake, scenic
points. In the case of recreational activities, they associated their
marks to places where recreational activities have already been
prioritized, e.g., aquatic recreational activities, within planning
instruments such as the Tourism Development Plan and the
Regional Territorial Plan. To a large extent, their opinions
reflected the object realm of social values. Such assigned values
predominantly reproduced utilitarian values, i.e., practical and
material exploitation of nature, that could also be deemed as
market-driven and other-oriented, rather than self-oriented
values. Planners also expressed aesthetic values, i.e., physical
appeal and beauty of nature, from their personal experience as
visitors and recreationists in the territory, in which case values
could be deemed as individual and self-regarded.
Table 3. Values inferred from the narratives of stakeholders
during the interview and mapping exercise.
Value type
Planners
Scientists
Local
representatives
Utilitarian
Naturalistic
EcologisticScientific
Aesthetic
Symbolic
Humanistic
Moralistic
•
•
•
•
•
•
•
•
•
•
•
•
•
•
Researchers were involved in development programs linked to
local tourism initiatives, yet their acquaintance of the territory
was less than that of the planners. None of them resided in the
municipality and like planners, they had a high training in
participatory cartography and held university degrees. Although
familiar with the concept of ES, they had not incorporated the
approach in their work, advocating for a biological conservation
perspective. Regarding natural capital, they highlighted areas that
were reportedly relevant for their own ventures, such as the buffer
zone of the Reserve of the Biosphere of the Temperate
Rainforests, Villarrica National Park, and the rural communities
where they assist local tourism initiatives. Assigned values
predominated over held values in their narratives. These values
could be judged as utilitarian, prioritizing places with strategic
features, comparable to the group of planners. Their narratives
could also be related to ecologistic and scientific values (i.e.,
systematic study of structure, function, systematic inquiry of the
natural world) as well as naturalistic (i.e., direct experience and
exploration of nature), as they held a large commitment to nature
conservation. Their values were also regarded as other-oriented
and group values.
Community representatives had lived and worked in the territory
their entire or most of their lives. Nonetheless, they were less
acquainted with the municipality space than planners and
researchers. They belonged to, or had a close attachment to the
Mapuche indigenous peoples. Unlike planners and researchers,
they had very limited experience with mapping, and less
familiarity and acceptance of the concept of ES. Their reflections
revealed a larger variety of assigned and held values, which were
nonetheless much more related to their own idea of nature than
to the concepts of natural capital and recreational activities. They
expressed symbolic (i.e. use of nature for language and thought)
as well as naturalistic values, that were reflected in statements such
as, “there are places in my community that do not only hold
recreational importance, but they also hold profound meaning,
such as the “Ngen”.” In the Mapuche group, the religious concept
of “Ngen” is used to signify the spirits, owners of nature.
Table 3 summarizes those values that could be inferred from the
narratives of participants. Nonetheless, these values corresponded
to announcements during the interviews, but are not necessarily
those reflected in the final map, where certain elements,
particularly those that are symbolic, could not be spatially
located.
Ecology and Society 21(3): 24
/>
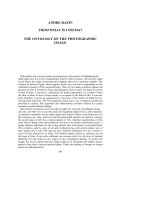
Fig. 3. Elements of the natural and built environment influencing the placement of marks by the different groups of stakeholders
(colored lines). The scale ranges from 0 to 100 according to the percentage of cells that fell within each rule, described in Table 2.
Relation between mapping outcomes and landscape features
Figure 3 shows the relation between the positioning of marks for
natural capital (panel A) and recreational activities (panel B), to
particular attributes of the physical (rivers, volcanoes, and lakes)
and built landscape (roads near settlements and settlements). This
gives insight about the attributes of the base map that drove
personal decisions regarding the placement of marks and
therefore social values.
Regarding the relationship between natural capital and landscape
attributes (Fig. 3A), 34.1% of marks placed by researchers were
within a 10 km radius from volcano summits (Villarrica and
Mocho-Choshuenco). This was consistent with the areas where
their work territory was located; whereas for planners and
community representatives, these numbers decreased to 25.4%
and 12.7%, respectively. In turn, 39% of planners’ marks
intersected a river, a percentage that increased to 55% and 66%
for community representatives and researchers, correspondingly.
Lastly, 47% of marks placed by community representatives
intersected a lake, as compared to 41% in the case of planners
and 27% in the case of researchers. The placement of marks was
also related to the presence of built attributes of the landscape
(Fig. 3A). The results indicated that 52% and 51% of the marks
of planners and community representatives, respectively, fell on
cells that intersected roads. It was no coincidence that planners’
marks concentrated along the circuit that encloses the main lakes
of the municipality, being a local icon for tourism development.
In turn, only 14% and 15% of their marks, respectively, fell within
a 3.2 km buffer of urban settlements. In the case of researchers,
only 24% of their marks were placed on cells intersecting roads,
and only 7% were placed within the established settlement’s buffer
zone.
Regarding the relationship between recreational activities and
physical landscape attributes (Fig. 3B), the three groups exhibited
homogeneous patterns. The most noticeable differences occurred
in the group of researchers, whose marks showed a relatively
higher concentration around volcanoes and rivers (38% and 77%
of marks, respectively), whereas community representatives
concentrated the least amount of marks near volcanoes (26%).
Concerning built attributes (settlements 3.2 km buffer and
intersection with roads), the three groups exhibited very similar
concentrations of marks with 17%, 18%, and 15% for planners,
community representatives and researchers, respectively.
In synthesis, two tendencies were revealed: (i) irrespective of the
stakeholder group and the proxy used, there was a close relation
between the placement of marks and the presence of rivers and
roads; (ii) there was a higher dispersion of marks in the case of
natural capital as compared to recreational activities, irrespective
of the stakeholder group. The case of rivers could be merely
coincidental, given the large amount of rivers in the municipality
and considering that they were not highlighted in the interviews.
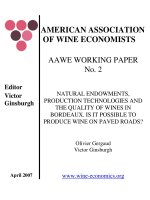
Map outcomes across stakeholder groups
Figure 4 (A and B) shows the spatial distribution of marks that
represent participants’ social values for recreation opportunities,
across groups of stakeholders. In the case of natural capital, mean
weighted centers between planners and researchers were 9.8 km
apart, whereas the mean center of the marks of community
representatives lay in between both, and closer to that of planners.
In turn, for recreational activities, the mean centers of the marks
of planners and researchers were placed 7.7 km apart, with the
center of community representatives being closer to researchers
in this case. For natural capital, researchers positioned their marks
closer to volcanoes and natural protected areas, whereas
Ecology and Society 21(3): 24
/>
Fig. 4. Maps of central tendencies (panels A and B) and distribution of social values for recreation
opportunities, obtained from the spatial analysis of the marks assigned by the three stakeholder’s groups to
natural capital (panels C, E, G) and recreational activities (panels D, F, H).
community representatives placed their marks on piedmont areas
and valleys between Panguipulli and Calafquén lakes (see Fig. 1).
For recreational activities, dispersion showed similar patterns for
the three groups of stakeholders, with most marks concentrated
on common places. In all cases, the east half of the municipality
concentrated the highest amount of marks, which coincided with
the location of native forest ecosystems and lakes, as opposed to
the west part of the municipality, covered by agricultural lands
and pastures.
The marks attached to natural capital by planners (Fig. 4C)
concentrated around the northern edge of Panguipulli Lake, the
Mocho-Choshuenco Natural Reserve, and the surroundings of
Calafquén Lake, which was similar to the outcome of community
representatives (Fig. 4G). In the case of researchers, almost the
totality of marks clustered on natural reserves around volcanoes
and in the specific area of Liquiñe-Neltume-Choshuenco because
of its natural capital and ongoing recreational activities (Fig. 4E
and F). It is important to notice that the three researchers largely
coincided in the placement of their marks as indicated by the red
color, particularly for natural capital. Instead, local
representatives showed the largest differences as indicated by the
significant number of yellow cells, for both natural capital and
recreational activities.
A synthesis of factors influencing map outcomes
Figure 5 depicts three fundamental aspects that emerged from
our case study and that may be related to map outcomes, although
no causal relationships were explored: (1) stakeholder personal
characteristics and background; (2) valuation setting or the way
in which the valuation exercise was framed; and (3) the model,
which was the spatial representation of the system to which social
Ecology and Society 21(3): 24
/>
values were attached. The interaction of these factors made up
the differing and unique characteristics of resulting narratives
and maps (Table 3, Figs. 3 and 4).
Fig. 5. Interrelated factors that influence the outcomes from
mapping of social value of ecosystem services.
of value), which in this case was the ES as represented by two
proxies (natural capital and recreational activities); (ii) the
wording of the elicitation question; and (iii) the value typology
that we relied upon to interpret the values obtained. The
narratives and the resulting maps showed evidence that the proxy
used to represent the ES to be valued was not neutral, which was
revealed by the differences between maps of natural capital and
recreational activities (Fig. 4). Regarding the wording of the
valuation question, it was not surprising that the notion of natural
capital evoked more meanings than the concept of recreational
activities, and the two concepts were associated to different
landscape attributes by each stakeholder group (Fig. 3).
Value expressions were interpreted using a particular typology.
According to this classification, several value types could be
inferred from the narratives, e.g., utilitarian, symbolic,
naturalistic. However, the mapping exercise bounded values to be
assigned to particular attributes of the physical landscape, e.g.,
lakes in the case of community representatives, or places, e.g.,
buffer zones in the case of researchers (Fig. 3). In most cases,
participants referred to places where they knew visitors could
enjoy recreational activities in general, rather than places where
they had experienced such activities. Furthermore, the
identification of these attributes and places was clearly related to
the features displayed on the base map.
Regarding stakeholder personal characteristics and background,
four interconnected aspects perceivably influenced map
outcomes: (i) relation with the territorial space; (ii) acquaintance
with the territory; (iii) expertise in using maps; and (iv) culture,
understood as shared knowledge, values, and practices of local
representatives that belonged to the Mapuche group. Stakeholder
relationship and involvement with his/her territory as planner,
researcher, or inhabitant, implied different value expressions and
map displays (Table 3; Fig. 4) the same as the degree of
acquaintance with the territorial space, with planners being the
most knowledgeable in our case. In the case of local
representatives, the interaction between acquaintance and the
spatial extent of the base map led to marks being placed in areas
where no particular landscape attributes were located (see Fig.
4G and 4H).
Lower expertise with maps by community representatives led to
situations such as the impracticality to locate places that they
knew were of importance to them, e.g., special forest patches or
family recreational sites, and placement of marks constrained
around familiar attributes showed on the base map, regardless of
their relation to natural capital or recreational activities, e.g.,
places around their hometowns. The results also showed
differences in the values that emerged from the narratives of
community representatives that belonged to indigenous groups.
Symbolic values pertained indeed to the realm of the Mapuche
people and related to physical objects, e.g., a mountain, and
metaphysical representations, e.g. a spirit. These held and
assigned symbolic and naturalistic values coexisted with a
recognition of the importance of the utilitarian use of the
landscape for their local livelihoods, e.g., local tourism initiatives
such as horse riding and other amenities.
Valuation setting included the following: (i) the presentation to
the participant of what was to be valued and mapped (the object
The model comprised the extent and resolution of the base map
(Fig. 5) as well as the representation itself. These three aspects
posed clear difficulties for the participants, particularly local
inhabitants. Beyond their skill in using maps or interest in the
mapping exercise, all stakeholders manifested some degree of
struggle with the base map, because it was hard to orientate
themselves or it was impossible to be familiar with the entire area
of the municipality (3292 km²).
DISCUSSION
Our results corroborate previous findings (Villamor et al. 2014,
Davies et al. 2015, Scholte et al. 2015), that outcomes from
mapping of ES’ social values reflect the interaction of a series of
factors related to the mapping exercise itself and to the
participants. At least to some degree, the results may be an artifact
of the mapping process itself (Cacciapaglia et al. 2012), which in
this case involved the series of variables depicted in Figure 5.
These aspects have not been well addressed in ES literature and
their influence remains hidden in social mapping exercises,
particularly in deliberative contexts where power and influence
relations are not foreknown by the researcher and may influence
map outcomes.
Other authors have described links between ES prioritized, values,
and stakeholders’ livelihoods (Maass et al. 2005, López-Santiago
et al. 2014); and among policy and scientific knowledge and ES
values (Villamor et al. 2014). In our case study, stakeholder
background (Fig. 5) influenced map outcomes in ways that could
have led to erroneous conclusions, such as that an area or
landscape feature apparently holds little or no value (see Fig. 4).
In reality, marks are not located in these places because of the
lack of knowledge about those areas, as long as livelihoods are
constrained to smaller territorial boundaries. Additionally,
mapping exercises such as ours assume that people can use maps
and scale categories, which requires a certain level of expertise,
an assumption that did not necessarily hold in the case of local
Ecology and Society 21(3): 24
/>
representatives. Therefore, given the importance of stakeholder
representativeness in social value assessment and mapping
(Fagerholm et al. 2012, Davies et al. 2015), mapping procedures
should be adequately adapted to stakeholders’ capacities by
limiting technical difficulties, e.g., expertise with maps. The
important issue of culture and valuation of ES has been discussed
in recent papers (Klain and Chan 2012, Schnegg et al. 2014).
Schnegg et al. (2014) concluded that whether or not local
inhabitants’ valuations converge with those from other social
groups such as planners and scientists, remains an empirical
question and that resolving potential differences among their
views is likely to be a political, scientific, and epistemological
challenge. In our present study, participants from the Mapuche
culture stated values that clearly differed from those of the other
two groups (Table 3, Fig. 4). It may also be the case that their
relationship with nature does not conform to the concept of ES,
an issue that was explicitly raised by one representative of the
Coz-Coz Parliament. In this regard, researchers need to recognize
that the ES approach entitles a specific ontology that frames the
world in a particular way (Kull et al. 2015), in which certain values
simply do not fit naturally (Chan et al. 2012). Stakeholders’
culture (shared knowledge, values, and practices), which in this
case alludes to the Mapuche people, can enable or impede the
application of the ES framework in general, as well as social value
mapping in particular. In these cases, forcing values onto a map
may risk map validity and credibility.
Like in other approaches to ES valuation, e.g., economic
valuation, the setting can influence map outcomes. In this case,
the elicitation question asked participants to identify those places
where they thought there was value for natural capital and
recreational activities. The valuation question chosen in this work
coincided with other studies such as Sherrouse et al. (2011), in
which people were asked questions such as “In what ways do you
value (a particular territorial space)?” and “To what places can
you attribute such values?” based on a predefined typology of 12
values (Clement and Cheng 2006). This type of wording naturally
constrained participants to express preferences toward
geographic features, or to identify locations on the map where
certain recreational values could be found, held, or experienced.
However, whether ecosystems, ES, places, landscapes, or nature
are homologous terms when it comes to eliciting social values
remains an empirical question. Finally, the value typology
encloses the discussion of the resulting values. If we had selected
a different typology, we would have discussed another set of social
values, such as intrinsic, biocentric, and transcendental values like
in Chan et al. (2012). The typology chosen in this study (Kellert
1995) implicitly assumes that human values toward nature are
anthropocentric (they are held or assigned by a human person),
which might be in opposition to other social value typologies that
try to emphasize the differences between self-regarded
anthropocentric values and biocentric and other-regarded values,
for example (Chan et al. 2012).
Stakeholder characteristics and valuation setting interacted with
features of the base map in producing the final map outcomes.
The two-dimensional paper representation of the study area was
probably too simplistic in that it reduced the individual character
of landscape perception into an overly narrow set of objects, e.
g., lakes, rivers, volcanoes, roads. It also posed noticeable
difficulties of scale, particularly for local representatives. Three-
dimensional computer or paper representations might be much
better options to deal with spatial resolution and extent. It is
therefore important to previously test the model format, resolution,
and extent, to elucidate which options stakeholders are more
comfortable with. The latter practice has been scarcely undertaken
in participatory mapping of ES. However two issues are yet to be
addressed. First, the fact that by changing scales, researchers can
affect map outcomes when providing a model onto which certain
values and views fit or do not fit. In consequence, such maps reflect
both the researcher’s expectations of what is important, as well as
the participant’s views to the extent that they fit on the map
(Cacciapaglia et al. 2012). Second, there is the notion that certain
values simply cannot be mapped. Hall et al. (2009) acknowledged
that many human values do not necessarily have a spatial dimension
because they are intangible or nonmaterial. This occurred with the
more symbolic representations of value depicted by Mapuche local
representatives, especially those that alluded to territorial spirits of
protection (the “Ngen”) and naturalistic values.
To become an operational tool for decision making and
empowerment, ES social value maps need to meet the criteria of
credibility (scientific suitability of the technical evidence), salience
(relevance of the assessment to decision makers’ needs), and
legitimacy (construction of information respecting stakeholders’
diverging values and beliefs and in an unbiased way; Hauck et al.
2013). Improving social value mapping to meet these criteria and
to mainstream it in territorial planning, calls for a process
perspective, in which qualitative and quantitative mapping methods
should be combined, rather than a single intervention like the one
followed here and in most studies of this kind. By joining the
instrumental approach toward social valuation with ethnographic
and phenomenological approaches for example, researchers can
“get a sense of what mechanisms people use, how and why they
express, negotiate and justify their values and establish different
meanings and understand the personal, political, societal processes
whereby values are experienced, used, sensed, represented,
formulated to constitute the individuals’ being in the various
everyday realms” (Tsirogianni and Gaskell 2011:460).
CONCLUSIONS
Combining participatory mapping methods and GIS for the
assessment of spatial social values of ES requires a clear assessment
of their respective strengths and weaknesses for different
applications. In spite of this awareness, there has been little critical
analysis evaluating the usefulness of current procedures. In most
studies, the aim has been to represent the spatial distribution and
concentration of social values of ES, without placing greater
attention on the type of values reproduced in the maps by different
individuals or on how peoples’ specific characteristics interact with
researchers’ methodological decisions to produce a specific spatial
representation. Our present study posed the question of what is
behind the map, and aimed at exploring aspects of a social value
mapping implementation that might influence map outcomes and
limit their practical use in decision making. We conclude that the
instrumental approach to social valuation of ES may only capture
a subset of relevant values, which are derived from a myriad of
opinions constructed around the objective, subjective, and/or
personal interest of each individual. With final map outcomes being
dependent on the participants, it is almost certain that including
different and eventually more stakeholders, would produce
different maps.
Ecology and Society 21(3): 24
/>
Although narratives reflected assigned and held values, their
distinction in the maps was not attainable with the methodological
approach used here. Given the valuation setting and the model
we used, which is the usual frame of the mapping exercises
reported in other studies, individuals were restricted to map
assigned values to objects of the landscape that were mostly those
displayed on the base map. A relevant interaction influencing map
outcomes was that between stakeholder’s relation and
acquaintance with their territory and the scale of the base map
(extent and resolution).
for land-cover based assessments. Landscape Online 15:1-22.
/>
Strengthening map validity requires the acknowledgement of
what factors and in what manner they influence social mapping
procedures. It also requires our effort in moving toward
conceptual agreement regarding definitions of social values of
ES and typologies to interpret those values, and unified
implementations for assessing spatial social values.
CATIE-RIABM. 2012. Estándar para el monitoreo y evaluación
de Bosques Modelo. Propuesta para orientas la gestión de iniciativas
de la red iberoamericana de Bosques Modelo. CATIE, Turrialba,
Costa Rica. [online] URL: />
Responses to this article can be read online at:
/>php/8676
Acknowledgments:
This research was funded by FONDECYT Grant N° 1151187
(CONICYT-Chile), Grant from the Inter-American Institute for
Global Change Research (IAI) CRN3095, which is supported by
the US National Science Foundation (Grant GEO- 1128040), and
VESPLAN (CYTED Network 413RT0472). The authors wish to
thank all the participants in this study and specially Panguipulli
Model Forest representatives.
LITERATURE CITED
Bengston, D. N. 1994. Changing forest values and ecosystem
management. Society & Natural Resources 7:515-533. http://dx.
doi.org/10.1080/08941929409380885
Benra, F. 2014. Mapeo del valor social del servicio ecosistémico
oportunidades de recreación: Un caso de estudio en la comuna de
Panguipulli, Región de los Ríos, Chile. Tesis Ingeniero en
Conservación de Recursos Naturales. Valdivia, Chile. Facultad
de Ciencias Forestales y Recursos Naturales, Universidad Austral
de Chile.
Brown, G. 2013. The relationship between social values for
ecosystem services and global land cover: an empirical analysis.
Ecosystem Services 5:58-68. />ecoser.2013.06.004 />Brown, T. C. 1984. The concept of value in resource allocation.
Land Economics 60:231-246. />Bryan, B. A., C. M. Raymond, N. D. Crossman, and D. HattonMacDonald. 2010. Targeting the management of ecosystem
services based on social values: where, what, and how? Landscape
and Urban Planning 97:111-122. />landurbplan.2010.05.002
Burkhard, B., F. Kroll, F. Müller, and W. Windhorst. 2009.
Landscapes’ capacities to provide ecosystem services - a concept
Buzai, G. D., and C. A. Baxendale. 2006. Análisis socio-espacial
con sistemas de información geográfica. Lugar Editorial, Gepama,
Buenos Aires, Argentina.
Cacciapaglia, M. A., L. Yung, and M. E. Patterson. 2012. Place
mapping and the role of spatial scale in understanding landowner
views of fire and fuels management. Society & Natural Resources
25:453-467. />
Chan, K. M. A., J. Goldstein, T. Satterfield, N. Hannahs, K.
Kikiloi, R. Naidoo, N. Vadeboncoeur, and U. Woodside. 2011.
Cultural services and non-use values. Pages 206-228 in P. Kareiva,
H. Tallis, T. H. Ricketts, G. C. Daily, and S. Polasky, editors.
Natural capital: theory and practice of mapping ecosystem services.
Oxford University Press, Oxford, UK. />acprof:oso/9780199588992.003.0012
Chan, K. M. A., T. Satterfield, and J. Goldstein. 2012. Rethinking
ecosystem services to better address and navigate cultural values.
Ecological Economics 74:8-18. />ecolecon.2011.11.011
Christie, M., I. Fazey, R. Cooper, T. Hyde, and J. O. Kenter. 2012.
An evaluation of monetary and non-monetary techniques for
assessing the importance of biodiversity and ecosystem services
to people in countries with developing economies. Ecological
Economics 83:67-78. />Clement, J. M., and A. S. Cheng. 2006. Public values and
preferences regarding forest uses and management on the Pike and
San Isabel National Forests, Colorado. Survey Results.
Department of Forest, Rangeland and Watershed Stewardship,
Colorado State University, Fort Collins, Colorado, USA.
Corporación Nacional Forestal (CONAF). 2007. Documento
base para la incorporación del territorio andino de la región de Los
Lagos a la red mundial de Reservas de Biosfera. Programa MAB
- UNESCO, Paris, France.
Corporación Nacional Forestal (CONAF). 2014. Monitoreo de
Cambios, Corrección Cartográfica y Actualización del Catastro
de los Recursos Vegetacionales Nativos de la región de Los Ríos.
CONAF, Santiago, Chile.
Darvill, R., and Z. Lindo. 2015. Quantifying and mapping
ecosystem service use across stakeholder groups: implications for
conservation with priorities for cultural values. Ecosystem
Services 13:153-161. http://
dx.doi.org/10.1016/j.ecoser.2014.10.004
Davies, K. K., K. T. Fisher, M. E. Dickson, S. F. Thrush, and R.
Le Heron. 2015. Improving ecosystem service frameworks to
address wicked problems. Ecology and Society 20(2):37. http://dx.
doi.org/10.5751/es-07581-200237
Ecology and Society 21(3): 24
/>
DeWalt, K. M., and B. R. DeWalt. 2010. Participant observation:
a guide for fieldworkers. Rowman Altamira, Walnut Creek,
California, USA.
Ecosystem Assessment follow-on: work package report 6: shared,
plural and cultural values of ecosystems. UNEP-WCMC,
Cambridge, UK.
Fagerholm, N., N. Käyhkö, F. Ndumbaro, and M. Khamis. 2012.
Community stakeholders’ knowledge in landscape assessments—
mapping indicators for landscape services. Ecological Indicators
18:421-433. />
Klain, S. C., and K. M. A. Chan. 2012. Navigating coastal values:
participatory mapping of ecosystem services for spatial planning.
Ecological Economics 82:104-113. />ecolecon.2012.07.008 />
Felipe-Lucía, M. R., F. A. Comín, and E. M. Bennett. 2014.
Interactions among ecosystem services across land uses in a
floodplain agroecosystem. Ecology and Society 19(1):20. http://
doi.org/10.5751/ES-06249-190120
Kull, C. A., X. Arnauld de Sartre, and M. Castro-Larrañaga.
2015. The political ecology of ecosystem services. Geoforum
61:122-134. http://
dx.doi.org/10.1016/j.geoforum.2015.03.004
Freeman, R. E. 1984. Stakeholder management: framework and
philosophy. Pitman, Mansfield, Massachusetts, USA.
Laterra, P., M. E. Orúe, and G. C. Booman. 2012. Spatial
complexity and ecosystem services in rural landscapes.
Agriculture, Ecosystems and Environment 154:56-67. http://doi.
org/10.1016/j.agee.2011.05.013 />agee.2011.05.013
Gould, R. K., S. C. Klain, N. M. Ardoin, T. Satterfield, U.
Woodside, N. Hannahs, G. C. Daily, and K. M. A. Chan. 2015.
A protocol for eliciting nonmaterial values through a cultural
ecosystem services frame. Conservation Biology 29(2):575-586.
/>Hall, T. E., J. O. Farnum, T. C. Slider, and K. Ludlow. 2009. New
approaches to forest planning: inventorying and mapping place
values in the Pacific Northwest Region. Research Note PNWRN-562. U.S. Forest Service, Portland, Oregon, USA. http://dx.
doi.org/10.2737/pnw-rn-562
Hatton-MacDonald, D., R. Bark, A. MacRae, T. Kalivas, A.
Grandgirard, and S. Strathearn. 2013. An interview methodology
for exploring the values that community leaders assign to
multiple-use landscapes. Ecology and Society 18(1):29. http://doi.
org/10.5751/ES-05191-180129 />Hauck, J., C. Görg, R. Varjopuro, O. Ratamäki, and K. Jax. 2013.
Benefits and limitations of the ecosystem services concept in
environmental policy and decision making: some stakeholder
perspectives. Environmental Science & Policy 25:13-21. http://doi.
org/10.1016/j.envsci.2012.08.001 />envsci.2012.08.001
Instituto Nacional de Estadísticas (INE). 2002. XVII Censo
Nacional de Población y VI de Vivienda 2002. INE, Santiago,
Chile.
Ives, C. D., and D. Kendal. 2014. The role of social values in the
management of ecological systems. Journal of Environmental
Management 144:67-72. />Kellert, S. R. 1995. The biological basis for human values of
nature. Pages 42-71 in S. R. Kellert and E. O. Wilson, editors. The
biophilia hypothesis. Island Press, Washington, D.C., USA.
Kenter, J. O., L. O’Brien, N. Hockley, N. Ravenscroft, I. Fazey,
K. N. Irvine, M. S Reed, M. Christie, E. Brady, R. Bryce, A.
Church, N. Cooper, A. Davies, A. Evely, M. Everard, R. Fish, J.
A. Fisher, N. Jobstvogt, C. Molloy, J. Orchard-Webb, S. Ranger,
M. Ryan, V. Watson, and S. Williams. 2015. What are shared and
social values of ecosystems? Ecological Economics 111:86-99.
/>Kenter, J. O., M. S. Reed, K. N. Irvine, E. O’Brien, E. Brady, R.
Bryce, M. Christie, A. Church, N. Cooper, A. Davies, N. Hockley,
I. Fazey, N. Jobstvogt, C. Molloy, J. Orchard-Webb, N.
Ravenscroft, M. Ryan, and V. Watson. 2014. UK National
López-Santiago, C. A., E. Oteros-Rozas, B. Martín-López, T.
Plieninger, E. G. Martín, and J. A. González. 2014. Using visual
stimuli to explore the social perceptions of ecosystem services in
cultural landscapes: the case of transhumance in Mediterranean
Spain. Ecology and Society 19(2):27. />es-06401-190227
Maass, J., P. Balvanera, A. Castillo, G. C. Daily, H. A. Mooney,
P. Ehrlich, M. Quesada, A. Miranda, V. J. Jaramillo, F. GarcíaOliva, A. Martínez-Yrizar, H. Cotler, J. López-Blanco, A. PérezJiménez, A. Búrquez, C. Tinoco, G. Ceballos, L. Barraza, R.
Ayala, and J. Sarukhán. 2005. Ecosystem services of tropical dry
forests: insights from long-term ecological and social research on
the Pacific Coast of Mexico. Ecology and Society 10(1):17.
Millennium Ecosystem Assessment (MEA). 2005. Ecosystems
and human well-being: synthesis. Island Press, Washington, D.C.,
USA. [online] URL: />documents/document.356.aspx.pdf
Ministerio de Economía, Fomento y Reconstrucción de Chile.
2005. Política Nacional de Turismo. Ministerio de Economía,
Fomento y Reconstrucción de Chile, Santiago, Chile
Ministerio de Economía, Fomento y Turismo de Chile. 2012.
Decreto 172. Procedimientos para la declaración de zonas de interés
turístico. Ministerio de Economía, Fomento y Reconstrucción de
Chile, Santiago, Chile
Mitchell, A. 2005. The ESRI guide to GIS analysis. Volume 2:
spatial measurements and statistics. ESRI, Redlands, California,
USA.
Municipalidad de Panguipulli. 2008. Plan de Desarrollo Comunal
Panguipulli 2008-2012. Panguipulli, Chile.
Municipalidad de Panguipulli. 2012. Plan de Ordenamiento
Territorial ZOIT. Panguipulli, Chile.
Nahuelhual, L., P. Laterra, S. Villarino, M. Mastrángelo, A.
Carmona, A. Jaramillo, P. Barral, and N. Burgos. 2015. Mapping
of ecosystem services: missing links between purposes and
procedures. Ecosystem Services 13:162-172. />j.ecoser.2015.03.005 />Nelson, E., G. Mendoza, J. Regetz, S. Polasky, H. Tallis, D. R.
Cameron, K. M. A. Chan, G. C. Daily, J. Goldstein, P. M. Kareiva,
Ecology and Society 21(3): 24
/>
E. Lonsdorf, R. Naidoo, T. H. Ricketts, and M. R. Shaw. 2009.
Modeling multiple ecosystem services, biodiversity conservation,
commodity production, and tradeoffs at landscape scales.
Frontiers in Ecology and the Environment 7:4-11 .
org/10.1890/080023
Spangenberg, J. H., C. von Haaren, and J. Settele. 2014. The
ecosystem service cascade: further developing the metaphor.
Integrating societal processes to accommodate social processes
and planning, and the case of bioenergy. Ecological Economics
104:22-32. />
Palomo, I., B. Martín-López, P. Zorrilla-Miras, D. García del
Amo, and C. Montes. 2014. Deliberative mapping of ecosystem
services within and around Doñana National Park (SW Spain)
in relation to land use change. Regional Environmental Change
14:237-251. />
Tapia, C. 2014. Identificación participativa de servicios
ecosistémicos en la comuna de Panguipulli. Tesis de Magíster.
Valdivia, Chile. Facultad de Ciencias Agrarias y Facultad de
Filosofía y Humanidades, Universidad Austral de Chile.
Pino-Piderit, A., P. Cardyn, Grupo de trabajo Panguipulli (GTP).
2014. La Reserva de la Biosfera de los Bosques Templados
Lluviosos de los Andes Australes y las singularidades territoriales
de la comuna de Panguipulli. Pages 190-206 in A. Moreira-Muñoz
and A. Borsdorf, editors. Reservas de la biósfera de Chile:
Laboratorios para la sustentabilidad. Austrian Academy of
Science, Innsbruck, Austria, and Pontificia Universidad de Chile,
Santiago de Chile, Chile.
Plieninger, T., S. Dijks, E. Oteros-Rozas, and C. Bieling. 2013.
Assessing, mapping, and quantifying cultural ecosystem services
at community level. Land use Policy 33:118-129. .
org/10.1016/j.landusepol.2012.12.013
Raymond, C. M., B. A. Bryan, D. Hatton-MacDonald, A. Cast,
S. Strathearn, A. Grandgirard, and T. Kalivas. 2009. Mapping
community values for natural capital and ecosystem services.
Ecological Economics 68:1301-1315. />ecolecon.2008.12.006
Raymond, C. M., J. O. Kenter, T. Plieninger, N. J. Turner, and K.
A. Alexander. 2014. Comparing instrumental and deliberative
paradigms underpinning the assessment of social values for
cultural ecosystem services. Ecological Economics 107:145-156.
/>Reed, M. S., A. Graves, N. Dandy, H. Posthumus, K. Hubacek,
J. Morris, C. Prell, C. H. Quinn, and L. C. Stringer. 2009. Who’s
in and why? A typology of stakeholder analysis methods for
natural resource management. Journal of Environmental
Management 90:1933-1949. />jenvman.2009.01.001 />Schnegg, M., R. Rieprich, and M. Pröpper. 2014. Culture, nature,
and the valuation of ecosystem services in Northern Namibia.
Ecology and Society 19(4):26. />es-06896-190426
Scholte, S. S. K., A. J. A. van Teeffelen, and P. H. Verburg. 2015.
Integrating socio-cultural perspectives into ecosystem service
valuation: a review of concepts and methods. Ecological
Economics 114:67-78. />Sherrouse, B. C., J. M. Clement, and D. J. Semmens. 2011. A GIS
application for assessing, mapping, and quantifying the social
values of ecosystem services. Applied Geography 31:748-760.
/>Sherrouse, B. C., D. J. Semmens, and J. M. Clement. 2014. An
application of social values for ecosystem services (SolVES) to
three national forests in Colorado and Wyoming. Ecological
Indicators 36:68-79. />
Tsirogianni, S., and G. Gaskell. 2011. The role of plurality and
context in social values. Journal for the Theory of Social Behaviour
41:441-465. />Van Riper, C. J., G. T. Kyle, S. G. Sutton, M. Barnes, and B. C.
Sherrouse. 2012. Mapping outdoor recreationists’ perceived
social values for ecosystem services at Hinchinbrook Island
National Park, Australia. Applied Geography 35:164-173. http://
dx.doi.org/10.1016/j.apgeog.2012.06.008
Villamagna, A. M., P. L. Angermeier, and E. M. Bennett. 2013.
Capacity, pressure, demand, and flow: a conceptual framework
for analyzing ecosystem service provision and delivery. Ecological
Complexity 15:114-121. />Villamor, G. B., I. Palomo, C. A. L. Santiago, E. Oteros-Rozas,
and J. Hill. 2014. Assessing stakeholders’ perceptions and values
towards social-ecological systems using participatory methods.
Ecological Processes 3:1-12. />Wackernagel, M., and W. E. Rees. 1997. Perceptual and structural
barriers to investing in natural capital: economics from an
ecological footprint perspective. Ecological economics 20:3-24.
/>Wilson, E. O. 1984. Biophilia. Harvard University Press,
Cambridge, Massachusetts, USA.
Wong, C. P., B. Jiang, A. P. Kinzig, K. N. Lee, and Z. Ouyang.
2015. Linking ecosystem characteristics to final ecosystem
services for public policy. Ecology Letters 18:108-118. http://doi.
org/10.1111/ele.12389