Solution manual mechanics of materials 8th edition hibbeler chapter 03
Bạn đang xem bản rút gọn của tài liệu. Xem và tải ngay bản đầy đủ của tài liệu tại đây (1.76 MB, 31 trang )
03 Solutions 46060
5/7/10
8:45 AM
Page 1
© 2010 Pearson Education, Inc., Upper Saddle River, NJ. All rights reserved. This material is protected under all copyright laws as they currently
exist. No portion of this material may be reproduced, in any form or by any means, without permission in writing from the publisher.
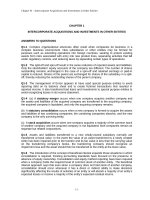
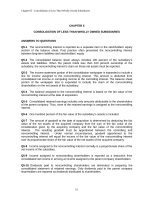
•3–1.
A concrete cylinder having a diameter of 6.00 in. and
gauge length of 12 in. is tested in compression. The results of
the test are reported in the table as load versus contraction.
Draw the stress–strain diagram using scales of 1 in. = 0.5 ksi
and 1 in. = 0.2110-32 in.>in. From the diagram, determine
approximately the modulus of elasticity.
Stress and Strain:
s =
P
(ksi)
A
e =
dL
(in./in.)
L
0
0
0.177
0.00005
0.336
0.00010
0.584
0.000167
0.725
0.000217
0.902
0.000283
1.061
0.000333
1.220
0.000375
1.362
0.000417
1.645
0.000517
1.768
0.000583
1.874
0.000625
Modulus of Elasticity: From the stress–strain diagram
Eapprox =
1.31 - 0
= 3.275 A 103 B ksi
0.0004 - 0
Ans.
1
Load (kip)
Contraction (in.)
0
5.0
9.5
16.5
20.5
25.5
30.0
34.5
38.5
46.5
50.0
53.0
0
0.0006
0.0012
0.0020
0.0026
0.0034
0.0040
0.0045
0.0050
0.0062
0.0070
0.0075
03 Solutions 46060
5/7/10
8:45 AM
Page 2
© 2010 Pearson Education, Inc., Upper Saddle River, NJ. All rights reserved. This material is protected under all copyright laws as they currently
exist. No portion of this material may be reproduced, in any form or by any means, without permission in writing from the publisher.
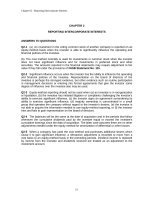
3–2. Data taken from a stress–strain test for a ceramic are
given in the table. The curve is linear between the origin and
the first point. Plot the diagram, and determine the modulus
of elasticity and the modulus of resilience.
Modulus of Elasticity: From the stress–strain diagram
E =
33.2 - 0
= 55.3 A 103 B ksi
0.0006 - 0
S (ksi)
P (in./in.)
0
33.2
45.5
49.4
51.5
53.4
0
0.0006
0.0010
0.0014
0.0018
0.0022
S (ksi)
P (in./in.)
0
33.2
45.5
49.4
51.5
53.4
0
0.0006
0.0010
0.0014
0.0018
0.0022
Ans.
Modulus of Resilience: The modulus of resilience is equal to the area under the
linear portion of the stress–strain diagram (shown shaded).
ut =
1
lb
in.
in # lb
(33.2) A 103 B ¢ 2 ≤ ¢ 0.0006
≤ = 9.96
2
in.
in
in3
Ans.
3–3. Data taken from a stress–strain test for a ceramic are
given in the table. The curve is linear between the origin
and the first point. Plot the diagram, and determine
approximately the modulus of toughness. The rupture stress
is sr = 53.4 ksi.
Modulus of Toughness: The modulus of toughness is equal to the area under the
stress–strain diagram (shown shaded).
(ut)approx =
lb
in.
1
(33.2) A 103 B ¢ 2 ≤ (0.0004 + 0.0010) ¢ ≤
2
in.
in
+ 45.5 A 103 B ¢
+
1
lb
in.
(7.90) A 103 B ¢ 2 ≤ (0.0012) ¢ ≤
2
in.
in
+
= 85.0
lb
in.
≤ (0.0012) ¢ ≤
in.
in2
1
lb
in.
(12.3) A 103 B ¢ 2 ≤ (0.0004) ¢ ≤
2
in.
in
in # lb
in3
Ans.
2
03 Solutions 46060
5/7/10
8:45 AM
Page 3
© 2010 Pearson Education, Inc., Upper Saddle River, NJ. All rights reserved. This material is protected under all copyright laws as they currently
exist. No portion of this material may be reproduced, in any form or by any means, without permission in writing from the publisher.
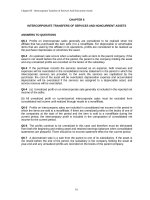
*3–4. A tension test was performed on a specimen having
an original diameter of 12.5 mm and a gauge length of
50 mm. The data are listed in the table. Plot the stress–strain
diagram, and determine approximately the modulus of
elasticity, the ultimate stress, and the fracture stress. Use a
scale of 20 mm = 50 MPa and 20 mm = 0.05 mm>mm.
Redraw the linear-elastic region, using the same stress scale
but a strain scale of 20 mm = 0.001 mm>mm.
Stress and Strain:
s =
dL
P
(MPa) e =
(mm/mm)
A
L
0
0
90.45
0.00035
259.9
0.00120
308.0
0.00204
333.3
0.00330
355.3
0.00498
435.1
0.02032
507.7
0.06096
525.6
0.12700
507.7
0.17780
479.1
0.23876
Modulus of Elasticity: From the stress–strain diagram
(E)approx =
228.75(106) - 0
= 229 GPa
0.001 - 0
Ans.
Ultimate and Fracture Stress: From the stress–strain diagram
(sm)approx = 528 MPa
Ans.
(sf)approx = 479 MPa
Ans.
3
Load (kN)
Elongation (mm)
0
11.1
31.9
37.8
40.9
43.6
53.4
62.3
64.5
62.3
58.8
0
0.0175
0.0600
0.1020
0.1650
0.2490
1.0160
3.0480
6.3500
8.8900
11.9380
03 Solutions 46060
5/7/10
8:45 AM
Page 4
© 2010 Pearson Education, Inc., Upper Saddle River, NJ. All rights reserved. This material is protected under all copyright laws as they currently
exist. No portion of this material may be reproduced, in any form or by any means, without permission in writing from the publisher.
3–5. A tension test was performed on a steel specimen
having an original diameter of 12.5 mm and gauge length
of 50 mm. Using the data listed in the table, plot the
stress–strain diagram, and determine approximately the
modulus of toughness. Use a scale of 20 mm = 50 MPa and
20 mm = 0.05 mm>mm.
Stress and Strain:
s =
P
dL
(MPa) e =
(mm/mm)
A
L
0
0
90.45
0.00035
259.9
0.00120
308.0
0.00204
333.3
0.00330
355.3
0.00498
435.1
0.02032
507.7
0.06096
525.6
0.12700
507.7
0.17780
479.1
0.23876
Modulus of Toughness: The modulus of toughness is equal to the
total area under the stress–strain diagram and can be
approximated by counting the number of squares. The total
number of squares is 187.
(ut)approx = 187(25) A 106 B ¢
N
m
≤ a 0.025 b = 117 MJ>m3
m
m2
Ans.
4
Load (kN)
Elongation (mm)
0
11.1
31.9
37.8
40.9
43.6
53.4
62.3
64.5
62.3
58.8
0
0.0175
0.0600
0.1020
0.1650
0.2490
1.0160
3.0480
6.3500
8.8900
11.9380
03 Solutions 46060
5/7/10
8:45 AM
Page 5
© 2010 Pearson Education, Inc., Upper Saddle River, NJ. All rights reserved. This material is protected under all copyright laws as they currently
exist. No portion of this material may be reproduced, in any form or by any means, without permission in writing from the publisher.
3–6. A specimen is originally 1 ft long, has a diameter of
0.5 in., and is subjected to a force of 500 lb. When the force
is increased from 500 lb to 1800 lb, the specimen elongates
0.009 in. Determine the modulus of elasticity for the
material if it remains linear elastic.
Normal Stress and Strain: Applying s =
s1 =
s2 =
¢e =
0.500
p
2
4 (0.5 )
1.80
p
2
4 (0.5 )
dL
P
and e =
.
A
L
= 2.546 ksi
= 9.167 ksi
0.009
= 0.000750 in.>in.
12
Modulus of Elasticity:
E =
¢s
9.167 - 2.546
=
= 8.83 A 103 B ksi
¢e
0.000750
Ans.
3–7. A structural member in a nuclear reactor is made of a
zirconium alloy. If an axial load of 4 kip is to be supported
by the member, determine its required cross-sectional area.
Use a factor of safety of 3 relative to yielding. What is the
load on the member if it is 3 ft long and its elongation is
0.02 in.? Ezr = 14(103) ksi, sY = 57.5 ksi. The material has
elastic behavior.
Allowable Normal Stress:
F.S. =
3 =
sy
sallow
57.5
sallow
sallow = 19.17 ksi
sallow =
P
A
19.17 =
4
A
A = 0.2087 in2 = 0.209 in2
Ans.
Stress–Strain Relationship: Applying Hooke’s law with
e =
0.02
d
=
= 0.000555 in.>in.
L
3 (12)
s = Ee = 14 A 103 B (0.000555) = 7.778 ksi
Normal Force: Applying equation s =
P
.
A
P = sA = 7.778 (0.2087) = 1.62 kip
Ans.
5
03 Solutions 46060
5/7/10
8:45 AM
Page 6
© 2010 Pearson Education, Inc., Upper Saddle River, NJ. All rights reserved. This material is protected under all copyright laws as they currently
exist. No portion of this material may be reproduced, in any form or by any means, without permission in writing from the publisher.
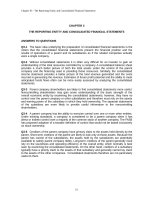
*3–8. The strut is supported by a pin at C and an A-36
steel guy wire AB. If the wire has a diameter of 0.2 in.,
determine how much it stretches when the distributed load
acts on the strut.
A
60Њ
200 lb/ft
a + ©MC = 0;
1
FAB cos 60°(9) - (200)(9)(3) = 0
2
9 ft
FAB = 600 lb
The normal stress the wire is
sAB =
FAB
=
AAB
p
4
600
= 19.10(103) psi = 19.10 ksi
(0.22)
Since sAB 6 sy = 36 ksi, Hooke’s Law can be applied to determine the strain
in wire.
sAB = EPAB;
19.10 = 29.0(103)PAB
PAB = 0.6586(10 - 3) in>in
9(12)
The unstretched length of the wire is LAB =
= 124.71 in. Thus, the wire
sin 60°
stretches
dAB = PAB LAB = 0.6586(10 - 3)(124.71)
= 0.0821 in.
Ans.
6
B
C
Here, we are only interested in determining the force in wire AB.
03 Solutions 46060
5/7/10
8:45 AM
Page 7
© 2010 Pearson Education, Inc., Upper Saddle River, NJ. All rights reserved. This material is protected under all copyright laws as they currently
exist. No portion of this material may be reproduced, in any form or by any means, without permission in writing from the publisher.
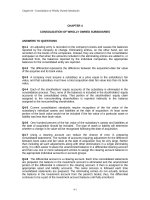
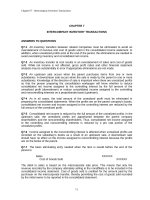
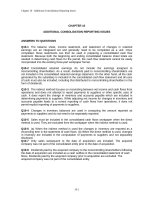
The s –P diagram for a collagen fiber bundle from
which a human tendon is composed is shown. If a segment
of the Achilles tendon at A has a length of 6.5 in. and an
approximate cross-sectional area of 0.229 in2, determine its
elongation if the foot supports a load of 125 lb, which causes
a tension in the tendon of 343.75 lb.
•3–9.
s =
s (ksi)
4.50
A
3.75
3.00
2.25
1.50
P
343.75
=
= 1.50 ksi
A
0.229
125 lb
0.75
0.05
From the graph e = 0.035 in.>in.
d = eL = 0.035(6.5) = 0.228 in.
0.10
P (in./in.)
Ans.
s (ksi)
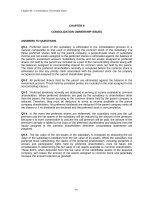
3–10. The stress–strain diagram for a metal alloy having an
original diameter of 0.5 in. and a gauge length of 2 in. is given
in the figure. Determine approximately the modulus of
elasticity for the material, the load on the specimen that causes
yielding, and the ultimate load the specimen will support.
105
90
75
60
From the stress–strain diagram, Fig. a,
45
60 ksi - 0
E
=
;
1
0.002 - 0
sy = 60 ksi
E = 30.0(103) ksi
Ans.
30
15
su>t = 100 ksi
0
Thus,
PY = sYA = 60 C p4 (0.52) D = 11.78 kip = 11.8 kip
Ans.
Pu>t = su>t A = 100 C p4 (0.52) D = 19.63 kip = 19.6 kip
Ans.
7
0
0
0.05 0.10 0.15 0.20 0.25 0.30 0.35
0.001 0.002 0.003 0.004 0.005 0.006 0.007
P (in./in.)
03 Solutions 46060
5/7/10
8:45 AM
Page 8
© 2010 Pearson Education, Inc., Upper Saddle River, NJ. All rights reserved. This material is protected under all copyright laws as they currently
exist. No portion of this material may be reproduced, in any form or by any means, without permission in writing from the publisher.
s (ksi)
3–11. The stress–strain diagram for a steel alloy having an
original diameter of 0.5 in. and a gauge length of 2 in. is
given in the figure. If the specimen is loaded until it is
stressed to 90 ksi, determine the approximate amount of
elastic recovery and the increase in the gauge length after it
is unloaded.
105
90
75
60
45
30
15
0
From the stress–strain diagram Fig. a, the modulus of elasticity for the steel alloy is
E
60 ksi - 0
=
;
1
0.002 - 0
E = 30.0(103) ksi
when the specimen is unloaded, its normal strain recovered along line AB, Fig. a,
which has a gradient of E. Thus
Elastic Recovery =
90
90 ksi
= 0.003 in>in
=
E
30.0(103) ksi
Ans.
Thus, the permanent set is
PP = 0.05 - 0.003 = 0.047 in>in
Then, the increase in gauge length is
¢L = PPL = 0.047(2) = 0.094 in
Ans.
8
0
0
0.05 0.10 0.15 0.20 0.25 0.30 0.35
0.001 0.002 0.003 0.004 0.005 0.006 0.007
P (in./in.)
03 Solutions 46060
5/7/10
8:45 AM
Page 9
© 2010 Pearson Education, Inc., Upper Saddle River, NJ. All rights reserved. This material is protected under all copyright laws as they currently
exist. No portion of this material may be reproduced, in any form or by any means, without permission in writing from the publisher.
*3–12. The stress–strain diagram for a steel alloy having an
original diameter of 0.5 in. and a gauge length of 2 in.
is given in the figure. Determine approximately the modulus
of resilience and the modulus of toughness for the material.
The Modulus of resilience is equal to the area under the stress–strain diagram up to
the proportional limit.
sPL = 60 ksi
PPL = 0.002 in>in.
Thus,
(ui)r =
1
1
in # lb
sPLPPL = C 60(103) D (0.002) = 60.0
2
2
in3
Ans.
The modulus of toughness is equal to the area under the entire stress–strain
diagram. This area can be approximated by counting the number of squares. The
total number is 38. Thus,
C (ui)t D approx = 38 c 15(103)
lb
in
in # lb
d a0.05 b = 28.5(103)
2
in
in
in3
s (ksi)
105
90
75
60
45
30
15
0
0
0
0.05 0.10 0.15 0.20 0.25 0.30 0.35
0.001 0.002 0.003 0.004 0.005 0.006 0.007
P (in./in.)
9
Ans.
03 Solutions 46060
5/7/10
8:45 AM
Page 10
© 2010 Pearson Education, Inc., Upper Saddle River, NJ. All rights reserved. This material is protected under all copyright laws as they currently
exist. No portion of this material may be reproduced, in any form or by any means, without permission in writing from the publisher.
•3–13.
A bar having a length of 5 in. and cross-sectional
area of 0.7 in2 is subjected to an axial force of 8000 lb. If the
bar stretches 0.002 in., determine the modulus of elasticity
of the material. The material has linear-elastic behavior.
8000 lb
8000 lb
5 in.
Normal Stress and Strain:
8.00
P
=
= 11.43 ksi
A
0.7
s =
e =
dL
0.002
=
= 0.000400 in.>in.
L
5
Modulus of Elasticity:
E =
s
11.43
=
= 28.6(103) ksi
e
0.000400
Ans.
3–14. The rigid pipe is supported by a pin at A and an
A-36 steel guy wire BD. If the wire has a diameter of
0.25 in., determine how much it stretches when a load of
P = 600 lb acts on the pipe.
B
Here, we are only interested in determining the force in wire BD. Referring 4 ft
to the FBD in Fig. a
a + ©MA = 0;
FBD A 45 B (3) - 600(6) = 0
FBD = 1500 lb
A
sBD
3 ft
1500
= 30.56(103) psi = 30.56 ksi
p
2
(0.25
)
4
Since sBD 6 sy = 36 ksi, Hooke’s Law can be applied to determine the strain in
the wire.
sBD = EPBD;
D
C
The normal stress developed in the wire is
FBD
=
=
ABD
P
30.56 = 29.0(103)PBD
PBD = 1.054(10 - 3) in.>in.
The unstretched length of the wire is LBD = 232 + 42 = 5ft = 60 in. Thus, the
wire stretches
dBD = PBD LBD = 1.054(10 - 3)(60)
= 0.0632 in
Ans.
10
3 ft
03 Solutions 46060
5/7/10
8:45 AM
Page 11
© 2010 Pearson Education, Inc., Upper Saddle River, NJ. All rights reserved. This material is protected under all copyright laws as they currently
exist. No portion of this material may be reproduced, in any form or by any means, without permission in writing from the publisher.
3–15. The rigid pipe is supported by a pin at A and an
A-36 guy wire BD. If the wire has a diameter of 0.25 in.,
determine the load P if the end C is displaced 0.075 in.
downward.
B
4 ft
P
A
D
C
3 ft
Here, we are only interested in determining the force in wire BD. Referring to the
FBD in Fig. a
FBD A 45 B (3) - P(6) = 0
a + ©MA = 0;
FBD = 2.50 P
The unstretched length for wire BD is LBD = 232 + 42 = 5 ft = 60 in. From the
geometry shown in Fig. b, the stretched length of wire BD is
LBD¿ = 2602 + 0.0752 - 2(60)(0.075) cos 143.13° = 60.060017
Thus, the normal strain is
PBD =
LBD¿ - LBD
60.060017 - 60
=
= 1.0003(10 - 3) in.>in.
LBD
60
Then, the normal stress can be obtain by applying Hooke’s Law.
sBD = EPBD = 29(103) C 1.0003(10 - 3) D = 29.01 ksi
Since sBD 6 sy = 36 ksi, the result is valid.
sBD =
FBD
;
ABD
29.01(103) =
2.50 P
(0.252)
p
4
P = 569.57 lb = 570 lb
Ans.
11
3 ft
03 Solutions 46060
5/7/10
8:45 AM
Page 12
© 2010 Pearson Education, Inc., Upper Saddle River, NJ. All rights reserved. This material is protected under all copyright laws as they currently
exist. No portion of this material may be reproduced, in any form or by any means, without permission in writing from the publisher.
s (MPa)
*3–16. Determine the elongation of the square hollow bar
when it is subjected to the axial force P = 100 kN. If this
axial force is increased to P = 360 kN and released, find
the permanent elongation of the bar. The bar is made of a
metal alloy having a stress–strain diagram which can be
approximated as shown.
500
600 mm
P
250
50 mm
5 mm
0.00125
Normal Stress and Strain: The cross-sectional area of the hollow bar is
A = 0.052 - 0.042 = 0.9(10 - 3)m2. When P = 100 kN,
s1 =
100(103)
P
= 111.11 MPa
=
A
0.9(10 - 3)
From the stress–strain diagram shown in Fig. a, the slope of the straight line OA
which represents the modulus of elasticity of the metal alloy is
E =
250(106) - 0
= 200 GPa
0.00125 - 0
Since s1 6 250 MPa, Hooke’s Law can be applied. Thus
s1 = Ee1; 111.11(106) = 200(109)e1
e1 = 0.5556(10 - 3) mm>mm
Thus, the elongation of the bar is
d1 = e1L = 0.5556(10 - 3)(600) = 0.333 mm
Ans.
When P = 360 kN,
s2 =
360(103)
P
= 400 MPa
=
A
0.9(10 - 3)
From the geometry of the stress–strain diagram, Fig. a,
e2 - 0.00125
0.05 - 0.00125
=
400 - 250
500 - 250
e2 = 0.0305 mm>mm
When P = 360 kN is removed, the strain recovers linearly along line BC, Fig. a,
parallel to OA. Thus, the elastic recovery of strain is given by
s2 = Eer;
400(106) = 200(109)er
er = 0.002 mm>mm
The permanent set is
eP = e2 - er = 0.0305 - 0.002 = 0.0285 mm>mm
Thus, the permanent elongation of the bar is
dP = ePL = 0.0285(600) = 17.1 mm
Ans.
12
0.05
P (mm/mm)
50 mm
P
5 mm
03 Solutions 46060
5/7/10
8:45 AM
Page 13
© 2010 Pearson Education, Inc., Upper Saddle River, NJ. All rights reserved. This material is protected under all copyright laws as they currently
exist. No portion of this material may be reproduced, in any form or by any means, without permission in writing from the publisher.
3–16. Continued
13
03 Solutions 46060
5/7/10
8:45 AM
Page 14
© 2010 Pearson Education, Inc., Upper Saddle River, NJ. All rights reserved. This material is protected under all copyright laws as they currently
exist. No portion of this material may be reproduced, in any form or by any means, without permission in writing from the publisher.
s (ksi)
3–17. A tension test was performed on an aluminum
2014-T6 alloy specimen. The resulting stress–strain diagram
is shown in the figure. Estimate (a) the proportional limit,
(b) the modulus of elasticity, and (c) the yield strength
based on a 0.2% strain offset method.
70
60
50
40
30
20
10
0
0.02
0.002
Proportional Limit and Yield Strength: From the stress–strain diagram, Fig. a,
spl = 44 ksi
Ans.
sY = 60 ksi
Ans.
Modulus of Elasticity: From the stress–strain diagram, the corresponding strain for
sPL = 44 ksi is epl = 0.004 in.>in. Thus,
E =
44 - 0
= 11.0(103) ksi
0.004 - 0
Ans.
Modulus of Resilience: The modulus of resilience is equal to the area under the
14
0.04
0.004
0.06
0.006
0.08
0.008
0.10
0.010
P (in./in.)
03 Solutions 46060
5/7/10
8:45 AM
Page 15
© 2010 Pearson Education, Inc., Upper Saddle River, NJ. All rights reserved. This material is protected under all copyright laws as they currently
exist. No portion of this material may be reproduced, in any form or by any means, without permission in writing from the publisher.
s (ksi)
3–18. A tension test was performed on an aluminum
2014-T6 alloy specimen. The resulting stress–strain
diagram is shown in the figure. Estimate (a) the modulus of
resilience; and (b) modulus of toughness.
70
60
50
40
30
20
10
0
0.02
0.002
0.04
0.004
0.06
0.006
0.08
0.008
0.10
0.010
P (in./in.)
stress–strain diagram up to the proportional limit. From the stress–strain diagram,
spl = 44 ksi
epl = 0.004 in.>in.
Thus,
A Ui B r = splepl = (44)(103)(0.004) = 88
1
2
1
2
in # lb
in3
Ans.
Modulus of Toughness: The modulus of toughness is equal to the area under the
entire stress–strain diagram. This area can be approximated by counting the number
of squares. The total number of squares is 65. Thus,
C A Ui B t D approx = 65 B 10(103)
lb
in.
in # lb
c0.01 d = 6.50(103)
2R
in.
in
in3
Ans.
The stress–strain diagram for a bone is shown, and can be described by the equation
3–19. The stress–strain diagram for a bone is shown, and
can be described by the equation P = 0.45110-62 s ϩ
0.36110-122 s3, where s is in kPa. Determine the yield
strength assuming a 0.3% offset.
P
s
P ϭ 0.45(10Ϫ6)s + 0.36(10Ϫ12)s3
P
e = 0.45(10-6)s + 0.36(10-12)s3,
dP = A 0.45(10-6) + 1.08(10-12) s2 B ds
E =
ds
1
2 =
= 2.22 MPa
dP
0.45(10 - 6)
Ans.
s=0
15
P
03 Solutions 46060
5/7/10
8:45 AM
Page 16
© 2010 Pearson Education, Inc., Upper Saddle River, NJ. All rights reserved. This material is protected under all copyright laws as they currently
exist. No portion of this material may be reproduced, in any form or by any means, without permission in writing from the publisher.
*3–20. The stress–strain diagram for a bone is shown and
can be described by the equation P = 0.45110-62 s ϩ
0.36110-122 s3, where s is in kPa. Determine the modulus
of toughness and the amount of elongation of a 200-mmlong region just before it fractures if failure occurs at
P = 0.12 mm>mm.
P
s
P ϭ 0.45(10Ϫ6)s + 0.36(10Ϫ12)s3
P
When e = 0.12
120(103) = 0.45 s + 0.36(10-6)s3
Solving for the real root:
s = 6873.52 kPa
6873.52
ut =
LA
dA =
L0
(0.12 - e)ds
6873.52
ut =
L0
(0.12 - 0.45(10-6)s - 0.36(10-12)s3)ds
6873.52
= 0.12 s - 0.225(10-6)s2 - 0.09(10-12)s4|0
= 613 kJ>m3
Ans.
d = eL = 0.12(200) = 24 mm
Ans.
16
P
03 Solutions 46060
5/7/10
8:45 AM
Page 17
© 2010 Pearson Education, Inc., Upper Saddle River, NJ. All rights reserved. This material is protected under all copyright laws as they currently
exist. No portion of this material may be reproduced, in any form or by any means, without permission in writing from the publisher.
•3–21.
The stress–strain diagram for a polyester resin
is given in the figure. If the rigid beam is supported by a
strut AB and post CD, both made from this material, and
subjected to a load of P = 80 kN, determine the angle
of tilt of the beam when the load is applied. The diameter of
the strut is 40 mm and the diameter of the post is 80 mm.
B
2m
P
A
C
0.75 m 0.75 m
D
0.5 m
From the stress–strain diagram,
E =
32.2(10)6
= 3.22(109) Pa
0.01
s (MPa)
100
95
Thus,
70
60
40(10 )
FAB
= p
= 31.83 MPa
2
AAB
4 (0.04)
sAB =
eAB
50
31.83(106)
sAB
= 0.009885 mm>mm
=
=
E
3.22(109)
20
0
7.958(106)
sCD
= 0.002471 mm>mm
=
E
3.22(109)
dAB = eABLAB = 0.009885(2000) = 19.771 mm
dCD = eCDLCD = 0.002471(500) = 1.236 mm
Angle of tilt a:
tan a =
18.535
;
1500
tension
40
32.2
40(103)
FCD
= p
= 7.958 MPa
2
ACD
4 (0.08)
sCD =
eCD =
compression
80
3
a = 0.708°
Ans.
17
0
0.01 0.02 0.03 0.04
P (mm/mm)
03 Solutions 46060
5/7/10
8:45 AM
Page 18
© 2010 Pearson Education, Inc., Upper Saddle River, NJ. All rights reserved. This material is protected under all copyright laws as they currently
exist. No portion of this material may be reproduced, in any form or by any means, without permission in writing from the publisher.
3–22. The stress–strain diagram for a polyester resin is
given in the figure. If the rigid beam is supported by a strut
AB and post CD made from this material, determine the
largest load P that can be applied to the beam before it
ruptures. The diameter of the strut is 12 mm and the
diameter of the post is 40 mm.
B
2m
P
Rupture of strut AB:
sR =
FAB
;
AAB
50(106) =
P>2
A
;
p
2
4 (0.012)
0.75 m 0.75 m
P = 11.3 kN (controls)
D
0.5 m
Ans.
s (MPa)
Rupture of post CD:
FCD
;
sR =
ACD
C
95(10 ) =
100
95
P>2
6
p
2
4 (0.04)
compression
80
70
60
P = 239 kN
50
tension
40
32.2
20
0
0
0.01 0.02 0.03 0.04
P (mm/mm)
s (ksi)
3–23. By adding plasticizers to polyvinyl chloride, it is
possible to reduce its stiffness. The stress–strain diagrams
for three types of this material showing this effect are given
below. Specify the type that should be used in the
manufacture of a rod having a length of 5 in. and a diameter
of 2 in., that is required to support at least an axial load of
20 kip and also be able to stretch at most 14 in.
15
P
unplasticized
10
copolymer
flexible
5
(plasticized)
Normal Stress:
P
P
s =
=
A
20
p 2 = 6.366 ksi
(2
)
4
0
0
Normal Strain:
e =
0.25
= 0.0500 in.>in.
5
From the stress–strain diagram, the copolymer will satisfy both stress and strain
requirements.
Ans.
18
0.10
0.20
0.30
P (in./in.)
03 Solutions 46060
5/7/10
8:45 AM
Page 19
© 2010 Pearson Education, Inc., Upper Saddle River, NJ. All rights reserved. This material is protected under all copyright laws as they currently
exist. No portion of this material may be reproduced, in any form or by any means, without permission in writing from the publisher.
*3–24. The stress–strain diagram for many metal alloys
can be described analytically using the Ramberg-Osgood
three parameter equation P = s>E + ksn, where E, k, and
n are determined from measurements taken from the
diagram. Using the stress–strain diagram shown in the
figure, take E = 3011032 ksi and determine the other two
parameters k and n and thereby obtain an analytical
expression for the curve.
s (ksi)
80
60
40
20
0.1
0.2
0.3
0.4
0.5
P (10–6)
Choose,
s = 40 ksi,
e = 0.1
s = 60 ksi,
e = 0.3
0.1 =
40
+ k(40)n
30(103)
0.3 =
60
+ k(60)n
30(103)
0.098667 = k(40)n
0.29800 = k(60)n
0.3310962 = (0.6667)n
ln (0.3310962) = n ln (0.6667)
n = 2.73
Ans.
k = 4.23(10-6)
Ans.
•3–25.
The acrylic plastic rod is 200 mm long and 15 mm in
diameter. If an axial load of 300 N is applied to it, determine
the change in its length and the change in its diameter.
Ep = 2.70 GPa, np = 0.4.
s =
P
=
A
elong =
300
p
2
4 (0.015)
300 N
300 N
200 mm
= 1.697 MPa
1.697(106)
s
= 0.0006288
=
E
2.70(109)
d = elong L = 0.0006288 (200) = 0.126 mm
Ans.
elat = -Velong = -0.4(0.0006288) = -0.0002515
¢d = elatd = -0.0002515 (15) = -0.00377 mm
Ans.
19
03 Solutions 46060
5/7/10
8:45 AM
Page 20
© 2010 Pearson Education, Inc., Upper Saddle River, NJ. All rights reserved. This material is protected under all copyright laws as they currently
exist. No portion of this material may be reproduced, in any form or by any means, without permission in writing from the publisher.
3–26. The short cylindrical block of 2014-T6 aluminum,
having an original diameter of 0.5 in. and a length of 1.5 in.,
is placed in the smooth jaws of a vise and squeezed until the
axial load applied is 800 lb. Determine (a) the decrease in its
length and (b) its new diameter.
800 lb
800 lb
a)
s =
P
=
A
elong =
p
4
800
= 4074.37 psi
(0.5)2
s
-4074.37
= -0.0003844
=
E
10.6(106)
d = elong L = -0.0003844 (1.5) = -0.577 (10 - 3) in.
Ans.
b)
V =
-elat
= 0.35
elong
elat = -0.35 (-0.0003844) = 0.00013453
¢d = elat d = 0.00013453 (0.5) = 0.00006727
d¿ = d + ¢d = 0.5000673 in.
Ans.
s(MPa)
3–27. The elastic portion of the stress–strain diagram for a
steel alloy is shown in the figure. The specimen from which
it was obtained had an original diameter of 13 mm and a
gauge length of 50 mm. When the applied load on the
specimen is 50 kN, the diameter is 12.99265 mm. Determine
Poisson’s ratio for the material.
400
Normal Stress:
s =
P
=
A
50(103)
p
4
(0.0132)
= 376.70 Mpa
0.002
Normal Strain: From the stress–strain diagram, the modulus of elasticity
400(106)
= 200 GPa. Applying Hooke’s law
E =
0.002
elong =
elat =
376.70(106)
s
= 1.8835 A 10 - 3 B mm>mm
=
E
200(104)
d - d0
12.99265 - 13
=
= -0.56538 A 10 - 3 B mm>mm
d0
13
Poisson’s Ratio: The lateral and longitudinal strain can be related using Poisson’s
ratio.
V = -
-0.56538(10 - 3)
elat
= 0.300
= elong
1.8835(10 - 3)
Ans.
20
P(mm/mm)
03 Solutions 46060
5/7/10
8:45 AM
Page 21
© 2010 Pearson Education, Inc., Upper Saddle River, NJ. All rights reserved. This material is protected under all copyright laws as they currently
exist. No portion of this material may be reproduced, in any form or by any means, without permission in writing from the publisher.
s(MPa)
*3–28. The elastic portion of the stress–strain diagram for
a steel alloy is shown in the figure. The specimen from
which it was obtained had an original diameter of 13 mm
and a gauge length of 50 mm. If a load of P = 20 kN is
applied to the specimen, determine its diameter and gauge
length. Take n = 0.4.
400
Normal Stress:
s =
P
=
A
20(103)
p
4
(0.0132)
= 150.68Mpa
0.002
P(mm/mm)
Normal Strain: From the Stress–Strain diagram, the modulus of elasticity
400(106)
E =
= 200 GPa. Applying Hooke’s Law
0.002
elong =
150.68(106)
s
= 0.7534 A 10 - 3 B mm>mm
=
E
200(109)
Thus,
dL = elong L0 = 0.7534 A 10 - 3 B (50) = 0.03767 mm
L = L0 + dL = 50 + 0.03767 = 50.0377 mm
Ans.
Poisson’s Ratio: The lateral and longitudinal can be related using poisson’s ratio.
elat = -velong = -0.4(0.7534) A 10 - 3 B
= -0.3014 A 10 - 3 B mm>mm
dd = elat d = -0.3014 A 10 - 3 B (13) = -0.003918 mm
d = d0 + dd = 13 + ( -0.003918) = 12.99608 mm
Ans.
•3–29.
The aluminum block has a rectangular cross
section and is subjected to an axial compressive force of
8 kip. If the 1.5-in. side changed its length to 1.500132 in.,
determine Poisson’s ratio and the new length of the 2-in.
side. Eal ϭ 10(103) ksi.
s =
elat =
2 in.
8 kip
8 kip
3 in.
P
8
=
= 2.667 ksi
A
(2)(1.5)
elong =
v =
1.5 in.
s
-2.667
= -0.0002667
=
E
10(103)
1.500132 - 1.5
= 0.0000880
1.5
-0.0000880
= 0.330
-0.0002667
Ans.
h¿ = 2 + 0.0000880(2) = 2.000176 in.
Ans.
21
03 Solutions 46060
5/7/10
8:45 AM
Page 22
© 2010 Pearson Education, Inc., Upper Saddle River, NJ. All rights reserved. This material is protected under all copyright laws as they currently
exist. No portion of this material may be reproduced, in any form or by any means, without permission in writing from the publisher.
3–30. The block is made of titanium Ti-6A1-4V and is
subjected to a compression of 0.06 in. along the y axis, and its
shape is given a tilt of u = 89.7°. Determine Px, Py, and gxy.
y
Normal Strain:
ey =
4 in. u
dLy
Ly
=
-0.06
= -0.0150 in.>in.
4
Ans.
Poisson’s Ratio: The lateral and longitudinal strain can be related using Poisson’s ratio.
x
5 in.
ex = -vey = -0.36(-0.0150)
= 0.00540 in. >in.
Ans.
Shear Strain:
b = 180° - 89.7° = 90.3° = 1.576032 rad
gxy =
p
p
- b =
- 1.576032 = -0.00524 rad
2
2
Ans.
3–31. The shear stress–strain diagram for a steel alloy is
shown in the figure. If a bolt having a diameter of 0.75 in.
is made of this material and used in the double lap joint,
determine the modulus of elasticity E and the force P
required to cause the material to yield. Take n = 0.3.
P/2
P/2
P
t(ksi)
60
The shear force developed on the shear planes of the bolt can be determined by
considering the equilibrium of the FBD shown in Fig. a
+ ©F = 0;
:
x
V + V - P = 0
V = =
g(rad)
P
0.00545
2
From the shear stress–strain diagram, the yield stress is ty = 60 ksi. Thus,
ty =
Vy
A
;
60 =
P>2
p
4
A 0.752 B
P = 53.01 kip = 53.0 kip
Ans.
From the shear stress–strain diagram, the shear modulus is
G =
60 ksi
= 11.01(103) ksi
0.00545
Thus, the modulus of elasticity is
G =
E
;
2(1 + y)
11.01(103) =
E
2(1 + 0.3)
E = 28.6(103) ksi
Ans.
22
03 Solutions 46060
5/7/10
8:45 AM
Page 23
© 2010 Pearson Education, Inc., Upper Saddle River, NJ. All rights reserved. This material is protected under all copyright laws as they currently
exist. No portion of this material may be reproduced, in any form or by any means, without permission in writing from the publisher.
*3–32. A shear spring is made by bonding the rubber
annulus to a rigid fixed ring and a plug. When an axial load
P is placed on the plug, show that the slope at point y in
the rubber is dy>dr = -tan g = -tan1P>12phGr22. For small
angles we can write dy>dr = -P>12phGr2. Integrate this
expression and evaluate the constant of integration using
the condition that y = 0 at r = ro. From the result compute
the deflection y = d of the plug.
P
h
ro
y
d
ri
r
y
Shear Stress–Strain Relationship: Applying Hooke’s law with tA =
g =
P
.
2p r h
tA
P
=
G
2p h G r
dy
P
= -tan g = -tan a
b
dr
2p h G r
(Q.E.D)
If g is small, then tan g = g. Therefore,
dy
P
= dr
2p h G r
At r = ro,
y = -
dr
P
2p h G L r
y = -
P
ln r + C
2p h G
0 = -
P
ln ro + C
2p h G
y = 0
C =
Then, y =
ro
P
ln
r
2p h G
At r = ri,
y = d
d =
P
ln ro
2p h G
ro
P
ln
ri
2p h G
Ans.
23
03 Solutions 46060
5/7/10
8:45 AM
Page 24
© 2010 Pearson Education, Inc., Upper Saddle River, NJ. All rights reserved. This material is protected under all copyright laws as they currently
exist. No portion of this material may be reproduced, in any form or by any means, without permission in writing from the publisher.
•3–33.
The support consists of three rigid plates, which
are connected together using two symmetrically placed
rubber pads. If a vertical force of 5 N is applied to plate
A, determine the approximate vertical displacement of
this plate due to shear strains in the rubber. Each pad
has cross-sectional dimensions of 30 mm and 20 mm.
Gr = 0.20 MPa.
C
B
40 mm
40 mm
A
tavg =
g =
V
2.5
=
= 4166.7 Pa
A
(0.03)(0.02)
5N
t
4166.7
= 0.02083 rad
=
G
0.2(106)
d = 40(0.02083) = 0.833 mm
Ans.
3–34. A shear spring is made from two blocks of rubber,
each having a height h, width b, and thickness a. The
blocks are bonded to three plates as shown. If the plates
are rigid and the shear modulus of the rubber is G,
determine the displacement of plate A if a vertical load P is
applied to this plate. Assume that the displacement is small
so that d = a tan g L ag.
P
d
A
h
Average Shear Stress: The rubber block is subjected to a shear force of V =
P
.
2
P
t =
V
P
2
=
=
A
bh
2bh
Shear Strain: Applying Hooke’s law for shear
P
g =
t
P
2bh
=
=
G
G
2bhG
Thus,
d = ag = =
Pa
2bhG
Ans.
24
a
a