Distribution of education in vietnam
Bạn đang xem bản rút gọn của tài liệu. Xem và tải ngay bản đầy đủ của tài liệu tại đây (182.6 KB, 19 trang )
Is the Distribution of Education in Vietnam a Significant Policy Tool for Self Reliance?
1 of 19
Is the Distribution of Education in Vietnam a Significant
Policy Tool for Self Reliance?1
Donald B. Holsinger2
October 18, 2007
Abstract
Vietnam’s economy over the past decade grew at one of the highest rates in the world.
The broadly based nature of this growth sent tumbling by over 20 percentage points the
proportion of the population falling under an internationally comparable poverty line. Yet
this growth has also generated increases in income inequality which, by some measures,
threaten to give Vietnam one of the most unequal income distributions (highest income
Gini coefficients) in Southeast Asia within 10 years. Paradoxically the growth
experienced the Vietnamese economy may have been caused, in large measure, by its
relatively equal distribution of education attainment at the time of its economic transition
from central planning to a market economy (with socialist characteristics). This paper
examines the dynamic interconnections between growth and education attainment
inequality. It argues that the remarkable levels of education equality achieved at the time
of reunification may not be sustainable and that increasing levels of income inequality
may jeopardize Vietnam’s efforts to reduce poverty, by undermining pro-poor policies in
the short to medium term. Finally the paper presents new evidence that education
inequality perversely affects learning achievement and, ultimately, human capital
formation. Efforts by Japanese (development donors and development agencies) to
build and sustain in low income countries a network of high quality schools that equalize
education attainment (low education Gini coefficients) levels is a sound policy for
assuring self-reliance.
1
Paper presented by invitation of Nagoya University at the Seminar on Aid for Self-Reliance and Budget
Support for Educational Development sponsored by the National Graduate institute for Policy Studies
(GRIPS), Japan NGO Network for Education (JNNE) and Nagoya University, Tokyo, Japan, October 18,
2007.
2
Professor Holsinger was Senior Education Specialist at the World Bank for 13 years and is recently
emeritus at Brigham Young University in Provo, Utah. He was president of the Comparative and
International Education Society in 2003/04. His presidential address for CIES, Inequality in the Public
Provision of Education was published in the Comparative Education Review. Contact Professor Holsinger
at 1262 E. 2300 N.; Provo, Utah 84604; USA or email at
Is the Distribution of Education in Vietnam a Significant Policy Tool for Self Reliance?
2 of 19
Is the Distribution of Education in Vietnam a Significant
Policy Tool for Self Reliance?
Donald B. Holsinger
Introduction
After seemingly interminable decades lost to war and later isolation and economic
mismanagement, the closing decade of the 20th century was, in development terms,
perhaps the greatest in its history. Vietnam enjoyed an average rate of economic growth
of 7.6 percent over the decade, placing it among the fastest growing countries in the
world, alongside its neighbor China. Less remarked upon is the burst of poverty
reduction Vietnam experienced over this period, one that would, if sustained a further 10
or 15 years, move it from the ranks of the poorest populations in the world to one with
negligible levels of absolute poverty. In part because of these numbers, and the textbook
fashion in which the Vietnamese economy responded to market-oriented reforms, the
World Bank has described Vietnam as a case study of the promise of economic
integration or `globalization' for poor countries.3
Today, however, a growing number of observers at the multi-lateral and regional
development banks are worried about another phenomenon—one too common in the
era of unbridled capitalism and globalization—income inequality. Before turning to the
question of education equality in Vietnam and its effects over this same period, I will take
a few minutes to analyze recent evidence from Vietnam on the distribution of wealth, that
is, per capita income. Inequality of wealth appears to be growing in Vietnam and this
may have far reaching repercussions for self reliance in that nation.
The increasing geographical concentration of poverty is striking, with the Northern
Uplands, Mekong Delta and North Central Coast regions holding over 67 percent of
Vietnam's poor in 1998, from 55 percent in 1993.4 While in the aggregate, Vietnamese
income/expenditure inequality is still moderate by international standards, a focal point of
contention is the pace at which income inequality has been growing. Two recent
estimates done from the aforementioned VLSS for 1993 to19985, and another appearing
in the UNDP-sponsored Country Human Development Report reach significantly
different conclusions. The VNLSS data showed Vietnam's income Gini coefficient to
have increased only marginally, while the UNDP-backed study reports a large increase,
from 35.6 to 40.7. It is this latter estimate that is striking. If true, it suggests Vietnamese
inequality is growing at one of the fastest rates recorded in the world in recent years, and
has reached the same level as China much faster, and at a much lower income level.6
3
World Bank, Globalization, growth and poverty: building an inclusive world economy. New York: Oxford
University Press and the World Bank.
4
World Bank (1999). Vietnam: preparing for take-off? Hanoi. World Bank.
5
The Viet Nam Living Standards Survey is a publication of the Government Statistics Office.
6
For details and data presentation see National Center for Social Sciences and Humanities (NCSSH), 2001,
National human development report 2001: doi moi and human development in Vietnam, Hanoi: The Political
Publishing House.
Is the Distribution of Education in Vietnam a Significant Policy Tool for Self Reliance?
3 of 19
Poverty in Vietnam
Poverty in Vietnam is arguably the most momentous socioeconomic issue facing that
country over the medium-term, for a number of reasons. First, however defined, the
sheer number of people living in poverty is still high in Vietnam. Approximately one-third
of the population, or some 25 million people, fall below the international poverty line.
Thus, how Vietnam deals with the question of poverty and inequality will define the type
of society it will become. Will it be able to emulate the long-term relative success of the
East Asian “tigers” in generating broadly based affluence and reducing poverty? Or will
Vietnam ultimately resemble countries like the Philippines or Sri Lanka, which, despite
better-than-average social indicators in some areas, have lost the momentum of growth
and poverty reduction. A worst case scenario in which Vietnam drifts towards some
unstable combination of accelerating inequality, low economic growth and institutional
dysfunction should not be ignored.
Income inequality, poverty and economic growth
Although there is disagreement among macroeconomists about the relationship between
inequality and poverty reduction, a few general conclusions appear to be accepted by
almost everyone and are offered here by way of review for our subsequent discussion of
education for self-reliance.
•
There is a necessary relationship between growth and poverty reduction. Even
critics of development theory acknowledge the role of economic growth in
sustainable poverty reduction.
•
“High quality” growth is necessary to maximize poverty reduction. Economic
growth, demystified, is merely the average income per person this year
compared to last year. But average income masks the distributional
characteristics. If growth is achieved only in certain sectors of the economy or in
certain regions of the geography (for example urban wage sector) many people
are left out of the benefits of growth.
•
No necessary relationship between growth and inequality. Studies of this
relationship have found inequality to slightly rise with greater rates of economic
growth in some countries whereas in others inequality fell. But even if growth
could always be achieved through policies resulting in inequality, there is
certainly a political and moral question of whether it is good to achieve growth
that way. Brazil and Mexico, for example, have made good progress toward
growth but still have very high levels of inequality of income and, of course, many
very poor citizens.
The case of China reveals the complex interplay of the three variables: growth,
inequality and poverty reduction. It plays an important role in interpreting the Vietnamese
experience, since it does not obviously fall into the East Asian `miracle' or `Latin
American' categories. The poor have benefited greatly from Chinese growth over the
previous 20 years, with poverty estimated to have fallen by over 50 percent between
1981 and 1995, regardless of the poverty line used. But China has experienced a high
Is the Distribution of Education in Vietnam a Significant Policy Tool for Self Reliance?
4 of 19
degree of inequality generation, as measured, for instance, by a Gini coefficient which
increased from 28.8 in 1981 to 38.8 over the same period.7
The scope of Vietnam's doi moi (`renovation') reforms stretching over the past 15 years
is striking. Vietnam's economy has grown and very quickly whereas many, if not most,
other former command-and-control economies have stagnated. Of 28 transition
economies from Albania to Uzbekistan had negative growth rates of GDP in 1992, for
instance. But China and Vietnam were the `stars', with sustained growth rates over 7
percent through much of the 1990s. Even the comparison with China is sobering. Unlike
China, Vietnam began its reforms in macroeconomic crisis; it also began its most farreaching reforms nearly a decade later than China.
What were the conditions from which Vietnam began this economic ascent? Following
reunification of the country in 1975, the North pressed ahead with its model of a topheavy, centralized economy, which had been consolidated in the North for some
decades. An attempt was made to collectivize agriculture in the South where it was
fiercely resisted and generally unsuccessful. Private trading of any kind was banned, as
the service sector was viewed as non-productive. The results of this experiment were
dire. Per capita growth was negative throughout the late 1970s, including in the stateowned heavy industrial sector, which was intended to be the leading engine of growth.
By 1979 call for reform were heard. By the 1990’s Vietnam was set for several decades
of strong economic growth.
Education, Growth and Development in Vietnam
But the usual recounting of the relationship between income inequality and economic
growth, which I have just reviewed albeit briefly, largely ignores Vietnam’s unusual
investment in education and the equality with which investments were made across all
provinces of the country.
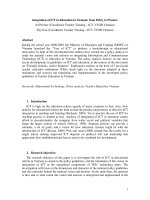
Vietnam does not closely resemble any of its Asian neighbors when comparing its
relative wealth to its education and other human development indicators to those of its
neighbors. The World Bank places Vietnam 157 out of 207 countries in terms of GNP
per individual. But when examining the position of Vietnam simultaneously on wealth
and human development (see Figure 1 below), it is somewhat puzzling to see that
whereas it is close to the bottom of the distribution in terms of wealth per capita, it is
located in the top third in relation to the HDI8 index, just a little below the average for
medium income countries.
7
The Gini coefficient is calculated in such a way that “zero” represents perfect equality and “one” is
indicative of perfect inequality
8
The Human Development Index or HDI is a composite indicator that is heavily weighted toward literacy and
education attainment. It is useful for broad, cross-country comparisons even though it yields little specific
information about each country. The HDI was first used in the United Nations Development Program’s 1990
Human Development Report.
Is the Distribution of Education in Vietnam a Significant Policy Tool for Self Reliance?
5 of 19
Figure 1: HDI score and GDP per capita ($PPP)
Source UNDP (2001)
9
Typically macroeconomists have concluded that Vietnam’s rapid growth in the post Doi
Moi years generated rapid reductions in poverty; the period between 1993 and 1998 saw
a 20.8 percent decline in the head-count index of poverty. Vietnam's poverty reduction
experience over the 1990s was among the fastest ever recorded. All provinces and most
sub-populations (such as ethnic minorities) have seen absolute incomes rise and wellbeing increase. These same economists will also draw attention to the fact that key
social indicators such as life expectancy, infant mortality, and literacy have almost
uniformly improved during the transition.
What is often not mentioned is that most of the uniqueness of Vietnam’s relatively good
social indicators given its income level was evident prior to the doi moi reforms, not as a
direct result of them. Overall, education coverage as well as other social service delivery
networks were well entrenched at the time of the transition. Not only did education and
other social services not decline during the economic transition from central planning to
markets, but rather have stabilized and marginally improved, particularly since the mid1990s. Given appalling declines in income distribution and social services seen in some
transition contexts (e.g., Russia), that is no small achievement. But what I want to
emphasize here is that the human capital context, especially the relatively equal
distribution of education, was already in place and, in my mind, contributed to the
economic growth picture. There are, of course, education disparities, particularly in
relation to ethnic minorities. Low HDI provinces are also those with large shares of
ethnic minorities. Such disparities in human capital also reinforce economic inequalities.
Inequality of Education Attainment and Development
Development, when measured exclusively in terms of economic growth, has not been
advanced by investments in schooling to the degree anticipated. Following a period in
which the accumulation of physical capital was regarded as the only productive asset,
9
United Nations Development Program (UNDP). Human Development Report 2001: making technologies
work for human development. New York: Oxford University Press.
Is the Distribution of Education in Vietnam a Significant Policy Tool for Self Reliance?
6 of 19
developing countries, eager to improve their growth prospects, invested increasing
percentages of government expenditures in schooling with expectations of amassing an
educated and productive labor force earning higher wages and stimulating economic
growth. But it has not turned out this way for many countries.10 It is now clear that
education at all levels contributes to economic growth but cannot alone generate it.
There is also considerable evidence that the mere accumulation of seat time in school
does not mean that human capital is increased.
But there has emerged a third challenge to the assumed economic benefits of
investments in education. This is not so much a challenge as a warning that when
education is unequally distributed in a society, economic growth almost never occurs
and human talent is wasted—that is, a poor country’s most valuable asset remains
unproductive.
Education Inequality in Vietnam
Education inequality is and has been low in Vietnam for a several decades. A probably
outcome of the socialist ideology, Vietnam has paid close attention to the needs of its
female, ethnic minority and rural populations, the usual culprits when accounting for high
levels of inequality in the distribution of education attainment.
Not only has Vietnam steadily increased overall amounts and budget share to education
at the primary and secondary levels but it has perhaps the highest level of equality in the
distribution of education attainment in the developing world. Like other socialistorientated societies, Vietnam has attempted to provide an equal distribution of education
attainment and succeeded to a remarkable degree. Nonetheless, substantial variation
exists within the country.
The decade of the nineties saw a substantial push toward universal coverage at the
primary level. That this has been achieved attests to the tenacity of government and the
common thirst for education. It also reflects the unwavering support of the World Bank
for primary-level schooling principally on the basis that primary schooling is a public
good with high private and social rates of return.
The figures for enrollment change for the period 1994 to 2000 are presented in Table 2.
I use 1994 as the base comparison because of the World Bank’s foundational study on
education finance of that year.
Table 1. Secondary Enrollment Changes between 1994 and 2000
Year
1994
2000
Growth
Percent change
Lower Secondary
3,679,104
5,918,049
2,239,049
60.8
Upper Secondary
727,435
2,194,933
1,467,498
201.7
Source: Ministry of Education and Training
10
Lant Prtchett, Where Has All the Education Gone? World Bank Policy Research Working Paper
1581, March 1996.
Is the Distribution of Education in Vietnam a Significant Policy Tool for Self Reliance?
7 of 19
As in other developing countries, lower secondary education in Vietnam increasingly has
become aligned with primary schooling in a continuous cycle of compulsory or basic
schooling. In part owing to its alignment with primary schooling, enrollments at the LS
level have risen remarkably. With a 61 percent increase since 1994, I can conclude with
some finality that Vietnam is on its way toward achieving universal basic education that
includes lower secondary in that definition.
But it is at the upper secondary level where the most surprising change occurred.
Dramatic would certainly not be an overstated description of a 202 percent increase in
enrollments in just six years. Indeed this may the most spectacular increase in
secondary enrollments in modern history. As has been said elsewhere, at its level of
GDP per capita, Vietnam’s levels of school enrollment are high.
Whereas upper secondary school GERs are lagging behind progress at this level
elsewhere (except in sub-Saharan Africa), the lower secondary expansion has been
impressive. In the next decade enrollment increases at this level should bring Vietnam
to parity with other countries of East and Southeast Asia. Clearly Vietnam is doing well in
terms of student enrollments at all levels. When considering its GDP rank (101 of 161)
among all nations according to UNDP statistics, the enrollment performance of Vietnam
is nothing short of phenomenal.
Enrollment trends in poor and rich provinces
In a system so thoroughly dominated by the state sector it is legitimate to ask whether or
not government spending is equitable or even pro-poor. Were a larger share of schools
owned or operated by the private sector, as is increasingly the case in many developing
countries, we might expect to see wealthier provinces pull substantially ahead in their
ability to enroll students. But this is not the case in Vietnam except at the upper
secondary (US) level and the growing spread between rich and poor provinces is very
slight indeed.
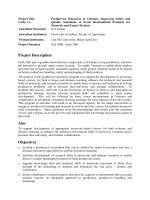
For our look at enrollment trends by income levels, I divided the 61 provinces into four
groups of approximately similar levels of GDP per capita. I then plotted gross enrollment
rates (GER) for each quartile at each year between 1994 and 2000. The results,
presented in Figure 2, show a rather unanticipated convergence of lower secondary (LS)
enrollment rates between the poorest quartile and the richest quartile. Indeed, at the
present time there is almost no difference between the rich and poor provinces—a
noteworthy accomplishment.
Is the Distribution of Education in Vietnam a Significant Policy Tool for Self Reliance?
8 of 19
Figure 2. Enrollment Trends between Rich and Poor Provinces,
1994 to 2000.
Gross enrollment rate
90
80
70
GER at USE of the poorest
provinces
60
50
GER at USE of the richest
provinces
40
GER at LSE of the poorest
provinces
30
GER at LSE of the richest
provinces
20
10
0
1994-95
1995-96
1996-97
1997-98
1998-99
1999-00
2000-01
School year
Source: MOET data, author calculations
Distribution of education attainment as a policy tool
Despite widely and justifiably acknowledged success of Vietnam, the quantitative
expansion of education has obscured the question of the equal distribution of education
attainment among and within the 61 provinces. Considerable variation exists among the
sixty one provinces in terms of geography, economic performance, average wealth, the
socioeconomic status of individuals, and the proportion and concentration of ethnic and
religious minorities. The education attainment for ethnic minorities is substantially lower
than that of the ethnic majority. Additionally, the difference in education attainment
between these groups is due to ‘the fact that the minorities live in less productive areas,
with difficult terrain, poor infrastructure, and lower accessibility to the market economy.11
Knowledge of the actual distribution of education attainment is important for several
reasons. First, the equitable distribution of education attainment is itself an important
education policy objective for the government of Vietnam. Second, despite the laudable
effort to extend full access equitably to all children, there is still a long way to go; the
absence of reliable information on the distribution of education in Vietnam is therefore
significant. Third, the recent effort to move toward a ‘market-oriented socialist economy’
has made the distribution of education attainment and the quality of education in the
labor force an item of paramount importance.12 Fourth, with the increase in both the
privatization and de-regulation of the economic system, the national government has
begun to shift the locus of education decision making authority to the provincial and
11
Belanger, D., and J. Liu. 2004. Social Policy Reforms and Daughters' Schooling in Vietnam. International
Journal of Educational Development 24 : 23-38., p.18
12
The economic performance of market economies is highly influenced by the distribution of education in
the labor force.
Is the Distribution of Education in Vietnam a Significant Policy Tool for Self Reliance?
9 of 19
district levels of government. Provincial governments have inherited the principal burden
from the education decentralization movement with both increased responsibility and
influence. Provinces are held accountable for policies and programs that target
minorities and other underserved populations in their respective districts and communes.
Table 2. Provincial education attainment data for the labor force
Province Name
Total Labor Force Population
Mean Years
Gini Coefficient
An Giang
Ba Ria-Vung Tau
Bac Giang
Bac Kan
Bac Lieu
Bac Ninh
Ben Tre
Binh Dinh
Binh Duong
Binh Phuoc
Binh Thuan
Ca Mau
Can Tho
Cao Bang
Da Nang City
Dak lak
Dong Nai
Dong Thap
Gia Lai
Ha Giang
Ha Nam
Ha Noi City
Ha Tay
Ha Tinh
Hai Duong
Hai Phong City
Ho Chi Minh City
Hoa Binh
Hung Yen
Khanh Hoa
Kien Giang
Kon Tum
Lai Chau
Lam Dong
Lang Son
Lao Cai
Long An
Nam Dinh
Nghe An
Ninh Binh
Ninh Thuan
Phu Tho
Phu Yen
Quang Binh
Quang Nam
1184075
477403
907988
149332
434456
579361
837219
888146
470795
355528
570021
667736
1110058
233002
413629
900124
1203838
922323
414424
218608
509006
1599722
1487666
756530
1069035
1079079
3323950
458055
681682
611511
838986
434456
175147
545851
402184
225898
827563
1210485
1649848
550377
246730
793641
452078
454417
824945
5.47
7.30
7.53
7.21
5.78
7.83
6.16
6.91
7.06
6.71
6.24
5.75
6.12
7.45
8.35
7.30
7.29
5.89
7.07
6.00
7.91
9.32
8.06
8.06
8.21
8.55
8.03
7.45
8.20
7.25
5.69
5.78
6.40
7.61
7.02
6.86
6.30
8.03
8.04
8.10
6.46
8.12
6.74
7.91
7.00
0.30
0.25
0.19
0.22
0.29
0.18
0.28
0.24
0.26
0.25
0.28
0.27
0.28
0.25
0.22
0.23
0.25
0.29
0.25
0.31
0.17
0.17
0.19
0.17
0.16
0.17
0.23
0.23
0.17
0.25
0.29
0.28
0.28
0.23
0.24
0.27
0.27
0.17
0.19
0.18
0.28
0.19
0.26
0.19
0.25
Is the Distribution of Education in Vietnam a Significant Policy Tool for Self Reliance?
Quang Ngai
Quang Ninh
Quang Tri
Soc Trang
Son La
Tay Ninh
Thai Binh
Thai Nyugen
Thanh Hoa
Thua Thien-Hue
Tien Giang
Tra Vinh
Tuyen Quang
Vinh Long
Vinh Phuc
Yen Bai
Mean
Standard Deviation
Range
Vietnam
683595
617814
309684
672885
360201
470831
1216271
654806
2060376
550531
1024638
544618
381674
650138
674300
354436
45194762
7.03
8.34
7.56
5.57
6.36
6.15
8.16
8.11
7.88
6.84
6.41
5.77
7.29
6.41
7.90
7.44
0.25
0.20
0.22
0.28
0.27
0.29
0.16
0.19
0.19
0.27
0.27
0.29
0.22
0.28
0.19
0.23
7.34
0.23
0.04
0.15
0.24
10 of 19
Source: Vietnam Housing and Population Census 1999; Author’s calculations.
Data represent individuals with 15 or more years of age for the year 1999.
Initial findings from Table 2 indicate several important descriptive features. First, the
education Gini coefficient of Vietnam is 0.23. This coefficient represents the distribution
of education attainment in the labor force. A Gini coefficient of 0.23 is considered
relatively equal. Regional countries with similar Gini coefficients as Vietnam are the
Republic of Korea with 0.22, Japan with 0.25, and New Zealand with 0.25. Second,
turning to the provincial level analysis, the province of Vietnam with the most unequal
distribution of education attainment is Ha Giang with a Gini coefficient of 0.31. This
coefficient is still considered reasonably equal. Regional countries with similar Gini
coefficients equivalent to that of Ha Giang province are Hong Kong with 0.32 and the
Philippines with 0.33.13 Third, the province with the most equal distribution of education
attainment is Thai Binh with a Gini coefficient of 0.16. This coefficient is considered
exceptionally equal. No regional countries have a Gini coefficient as low as Thai Binh
province. However, countries with similar Gini coefficients as Thai Binh province are
Canada with 0.16, USA with 0.14, and Poland with 0.14.
While the analysis is at this juncture largely descriptive, two important trends are visible
with respect to the level or unit of analysis. The first trend is that higher or aggregated
levels of analysis obscure the inequality of education attainment that becomes visible at
disaggregated levels of analysis. This is evident through analysis of the increasing range
of Gini coefficients at disaggregated levels. In addition, the differences between the
national level and the communal level mean and maximum Gini coefficients are 0.11 and
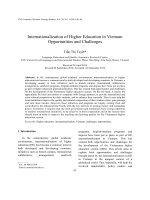
0.21. Figure 3 provides an effective portrayal of the increase in education attainment
13
Education Ginis for this section are from: Measuring Education Inequality: Gini Coefficients of Education,
Vinod Thomas, World Bank Brazil, Wang Yan, World Bank Institute and Xibo Fan, JP Morgan Chase,
January 2001, World Bank Policy Research Working Paper no. 2525.
Is the Distribution of Education in Vietnam a Significant Policy Tool for Self Reliance?
11 of 19
inequality with the Lorenz curves for Vietnam, Ha Giang province, Dong Van district, and
Ho Quang Phin. The difference between Vietnam and Ho Quang Phin commune in
terms of education attainment is 17 percent; Ho Quang Phin commune is substantially
more unequal than Vietnam as a whole.
Figure 3. Lorenz curves and Gini coefficients for Vietnam, Ha Giang Province,
Dong Van District, and Ho Quang Phin Commune
100
Cumulative Percentage of Educational Attainment
80
60
40
20
0
0
20
40
60
Cumulative Percentage of the Population
Source: Vietnam Housing and Population Census 1999; Author’s calculations.
Data represents individuals with 15 or more years of age for the year 1999.
• Vietnam (0.24)
• Ha Giang Province (0.31)
• Dong Van District (0.39)
• Ho Quang Phin Commune (0.44)
80
100
Is the Distribution of Education in Vietnam a Significant Policy Tool for Self Reliance?
12 of 19
Education inequality in the quest for growth
Poor countries have invested massively in education with the expectation of a population
with higher mean education attainment levels, higher earnings, and stimulated economic
growth. Yet in several instances economic growth has not materialized at the envisaged
rate probably because education attainment was not distributed equitably within the
population. As a result, some developing countries, having followed the conventional
human capital policy advice, were left with a skewed distribution of education attainment
and slow economic growth. According to Thomas,14 a skewed distribution of education
attainment has a deleterious effect on economic growth.
A common finding among those countries experiencing slow economic growth due to an
unequal distribution of education attainment is that an elite minority has captured a
majority share of public expenditures for schooling. As a result, this population, usually
consisting of high-income, urban, or dominant tribal or religious groups, has benefited
more than others. In addition, poor countries with slow economic growth have often
invested disproportionately in tertiary education. Higher education investments typically
display lower economic returns than result from investments at the primary and
secondary levels. A pattern of public spending, which provides large amounts of support
to a narrow group of beneficiaries rather than broad equality of opportunity at a basic
level, does not constitute a prudent use of scarce public resources.
Typically, when a minority proportion of the population has the majority share of
education attainment, this same minority proportion of the population also has the
majority share of income. Inequities in education attainment and income inequality are
positively correlated. The inequality of education attainment reinforces income disparities.
Similarly, the way in which education is distributed will have a profound impact on the
distribution of income and the nature of growth. Education attainment inequality
generates income inequality, and income inequality impedes economic growth.
Equalizing the distribution of education attainment and income produces a larger and
more diversified population participating in the economy with access to a larger share of
the total wealth of the country. Mass participation in education is requisite for economic
growth, at least of the sustainable variety. In my view, economic development of the self
reliant sort occurs via equitable investment in education, and educational expansion
coverage should include an equal distribution of education attainment in order to
contribute to economic development.
Inequality and human capital formation
A persistent but heretofore unanswered question in the study of education inequality
pertains to its relationship with student learning. What impact, if any, do costly efforts to
achieve an equal distribution of primary school completion rates have on student
learning as measured by standardized achievement tests? This is a question that, up to
now, has not been satisfactorily answered due primarily to data limitations. Achievement
data, of course, are commonplace in this era of preoccupation with human capital
formation through schooling. But similar measures of education attainment equality (or,
14
Vinod Thomas, Director of the World Bank Institute, when his book, The Quality of Growth, was published
in 2000. This book, particularly Chapter 4 on education, was a rich source of inspiration for this author’s
work.
Is the Distribution of Education in Vietnam a Significant Policy Tool for Self Reliance?
13 of 19
conversely, inequality) do not exist for most countries; at least not at the sub-national
level.15
This investigation drew on standardized achievement test data from Vietnam
disaggregated by provinces. It is a correlational analysis and therefore some caution
must be observed in drawing causal relationships. The education Gini coefficients are
based on work done under my guidance by several graduate students at Brigham Young
University. The national test scores based on a national sample of Vietnamese primary
school students has not been available until recently. But rarely if ever do such tests
purport to be representative of the entire school age population. In many country cases
only a small fraction of school children attend school thus casting considerable doubt on
the meaning of a comparison between a measure of the distribution of education
attainment based on an entire age group and a test score based on a subset of a
national age cohort.
Vietnam represents an exceptional opportunity to examine the relationship between
inequality of education attainment and overall student achievement. This opportunity is
the result of the publication of the World Bank supported Reading and Mathematics
Assessment Study (December, 2004) that reports fifth grade achievement test scores for
robust representative samples of Vietnamese schools.16 The resulting data permit
generalization at the provincial level. At about the same time Holsinger published
education Gini coefficients for Vietnam covering all sixty one provinces, thus setting the
stage for a rare look at the inter relationship between the two largely independent
characteristics of schooling. We are now able to provide preliminary estimates of the
possible effect size and direction of influence between these two variables.
The correlation matrix below presents correlations between a number of variables of
interest. We will pay particular attention here to the Combined Reading and Math
Benchmark that shows a moderate to strong and significant relationship to the education
Gini of r=-.54. There is little room for doubt that the more equal the distribution of
education attainment in a Vietnamese province the higher are the average fifth grade
test scores on this carefully constructed examination of math and reading. The
Education Gini coefficient is slightly higher than is the Human Development Index
relationship to test score performance (r=.4).
Table 3: Correlation between Education Gini and Achievement Scores
Variable
Combined Reading and
Math Benchmark
Education Gini
(inequality score)
Human Development
Index provincial score
15
Combined Education
score
Gini
1
-.54
HDI rank
province
-.46
Math
score
1
Reading
score
.92
-.54
1
.40
-.54
-.62
-.46
.40
1
-.46
-.48
Inequality in education attainment means variation among members of a population in the number of
years of formal schooling completed. While such estimates, called education Gini coefficients, exist at the
national level (for whole countries) they do not exist at the level of individual provinces. Vietnam is an
exception.
16
Vietnam: Reading and Mathematics Assessment Study, three volumes, The World Bank, August 2004
Is the Distribution of Education in Vietnam a Significant Policy Tool for Self Reliance?
Math Independent
Benchark
Reading Independent
Benchmark
14 of 19
1
-.54
-.46
1
.92
.92
-.62
-.48
.92
1
Notes on variable coding: Education Gini index is calculated such that “0” is perfect equality and “1” is total
inequality so the higher the score, the more inequality. This produces a negative correlation of .54 with the
combined math and reading assessment score. The interpretation is that the more inequality exists in the
distribution of education in a province, the lower is the fifth grade learning achievement score. The
relationship is slightly stronger (-.62) for reading than for mathematics (-.54).
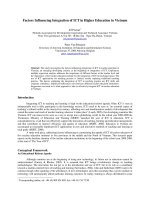
This same relationship can be visualized graphically in the following figure. Here we
have divided the provinces of Viet Nam into three groups, each represented by one bar
of the graph. The first bar represents the twenty provinces with the most equal
distribution of education attainment, the second bar represents the provinces with
education attainment roughly in the middle of the distribution and the final bar represents
provinces with the most unequal attainment. Inside each bar is a little box that contains
the mean combined math and reading score for fifth grade students in the same
provinces. As can be clearly seen as the inequality of attainment increases the average
student achievement score decreases. The results could not be clearer.
Is the Distribution of Education in Vietnam a Significant Policy Tool for Self Reliance?
15 of 19
Table 4: Student learning achievement scores by provincial inequality
Mean Combined Reading & Math Benchmark
100.0
80.0
60.0
86.16
40.0
79.09
69.53
20.0
0.0
Most equal attainment
distribution
Middle of provincial
attainment distribution
Least equal attainment
distribution
Ed Gini in thirds
Alternative explanations for the observed relationship
Critics might claim that the relationship between attainment inequality and student
learning achievement is spurious. Some scholars who are skeptical of our findings
argue that the reason behind the highly significant correlations is because in Vietnam the
provinces with more equal distributions of number of years of schooling completed are
also the same provinces with vastly improved socioeconomic conditions. They maintain
that it is these conditions rather than equality or inequality that causes the variability in
achievement scores. This is a reasonable hypothesis and should be carefully examined.
However our initial efforts to control for a wide range of positive social contextual
variables (summarized here by the HDI) did not confirm this suspicion. This fact can be
clearly seen in the table below and in the partial correlation coefficient17 between the
17
A partial correlation coefficient is a variant of the simple two variable or bi-variate statistic. It introduces a
third variable as a control. The interpretation is the relationship between two variables controlling for or
eliminating the influence of a third variable.
Is the Distribution of Education in Vietnam a Significant Policy Tool for Self Reliance?
16 of 19
Education Gini and the Combined Achievement score controlling for HDI of r=-.44, still
significant at the .001 level.
In the table below, the provincial Combined Fifth Grade Reading and Math test score is
presented in the right hand column. Each row represents one level of the provincial HDI
score. The top row is contains the achievement scores for provinces at the highest (best)
level of HDI. We took this one additional step by breaking down the provinces showing
the highest HDI scores into two parts: first, on the top line are the provinces with the
highest HDI score and also above average equality. The next line or row also has the
provinces with high average HDI scores but less equal education Gini coefficients.
Table 5: Controlling for the HDI level
HDI Level
Education Inequality
Index
5th Grade Combined
Achievement Mean
Highest
Third
Middle
Third
Lowest
Third
More equal
Less equal
More equal
Less equal
More equal
Less equal
88.8
76.6
83.5
69.8
83.1
63.5
Conclusions
While more study using advanced statistical methods needs to be conducted, our
preliminary investigation of the relationship between attainment inequality and student
academic or learning achievement presents what we believe to be convincing results:
inequality is bad of student learning.
Summary and recommendations
The inequality in the distribution of education in numerous countries is staggering. If
people’s abilities are normally distributed across income levels, such skewed distribution
of education would seem to represent some of the largest welfare losses to society.
Awareness of education attainment inequality at all levels of system administration has
significant education policy relevance for self reliance in Vietnam as elsewhere in the
developing world. As national, provincial and district education authorities attempt to
formulate education policies targeted at marginalized and underserved groups, it should
prove helpful to identify specific locations according to the size of their respective
education Gini coefficients. By establishing baseline inequality measures, governments
at all levels will be able to demonstrate empirically the progress their education policies
and investments have produced Effective education policies, where the measure of
effect is economic growth, will be aided by the systematic use of the education Gini
Is the Distribution of Education in Vietnam a Significant Policy Tool for Self Reliance?
17 of 19
coefficient, a powerful tool to measure the current status of and improvements in the
quality of the Vietnamese or any other country’s labor force.
Education investments that improve the distribution of education attainment in the labor
force will in all likelihood be a major factor in Vietnam’s regional competitiveness in the
future, as economic development generally depends on more than increasing education
expenditures or on decentralization. The contention that education spending of
governments is biased toward the rich is hardly a novel idea. There is also a large
literature providing ample evidence that such bias is ultimately a political decision. A
political bias in favor of factors contributing to income inequality is frequently masked as
meritocratic especially where access to successive levels of schooling is determined
through high stakes examinations. In the past two decades the rise of equity as an
explicit objective of development assistance to education has become a ubiquitous
feature. In practice, however, the policy focus has been on parity of subgroups within
populations, most particularly gender and ethnicity. But the distribution of education
attainment or education learning achievement has rarely been measured, in part
because there was little understanding of the use of the Gini coefficient as an indicator
that could be used to examine this dimension. My contention is that the systematic
inclusion of the education Gini coefficient as a standard policy instrument will help focus
attention clearly and more precisely on one of the largest remaining problems in the
public provision of education among the poor of the world.
We should all care about the unequal distribution of education because its causes and
consequences are detrimental to human well being and to economic self reliance. Poor
children who leave school prematurely become unproductive, dissatisfied adults. Highly
unequal distributions of education are associated with low per capita wealth and
perpetual dependence on external aid.
So what can be done? Concentrating public spending on primary and lower secondary
education improves the chances that the poor will benefit, and hence will improve the
distribution of education in a country. But experience has shown that efforts to target the
poor in this way have not made much difference to the distribution as measured by the
education Gini coefficient. There are several reasons for this.
For many years the World Bank signaled its strong preference for financing education
investments for quality enhancement and enrollment expansion at the level of the
primary school. At the same time it aggressively discouraged projects related to
secondary education. Many client countries, benefiting from the Bank’s primary
education-only policy, redirected their own resources toward secondary education and
erected barriers to entry at that level in the form of high stakes entrance examinations.
The unanticipated result has been that relatively wealthy households increase the
probability that their children will succeed in this examination by hiring tutors. Underpaid
school teachers are happy to offer their services as after-hours tutors. Thus, a parallel
private system operates in such a way as to ensure that at each successive level of
schooling the children of comparatively wealthy households capture the education
spending of the government. The same pernicious arrangement may exist in the
transition between lower and upper secondary and between secondary and tertiary
levels.
Is the Distribution of Education in Vietnam a Significant Policy Tool for Self Reliance?
18 of 19
Vietnam’s approach is worth considering. It has attempted and largely succeeded in
providing schooling through lower secondary to all children equally. It has invested
heavily in provinces that are disadvantaged, mountainous or populated by nonVietnamese speaking minorities. The government of Vietnam has for many years
explicitly encouraged the education of girls and is one of the few countries at its income
per capita level that has equal enrollments between boys and girls. Vietnam has
concentrated government expenditure on primary and lower secondary, and has
expanded upper secondary through the use of school fees. By concentrating spending at
lower levels, it has achieved a remarkable level of equality. But Vietnam has not been
able to eliminate the examination and its ubiquitous partner, private tutoring. Further
reduction of the education Gini may be difficult to achieve for that reason.
Is the Distribution of Education in Vietnam a Significant Policy Tool for Self Reliance?
TABLE OF CONTENTS
Section Headings
page
Abstract
Introduction
Poverty in Vietnam
Income inequality, poverty and economic growth
Education, Growth and Development in Vietnam
Inequality of Attainment Impacts Development
Education Inequality in Vietnam
Enrollment trends in poor and rich provinces
Distribution of education attainment as a policy tool
Education inequality in the quest for growth
Inequality and human capital formation
Alternative explanations for the observed relationship
Summary and recommendations
Table of contents
1
2
2
3
4
5
6
7
8
11
12
15
15
18
Figures
1. Education, Growth and Development in Vietnam
4
2. Enrollment Trends in Rich and Poor Provinces
3. Lorenz curves and Gini coefficients for Vietnam, Ha Giang
7
Province, Dong Van District, and Ho Quang Phin Commune
11
Tables
1. Secondary Enrollment Changes between 1994 and 2000
2. Provincial education attainment data for the labor force
3. Correlation between Education Gini and Achievement Scores
4. Student learning achievement by provincial inequality
5. Table 5: Controlling for the HDI level
6
9
13
14
15
19 of 19