Determination of DC voltage ratio of a self calibrating DC voltage divider (ling xiang liu, sze wey chua, member, IEEE, and chee kiang ang) liu2005
Bạn đang xem bản rút gọn của tài liệu. Xem và tải ngay bản đầy đủ của tài liệu tại đây (185.98 KB, 5 trang )
IEEE TRANSACTIONS ON INSTRUMENTATION AND MEASUREMENT, VOL. 54, NO. 2, APRIL 2005
571
Determination of DC Voltage Ratio of a
Self-Calibrating DC Voltage Divider
Ling Xiang Liu, Sze Wey Chua, Member, IEEE, and Chee Kiang Ang
Abstract—This paper presents two techniques for determining
the ratios of resistive dc voltage dividers up to 1 kV. The techniques are based on absolute calibration methods. The setup requires equipment commonly available in most standard laboratories and is capable of providing high-accuracy calibration under
practical laboratory working conditions.
Index Terms—Calibration, dc voltage, dc voltage ratio, self-calibrating divider.
I. INTRODUCTION
F
OR a resistive divider that offers access to its equally
divided resistance chain, its voltage ratio, a dimensionless quantity, can be determined using an absolute calibration
method and without the need of a reference voltage divider.
Such a divider is often referred to as being capable of being
“self-calibrated,” as any two individual sections of the divider
can be compared by a suitable procedure. With a complete
independent set of comparison results, all voltage ratios of the
self-calibrating divider can be determined.
Absolute calibration methods to determine the ratio of a dc
voltage divider have been reported and are used in standard laboratories [1]–[10]. In this paper, we present the techniques, setup
and results of the calibration of dc voltage ratios based on two
absolute calibration methods initially reported in [2]. The setup
requires equipment commonly available in most standard laboratories and is capable of providing high-accuracy calibrations
under practical laboratory working conditions.
II. REFERENCE VOLTAGE SOURCE BOOTSTRAP METHOD
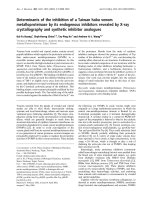
Fig. 1 shows the schematic circuit diagram for determining
the dc voltage ratio of a self-calibrating resistive divider with
10 equal section taps. The guarding and shielding arrangements are not shown in the diagram.
This method requires two dividers—a divider under test
and an interim divider , each having equal sections.
and
are lead compensators for equalizing the voltage drops
of the leads to and . A stable Zener voltage standard is used
as reference voltage source and a high-impedance null detector
is used to measure the voltage difference between the taps of the
two dividers. All parameters associated with the interim divider
are denoted by a superscript .
Manuscript received July 2, 2004; revised November 5, 2004.
The authors are with the Electrical Metrology Department, National
Metrology Center, Standards, Productivity and Innovation Board (SPRING),
Singapore 118221, Republic of Singapore (e-mail: ).
Digital Object Identifier 10.1109/TIM.2004.843089
Fig. 1. Schematic circuit of the reference voltage source bootstrap method.
The configuration shown is for comparing n sections of divider with (n 1)
sections of
connected in series with the Zener voltage standard.
D
D
0
The sections’ ratio
is the cumulative ratio (0 to tap)
. We assume that
of the th tap with a nominal value of
, where
is the ratio of a particular
is the sections’ ratio of the divider at the
section and
th tap. The ratio error of section is given by
(1)
For a ratio device with
sections, we have
(2)
where
is the ratio error of the th section of the device. The
operation of the reference voltage source bootstrap method is
as follows: with the switch in position , the voltages at the
same taps of the two dividers are directly compared using the
null detector. We obtain
0018-9456/$20.00 © 2005 IEEE
(3)
572
IEEE TRANSACTIONS ON INSTRUMENTATION AND MEASUREMENT, VOL. 54, NO. 2, APRIL 2005
where
is the null detector reading expressed as a fraction
of the nominal input voltage . Hereafter, all reference to a
null detector reading will refer to the reading expressed in this
manner.
The switch is then turned to position II to introduce a stable
with nominal value of
. Comparreference voltage
against
isons are now made between sections of
sections of
in series with the reference voltage source. We
obtain
(4)
is the reading from the null detector divided by the
where
input voltage .
of sections’ ratio
from
The cumulated ratio error
, is then
its nominal value
(5)
Equation (5) gives the cumulative ratio error of the voltage divider from the observed null detector readings. The ratio errors
of the individual sections of the divider
can be calculated
. Once the ratios of the divider under
by
have been determined, the ratios of the interim divider
test
can be calculated using (3).
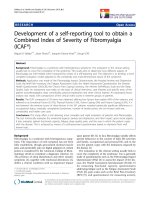
Fig. 2. Schematic circuit of the reverse stagger method. The configuration
in the forward position and
set so that
is connected
shown is for
in series with the sections 0 to 9 of
.
S
D
Similarly, by reversing
S
R
, we can obtain
III. REVERSE STAGGER METHOD
The schematic circuit in Fig. 2 illustrates the operation principle of the reverse stagger method for calibrating a resistive
equal section taps. Here,
provides the redivider with
versing operation and
provides the staggering operation.
is a standard resistor with the same nominal resistance value as
a single section of the interim divider .
First, the ratio differences between the corresponding indifrom
to
for an even
vidual sections of and
for an odd number are measured. We
number or
obtain
(6)
is the null reading at the th sections tap divided
where
by the nominal input voltage , and the subscript denotes the
“forward” connection reading. The null reading of an individual
section is therefore
(7)
where
the ratios
related by
is the null reading at the
th taps. Hence,
and
for the th section of the dividers can be
(8)
(9)
From (8) and (9), we have
(10)
to
for even, or
for odd. The
where
is connected in series with the Sections 0
standard resistor
to
of
using switch . The position of switch
determines whether
is connected at tap 0 or tap
.
By repeating the same procedure, we obtain equations similar
to (10)
(11)
to
where
Letting
the ratio error
for odd or
and
of each section becomes
for
even.
,
(12)
Together with (2), the relative error of each section can be
obtained from the unique solution of the set of equations from
all these measurements as shown below
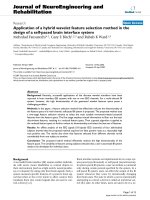
LIU et al.: DETERMINATION OF DC VOLTAGE RATIO OF A SELF-CALIBRATING DC VOLTAGE DIVIDER
MEASURED RELATIVE RATIO ERRORS
When
1
, IN 10
573
TABLE I
, FOR TWO 4902S DC VOLTAGE DIVIDERS, USING THE REFERENCE VOLTAGE SOURCE BOOTSTRAP METHOD
is odd
When
(13)
is even
(14)
574
IEEE TRANSACTIONS ON INSTRUMENTATION AND MEASUREMENT, VOL. 54, NO. 2, APRIL 2005
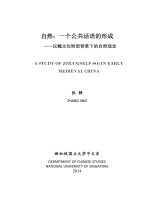
MEASURED RATIO ERRORS
1
TABLE II
,
IN
10
,
FOR ONE 4902S DC VOLTAGE DIVIDER USING THE
REFERENCE VOLTAGE BOOTSTRAP METHOD
REVERSE STAGGER METHOD
AND THE
TABLE III
UNCERTAINTY BUDGET FOR CALIBRATION OF THE DIVIDER USING THE
REFERENCE VOLTAGE BOOTSTRAP METHOD
TABLE IV
UNCERTAINTY BUDGET FOR CALIBRATION OF THE DIVIDER USING THE
REVERSE STAGGER METHOD
Due to measurement noise, short-term drift, etc., the system
of equation in (13) and (14) will not be consistent. Hence, a
statistical estimation method should be used to evaluate the best
estimates of the ratio errors.
1 kV/100 V range ratios, respectively. Typical measurement uncertainties expressed as a fraction of the nominal input voltage
are summarized in Tables III and IV.
IV. MEASUREMENT RESULTS
Measurements were carried out on three Datron 4902S dc
voltage dividers. The experimental results using the reference
voltage source bootstrap method with the reference voltage from
one 10-V Zener voltage standard for the 100 V/10 V range ratios, and ten 10-V Zener voltage standards connected in series
for the 1 kV/100 V range ratios showed good repeatability. The
agreement between the ratio errors of the individual sections
of the same unit using different interim dividers, was better
than 1 10 and 3 10 on the 100 V/10 V range and the
1 kV/100 V range, respectively, as shown in Table I.
The experimental results using the reverse stagger method
are shown in Table II. A comparison between the experimental results obtained using the reference voltage source
bootstrap method and those obtained using the reverse stagger
method, for measuring the ratios of the individual sections
of the same divider under test, shows that the differences
between corresponding measured voltage ratios using the two
different methods are less than 1.5 10 and 3.5 10 on
the 100 V/10 V range and the 1 kV/100 V range, respectively.
are less than
The estimated expanded uncertainties
2 10 and 5 10 for the 100 V/10 V range ratios and the
V. CONCLUSION
In this paper, two methods for absolutely determining the dc
voltage ratios of a self-calibrating divider, the reference voltage
source bootstrap method, and the reverse stagger method are
discussed. Experimental results have shown that for a divider
under test, the differences between the voltage ratio errors
determined by the two methods are less than 1.5 10 and
for the 100 V/10 V and 1 kV/100 V ratio taps,
3.5 10
respectively. These two methods are now used in the SPRING
Singapore’s Electrical Metrology Laboratory for calibration of
dc voltage dividers as well as providing a means for the laboratory to crosscheck the calibration results for any discrepancy in
the dc voltage ratio measurements.
REFERENCES
[1] T.-X. Yin, “The absolute calibration device for dc voltage divider,” in
NIM Monograph. Beijing, China: NIM publications, 1982.
[2] L. X. Liu, “Two absolute calibration methods for DC voltage divider,”
ACTA Metrologica Sinica, vol. 6, no. 4, pp. 246–251, Oct. 1985.
[3] P. G. Johnson and G. J. Johnson, “Dual networks and self-checking dividers,” IEEE Trans. Instrum. Meas., vol. 39, no. 4, pp. 578–582, Aug.
1990.
LIU et al.: DETERMINATION OF DC VOLTAGE RATIO OF A SELF-CALIBRATING DC VOLTAGE DIVIDER
[4] Wavetek, User’s Handbook, Models 4902/S & 4901 Voltage Divider and
Calibration Bridge/Lead Compensator, Wavetek, Ismaning, Germany,
Aug. 1995.
[5] L. A. Christian, “A new method for measuring ratios of dc voltages from
10 V to 1100 V,” in Proc. CPEM Conf. Dig., May 2000, pp. 665–666.
[6] X. Zhang, J. Qie, L. Zhang, and H. Shao, “High-precision measurement
of dc voltage ratios from 20V/10V to 1000 V/10V,” IEEE Trans. Instrum.
Meas., vol. 51, no. 1, pp. 59–62, Feb. 2002.
[7] B. M. Wood and D. Paulusse, “High voltage scaling with minimum
power corrections,” in Proc. CPEM Conf. Dig., Jun. 2002, pp. 374–375.
575
[8] G. Marullo-Reedtz et al., “Comparison CCEM-K8 of DC voltage ratio:
Results,” IEEE Trans. Instrum. Meas., vol. 52, no. 2, pp. 419–423, Apr.
2003.
[9] H. Slinde and H. Lind, “A precision setup and method for calibrating a
dc voltage divider’s ratios from 10 V to 1000 V,” IEEE Trans. Instrum.
Meas., vol. 52, no. 2, pp. 461–464, Apr. 2003.
[10] Y. Sakamoto and H. Fujiki, “DC voltage calibration system at NMIJ,”
IEEE Trans. Instrum. Meas., vol. 52, no. 2, pp. 465–468, Apr. 2003.