FinQuiz smart summary, behavior finance and investment processes
Bạn đang xem bản rút gọn của tài liệu. Xem và tải ngay bản đầy đủ của tài liệu tại đây (547.34 KB, 7 trang )
1
2013, Study Session # 3, Reading # 9
“BEHAVIORAL FINANCE AND INVESTMENT PROCESSES”
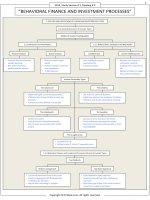
2. THE USES AND LIMITATIONS OF CLASSIFYING INVESTORS INTO TYPES
2.1 General Discussion of Investor Types
Models of Investor Psychographics
2.1.1 Barnewall Two-Way Model
Passive Investors
2.1.2 Bailard, Biehl, and Kaiser Five-Way Model
Active Investors
Investors who have become
wealthy passively.
Risk averse and have a
greater need for security.
Confident axis
Risk own capital to gain
wealth.
Prefer to maintain control of
own investments.
Risk tolerance.
How confidently investor
approaches life.
Emotional choices.
Careful-impetuous axis
Whether then investor is
methodical, careful &
analytical in his approach to
life.
Method of action can range
from carful to impetuous.
Investor Personality Types
The Adventurer
The Celebrity
Might hold highly concentrated portfolios.
Willing to take chances & likes to make own
decisions.
Advisors find them difficult to work with.
Like to be the center of attention.
Might have opinions but recognizes limitations.
Willing to seek & take advice about investing.
The Individualist
The Guardian
Confident & careful.
Listen & Process information rationally.
Likes to make own decisions after careful
analysis.
Cautious & concerned about the future.
Concerned about protecting their assets.
Seek advice of someone they perceive as more
knowledgeable.
The Straight Arrow
Sensible & secure.
Willing to take risk for
expected return.
2.1.3 Behavioral Finance and Investment Processes Behavioral Investor Types
Two Methods
Bottom-Up Approach
Test for all behavioral biases in the client.
Create an appropriate IPS & behaviorally
modified asset allocation.
May be time consuming or complex.
Top-Down Approach
Called behavioral alpha approach.
Simple & more efficient than a bottom-up
approach.
Determine type of bias in the client & how to
correct for or adapt to the biases.
Copyright © FinQuiz.com. All rights reserved.
2
2013, Study Session # 3, Reading # 9
BF = Behavioral Finance
BB = Behavioral Biases
Step in Top-Down Approach
Step 1 ⇒ interview the client & identify active or passive traits & risk tolerance.
Step 2 ⇒ the investor on the active/passive & risk tolerance scale.
Step 3 ⇒tests for behavioral biases.
Step 4 ⇒Classify investor into a behavioral investor type.
Passive Preserver (PP)
Low risk tolerance & are subject to emotional biases.
Emphasis on financial security & preserving wealth.
Most common emotional biases to PPs:
Endowment, loss aversion, status Quo & regret aversion.
Cognitive errors:
Anchoring & adjustment & mental accounting.
Advising Passive Preserver
Difficult to advice (driven mainly by emotion).
Receptive to “big picture” advice.
Friendly Follower (FF)
Passive investors with low to medium risk tolerance.
Cognitive biases.
Prefer popular investments.
Overestimate risk tolerance.
Influenced by availability, hindsight, framing & regret aversion biases.
Advising Friendly Followers
Difficult to advise (overestimate their risk tolerance).
Education is usually the best course of action (cognitive errors).
Independent Individualist
Active investor with medium to high risk tolerance.
Strong willed & independent thinker (maintain their opinions).
Most likely to be contrarian & typically subject to cognitive errors.
Advising Independent Individualists
Difficult to advice but usually willing to listen to sound advice.
Regular educational discussion is effective
Active Accumulator
Active investor with high risk tolerance.
Most aggressive investors & primarily subject to emotional
biases.
Quick decision makers with risky investments.
Copyright © FinQuiz.com. All rights reserved.
2013, Study Session # 3, Reading # 9
Advising Active Accumulator
Most difficult client to advise (like control).
May lack self control.
Best approach to deal ⇒ take control of the situation.
2.2 Limitations of Classifying Investors into Various Types
Individuals may simultaneously display both emotional & cognitive biases.
Might display traits of more than one behavioral investor type.
As investors age, they will most likely go through behavioral changes.
Two individuals with same behavioral investor type are likely to require unique
treatment.
Individuals, tend to act irrationally at unpredictable time.
3. HOW BEHAVIORAL FACTORS AFFECT ADVISER- CLIENT RELATIONS
Goal of the client/adviser relationship ⇒ construct a portfolio with
which a client is comfortable.
Portfolio should serve the client’s longer term goals.
BF can enhance the following important areas of every successful
advisory relationship.
3.1 Formulating Financial Goals
BF helps the adviser understand the reasons for the client’s goals.
3.2 Maintaining a Consistent Approach
BF adds structure & professionalism to the relationship.
3.3 Investing as the Client Expects
Area that can be most enhanced by incorporating BF
Adviser is fully awared of what actions to perform &
what information to provide.
3.4 Ensuring Mutual Benefits
Incorporating BF into client/adviser relationship act as a
closer bond b/w them.
3.5 Limitations of Traditional Risk Tolerance Questionnaires
Risk tolerance questionnaires:
Ignore behavioral issues.
Can generate different results when applied repeatedly.
May not be revised.
Adviser may interpret the results of such questionnaire too literally.
May work better for institutional investors.
Copyright © FinQuiz.com. All rights reserved.
3
2013, Study Session # 3, Reading # 9
4. HOW BEHAVIORAL FACTORS AFFECT PORTFOLIO CONSTRUCTION
BB affects how investors construct
portfolio from the securities available
to them.
4.1 Inertia and Default
In most DC plans members show inertia & don’t ∆ their asset
allocation.
Target date funds ⇒ fund that automatically switch from risky
assets to fixed income assets as the plan member nears the
intended retirement date.
Standardized strategy (one size fits all solution).
4.2 Naive Diversification
Allocating an equal proportion of assets to each fund
alternative.
Also called 1/n naïve diversification strategy & often used by
DC plans.
Conditional 1/n strategy ⇒ allocation equally among chosen
subset of funds.
Such strategies minimize future regret from one asset class
beating the other.
4.3 Company Stock: Investing in the Familiar
Reasons why employees have a tendency to invest in their
company’s stocks:
Familiarity bias.
Overconfidence.
Naively extrapolate past returns.
Framing.
Loyalty effect & financial incentives.
4.4 Excessive Trading
Investors with retail accounts appear to be more active trades
(overconfidence which leads to excessive trading).
Disposition effect⇒ selling winners too soon & holding losers
too long.
4.5 Home Bias
Proportion of assets in the stocks of firms listed in home
country.
Closely related to familiarity.
Copyright © FinQuiz.com. All rights reserved.
4
2013, Study Session # 3, Reading # 9
5. BEHAVIORAL FINANCE AND ANALYST FORECASTS
5.1 Overconfidence in Forecasting Skills
Undue faith in forecasting ability.
Several behavioral biases that contribute to overconfidence:
Illusion of knowledge bias.
Self attribution bias.
Representativeness bias
Availability bias.
Hindsight bias.
5.1.1 Remedial Actions for Overconfidence and Related Biases
Self calibration ⇒ process of remembering previous forecasts
more accurately.
Well structured feedback, unambiguous forecasts &
systematic review process can reduce hindsight bias.
Counter arguments, appraisal by colleagues, superiors as well
as self appraisal can help to control overconfidence.
Incorporate additional information with a Bayesian approach.
5.2 Influence of Company's Management on Analysis
The way a company’s management frames information can
influence how analysts interpret it & include it in their forecasts.
Three cognitive biases frequently seen when management
reports company results:
Framing
Anchoring & adjustment
Availability
Analysts should also look for self attribution bias that arises from
the impact of incentive compensation on company reporting.
5.3 Analyst Biases in Conducting Research
Biases are usually related to analysts collecting too much information
some biases are:
Illusion of knowledge & control.
Representativeness bias.
Confirmation bias.
Gambler’s fallacy ⇒ thinking that there will be a reversal to longterm mean more frequently than actually happens.
Hot hand fallacy ⇒ wrongly project continuation of a recent trend.
Endowment bias.
5.3.1 Remedial Actions for Analyst Biases in Conducting Research
Focus on more objective data.
Collect information in a symmetric way.
Assign probabilities to base rates.
Consider the search process, limits & context of information.
Prompt feedback & document decision making.
Copyright © FinQuiz.com. All rights reserved.
5
2013, Study Session # 3, Reading # 9
6. HOW BEHAVIORAL FACTORS AFFECT COMMITTEE DECISION MAKING
In a group setting, the individual biases mentioned before can be
either diminished or amplified with additional biases being created.
Social proof bias ⇒ bias in which individuals are biased to follow the
beliefs of a group.
Typically a group will have more confidence in its decisions (leads to
overconfidence bias).
6.1 Investment Committee Dynamics
Committee decision can be improved by carefully analyzing
& learning from past decisions & good quality feedback.
Changing committee membership can be unhelpful.
6.2 Techniques for Structuring and Operating
Committees to Address Behavioral Factors
Committee should be made up of members from diverse
backgrounds.
Ensure professional respect & analysts self esteem.
Collect individual views in advance of discussion (can
suppressed privately held information).
7. HOW BEHAVIORAL FINANCE INFLUENCES MARKET BEHAVIOR
Anomalies are identified by persistent abnormal returns that
differ from zero & are predictable in direction.
Some apparent anomalies may be explained by:
Small sample involved.
Selection or survivorship bias.
Data mining.
7.2 Momentum
Momentum effect ⇒ pattern of returns that is correlated
with the recent past.
Return are +vely correlated in short term (up to 2 years) &
-vely correlated in long term (revert to the mean).
Several forms of Biases.
Herding
Availability bias (extrapolate trends).
Hindsight bias (trend chasing effect).
Disposition effect (mean reversion at longer periods
of three to five years).
Copyright © FinQuiz.com. All rights reserved.
6
2013, Study Session # 3, Reading # 9
7.3 Bubbles and Crashes
Bubble & crashes ⇒ respectively periods of unusual +ve or –ve return.
Bubbles typically develop more slowly relatively to crashes (due to
difference in behavioral factor involved).
A no. of cognitive & emotional biases during such periods are:
Overconfidence.
Confirmation & self attribution bias.
Hindsight.
Illusion of knowledge.
Disposition effect.
Anchoring.
7.4 Value and Growth
Studies have identified that the value stocks have outperformed relative
to growth stocks.
Halo affect ⇒ investor transfers favorable company attribute into thinking
that the stock is a good buy.
Behavioral explanations present the anomalies as mispricing rather than
risk.
Overconfidence in predicting growth rates (growth stocks over valuation).
Home bias anomaly ⇒ investors favor investing in domestic country as
compared to foreign countries.
Copyright © FinQuiz.com. All rights reserved.
7