Marks’ basic medical biochemistry a clinical approach, 2nd edition colleen smith
Bạn đang xem bản rút gọn của tài liệu. Xem và tải ngay bản đầy đủ của tài liệu tại đây (25.64 MB, 922 trang )
Marks’ Basic Medical Biochemistry: A Clinical Approach, 2nd Edition
•
•
•
•
•
•
•
•
•
•
•
•
•
•
•
•
•
•
•
•
•
•
•
•
•
•
•
•
•
•
•
•
•
•
•
•
•
•
•
•
•
•
•
•
•
•
•
•
•
Chapter 1: Metabolic Fuels and Dietary Components
Chapter 2: The Fed or Absorptive State
Chapter 3: Fasting
Chapter 4: Water, Acids, Bases, and Buffers
Chapter 5: Structures of the Major Compounds of the Body
Chapter 6: Amino Acids in Proteins
Chapter 7: Structure–Function Relationships in Proteins
Chapter 8: Enzymes as Catalysts
Chapter 9: Regulation of Enzymes
Chapter 10: Relationship Between Cell Biology and Biochemistry
Chapter 11: Cell Signaling by Chemical Messengers
Chapter 12: Structure of the Nucleic Acids
Chapter 13: Synthesis of DNA
Chapter 14: Transcription: Synthesis of RNA
Chapter 15: Translation: Synthesis of Proteins
Chapter 16: Regulation of Gene Expression
Chapter 17: Use of Recombinant DNA Techniques in Medicine
Chapter 18: The Molecular Biology of Cancer
Chapter 19: Cellular Bioenergetics: ATP And O2
Chapter 20: Tricarboxylic Acid Cycle
Chapter 21: Oxidative Phosphorylation and Mitochondrial Function
Chapter 22: Generation of ATP from Glucose: Glycolysis
Chapter 23: Oxidation of Fatty Acids and Ketone Bodies
Chapter 24: Oxygen Toxicity and Free Radical Injury
Chapter 25: Metabolism of Ethanol
Chapter 26: Basic Concepts in the Regulation of Fuel Metabolism by Insulin, Glucagon, and Other
Hormones
Chapter 27: Digestion, Absorption, and Transport of Carbohydrates
Chapter 28: Formation and Degradation of Glycogen
Chapter 29: Pathways of Sugar Metabolism: Pentose Phosphate Pathway, Fructose, and Galactose
Metabolism
Chapter 30: Synthesis of Glycosides, Lactose, Glycoproteins and Glycolipids
Chapter 31: Gluconeogenesis and Maintenance of Blood Glucose Levels
Chapter 32: Digestion and Transport of Dietary Lipids
Chapter 33: Synthesis of Fatty Acids, Triacylglycerols, and the Major Membrane Lipids
Chapter 34: Cholesterol Absorption, Synthesis, Metabolism, and Fate
Chapter 35: Metabolism of the Eicosanoids
Chapter 36: Integration of Carbohydrate and Lipid Metabolism
Chapter 37: Protein Digestion and Amino Acid Absorption
Chapter 38: Fate of Amino Acid Nitrogen: Urea Cycle
Chapter 39: Synthesis and Degradation of Amino Acids
Chapter 40: Tetrahydrofolate, Vitamin B12, And S-Adenosylmethionine
Chapter 41: Purine and Pyrimidine Metabolism
Chapter 42: Intertissue Relationships in the Metabolism of Amino Acids
Chapter 43: Actions of Hormones That Regulate Fuel Metabolism
Chapter 44: The Biochemistry of the Erythrocyte and other Blood Cells
Chapter 45: Blood Plasma Proteins, Coagulation and Fibrinolysis
Chapter 46: Liver Metabolism
Chapter 47: Metabolism of Muscle at Rest and During Exercise
Chapter 48: Metabolism of the Nervous System
Chapter 49: The Extracellular Matrix and Connective Tissue
SECTION ONE
Fuel Metabolism
n order to survive, humans must meet two basic metabolic requirements: we
must be able to synthesize everything our cells need that is not supplied by our
diet, and we must be able to protect our internal environment from toxins and
changing conditions in our external environment. In order to meet these
requirements, we metabolize our dietary components through four basic types
of pathways: fuel oxidative pathways, fuel storage and mobilization pathways,
biosynthetic pathways, and detoxification or waste disposal pathways. Cooperation
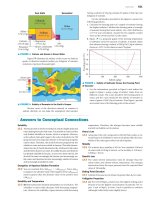
between tissues and responses to changes in our external environment are communicated though transport pathways and intercellular signaling pathways (Fig. I.1).
The foods in our diet are the fuels that supply us with energy in the form of calories. This energy is used for carrying out diverse functions such as moving, thinking, and reproducing. Thus, a number of our metabolic pathways are fuel oxidative
pathways that convert fuels into energy that can be used for biosynthetic and
mechanical work. But what is the source of energy when we are not eating—
between meals, and while we sleep? How does the hunger striker in the morning
headlines survive so long? We have other metabolic pathways that are fuel storage
pathways. The fuels that we store can be molibized during periods when we are not
eating or when we need increased energy for exercise.
Our diet also must contain the compounds we cannot synthesize, as well as all
the basic building blocks for compounds we do synthesize in our biosynthetic pathways. For example we have dietary requirements for some amino acids, but we can
synthesize other amino acids from our fuels and a dietary nitrogen precursor. The
compounds required in our diet for biosynthetic pathways include certain amino
acids, vitamins, and essential fatty acids.
Detoxification pathways and waste disposal pathways are metabolic pathways
devoted to removing toxins that can be present in our diets or in the air we breathe,
introduced into our bodies as drugs, or generated internally from the metabolism of
dietary components. Dietary components that have no value to the body, and must
be disposed of, are called xenobiotics.
In general, biosynthetic pathways (including fuel storage) are referred to as anabolic pathways, that is, pathways that synthesize larger molecules from smaller
components. The synthesis of proteins from amino acids is an example of an anabolic pathway. Catabolic pathways are those pathways that break down larger molecules into smaller components. Fuel oxidative pathways are examples of catabolic
pathways.
In the human, the need for different cells to carry out different functions has
resulted in cell and tissue specialization in metabolism. For example, our adipose
tissue is a specialized site for the storage of fat and contains the metabolic pathways
that allow it to carry out this function. However, adipose tissue is lacking many of
the pathways that synthesize required compounds from dietary precursors. To
enable our cells to cooperate in meeting our metabolic needs during changing conditions of diet, sleep, activity, and health, we need transport pathways into the blood
and between tissues and intercellular signaling pathways. One means of communication is for hormones to carry signals to tissues about our dietary state. For example, a message that we have just had a meal, carried by the hormone insulin, signals
adipose tissue to store fat.
I
Dietary
components
Fuels:
Carbohydrate
Fat
Protein
Vitamins
Minerals
H2O
Xenobiotics
Digestion
absorption,
transport
Compounds
in cells
Fuel storage
pathways
Biosynthetic
pathways
Body
components
Fuel
stores
Detoxification
and waste
disposal
pathways
Waste
products
CO2
H2O
O2
Fuel
oxidative
pathways
Energy
Fig. I.1. General metabolic routes for dietary
components in the body. The types of Pathways are named in blue.
1
In the following section, we will provide an overview of various types of dietary
components and examples of the pathways involved in utilizing these components.
We will describe the fuels in our diet, the compounds produced by their digestion,
and the basic patterns of fuel metabolism in the tissues of our bodies. We will
describe how these patterns change when we eat, when we fast for a short time, and
when we starve for prolonged periods. Patients with medical problems that involve
an inability to deal normally with fuels will be introduced. These patients will
appear repeatedly throughout the book and will be joined by other patients as we
delve deeper into biochemistry.
2
1
Metabolic Fuels and Dietary
Components
Fuel Metabolism. We obtain our fuel primarily from carbohydrates, fats, and
proteins in our diet. As we eat, our foodstuffs are digested and absorbed. The
products of digestion circulate in the blood, enter various tissues, and are eventually taken up by cells and oxidized to produce energy. To completely convert our
fuels to carbon dioxide (CO2) and water (H2O), molecular oxygen (O2) is
required. We breathe to obtain this oxygen and to eliminate the carbon dioxide
(CO2) that is produced by the oxidation of our foodstuffs.
Fuel Stores. Any dietary fuel that exceeds the body’s immediate energy needs
is stored, mainly as triacylglycerol (fat) in adipose tissue, as glycogen (a carbohydrate) in muscle, liver, and other cells, and, to some extent, as protein in muscle.
When we are fasting, between meals and overnight while we sleep, fuel is drawn
from these stores and is oxidized to provide energy (Fig. 1.1).
Fuel Requirements. We require enough energy each day to drive the basic
functions of our bodies and to support our physical activity. If we do not consume enough food each day to supply that much energy, the body’s fuel stores
supply the remainder, and we lose weight. Conversely, if we consume more food
than required for the energy we expend, our body’s fuel stores enlarge, and we
gain weight.
Other Dietary Requirements. In addition to providing energy, the diet provides
precursors for the biosynthesis of compounds necessary for cellular and tissue
structure, function, and survival. Among these precursors are the essential fatty
acids and essential amino acids (those that the body needs but cannot synthesize).
The diet must also supply vitamins, minerals, and water.
Waste Disposal. Dietary components that we can utilize are referred to as
nutrients. However, both the diet and the air we breathe contain xenobiotic compounds, compounds that have no use or value in the human body and may be
toxic. These compounds are excreted in the urine and feces together with metabolic waste products.
Essential Nutrients
Fuels
Carbohydrates
Fats
Proteins
Required Components
Essential amino acids
Essential fatty acids
Vitamins
Minerals
Water
Excess dietary fuel
Fed
Fuel stores:
Fat
Glycogen
Protein
Fasting
Oxidation
Energy
Fig. 1.1. Fate of excess dietary fuel in fed and
fasting states.
THE
WAITING
ROOM
Percy Veere is a 59-year-old school teacher who was in good health until
his wife died suddenly. Since that time, he has experienced an increasing
degree of fatigue and has lost interest in many of the activities he previously enjoyed. Shortly after his wife’s death, one of his married children moved
far from home. Since then, Mr. Veere has had little appetite for food. When a
Percy Veere has a strong will. He is
enduring a severe reactive depression after the loss of his wife. In
addition, he must put up with the sometimes
life-threatening antics of his hyperactive
grandson, Dennis (the Menace) Veere. Yet
through all of this, he will “persevere.”
3
4
SECTION ONE / FUEL METABOLISM
neighbor found Mr. Veere sleeping in his clothes, unkempt, and somewhat confused, she called an ambulance. Mr. Veere was admitted to the hospital psychiatry unit with a diagnosis of mental depression associated with dehydration and
malnutrition.
Otto Shape is a 25-year-old medical student who was very athletic during
high school and college, and is now “out-of-shape.” Since he started medical school, he has been gaining weight (at 5 feet 10 inches tall, he currently weighs 187 lb). He has decided to consult a physician at the student health
service before the problem gets worse.
Heat
ATP
CO2
Energy production
Carbohydrate
Lipid
Protein
O2
Energy utilization
Biosynthesis
Detoxification
Muscle contraction
Active ion transport
Thermogenesis
ADP + Pi
Fig. 1.2. The ATP–ADP cycle.
Oxidative pathways are catabolic; that is, they break molecules down. In contrast, anabolic
pathways build molecules up from component pieces.
Amino acids
e–
e–
e–
Acetyl CoA
TCA
cycle
CO2
CO2
e–
electron
transport
chain
H2O
Ann O’Rexia is a 23-year-old buyer for a woman’s clothing store.
Despite the fact that she is 5 feet 7 inches tall and weighs 99 lb, she is
convinced she is overweight. Two months ago, she started a daily exercise program that consists of 1 hour of jogging every morning and 1 hour of
walking every evening. She also decided to consult a physician about a weight
reduction diet.
I.
Fatty acids
Glucose
ATP
Ivan Applebod is a 56-year-old accountant who has been morbidly
obese for a number of years. He exhibits a pattern of central obesity,
called an “apple shape,” which is caused by excess adipose tissue
deposited in the abdominal area. His major recreational activities are watching
TV while drinking scotch and soda and doing occasional gardening. At a company picnic, he became very “winded” while playing baseball and decided it was
time for a general physical examination. At the examination, he weighed 264 lb
at 5 feet 10 inches tall. His blood pressure was slightly elevated, 155 mm Hg systolic (normal ϭ 140 mm Hg or less) and 95 mm Hg diastolic (normal ϭ 90 mm
Hg or less).
O2
Fig. 1.3. Generation of ATP from fuel components during respiration. Glucose, fatty acids,
and amino acids are oxidized to acetyl CoA, a
substrate for the TCA cycle. In the TCA cycle,
they are completely oxidized to CO2. As fuels
are oxidized, electrons (eϪ) are transferred to
O2 by the electron transport chain, and the
energy is used to generate ATP.
DIETARY FUELS
The major fuels we obtain from our diet are carbohydrates, proteins, and fats. When
these fuels are oxidized to CO2 and H2O in our cells, energy is released by the transfer of electrons to O2. The energy from this oxidation process generates heat and
adenosine triphosphate (ATP) (Fig 1.2). Carbon dioxide travels in the blood to the
lungs, where it is expired, and water is excreted in urine, sweat, and other secretions. Although the heat that is generated by fuel oxidation is used to maintain body
temperature, the main purpose of fuel oxidation is to generate ATP. ATP provides
the energy that drives most of the energy-consuming processes in the cell, including biosynthetic reactions, muscle contraction, and active transport across membranes. As these processes use energy, ATP is converted back to adenosine diphosphate (ADP) and inorganic phosphate (Pi). The generation and utilization of ATP is
referred to as the ATP–ADP cycle.
The oxidation of fuels to generate ATP is called respiration (Fig. 1.3). Before
oxidation, carbohydrates are converted principally to glucose, fat to fatty acids,
and protein to amino acids. The pathways for oxidizing glucose, fatty acids, and
amino acids have many features in common. They first oxidize the fuels to acetyl
CoA, a precursor of the tricarboxylic acid (TCA) cycle. The TCA cycle is a
series of reactions that completes the oxidation of fuels to CO2 (see Chapter 19).
Electrons lost from the fuels during oxidative reactions are transferred to O2 by
a series of proteins in the electron transport chain (see Chapter 20). The energy
of electron transfer is used to convert ADP and Pi to ATP by a process known as
oxidative phosphorylation.
CHAPTER 1 / METABOLIC FUELS AND DIETARY COMPONENTS
In discussions of metabolism and nutrition, energy is often expressed in units of
calories. “Calorie” in this context really means kilocalorie (kcal). Energy is also
expressed in joules. One kilocalorie equals 4.18 kilojoules (kJ). Physicians tend to
use units of calories, in part because that is what their patients use and understand.
A. Carbohydrates
The major carbohydrates in the human diet are starch, sucrose, lactose, fructose,
and glucose. The polysaccharide starch is the storage form of carbohydrates in
plants. Sucrose (table sugar) and lactose (milk sugar) are disaccharides, and fructose and glucose are monosaccharides. Digestion converts the larger carbohydrates
to monosaccharides, which can be absorbed into the bloodstream. Glucose, a monosaccharide, is the predominant sugar in human blood (Fig. 1.4).
Oxidation of carbohydrates to CO2 and H2O in the body produces approximately
4 kcal/g (Table 1.1). In other words, every gram of carbohydrate we eat yields
approximately 4 kcal of energy. Note that carbohydrate molecules contain a significant amount of oxygen and are already partially oxidized before they enter our bodies (see Fig. 1.4).
B. Proteins
5
The food “calories” used in everyday speech are really “Calories,”
which ϭ kilocalories.
“Calorie,”
meaning kilocalorie, was originally spelled
with a capital C, but the capitalization was
dropped as the term became popular. Thus, a
1-calorie soft drink actually has 1 Cal (1 kcal) of
energy.
Table 1.1. Caloric Content of Fuels
kcal/g
Carbohydrate
Fat
Protein
Alcohol
4
9
4
7
Proteins are composed of amino acids that are joined to form linear chains (Fig. 1.5).
In addition to carbon, hydrogen, and oxygen, proteins contain approximately 16%
nitrogen by weight. The digestive process breaks down proteins to their constituent
amino acids, which enter the blood. The complete oxidation of proteins to CO2, H2O,
and NH4ϩ in the body yields approximately 4 kcal/g.
C. Fats
Fats are lipids composed of triacylglycerols (also called triglycerides). A triacylglycerol molecule contains 3 fatty acids esterified to one glycerol moiety (Fig. 1.6).
Fats contain much less oxygen than is contained in carbohydrates or proteins.
Therefore, fats are more reduced and yield more energy when oxidized. The complete oxidation of triacylglycerols to CO2 and H2O in the body releases approximately 9 kcal/g, more than twice the energy yield from an equivalent amount of carbohydrate or protein.
CH2 OH
O
CH2 OH
O
O
OH
OH
HO
CH2 OH
O
O
HO
CH2 OH
O
O
OH
CH2
O
O
OH
HO
or
O
OH
HO
Starch
(Diet)
An analysis of Ann O’Rexia’s diet
showed she ate 100 g carbohydrate,
20 g protein, and 15 g fat each day.
Approximately how many calories did she
consume per day?
Glycogen
(Body stores)
HO
CH2 OH
O
C
H
H
H
C
C
H OH
HO OH
C
C
H
OH
Glucose
Fig. 1.4. Structure of starch and glycogen. Starch, our major dietary carbohydrate, and glycogen, the body’s storage form of glucose, have similar structures. They are polysaccharides (many sugar units) composed of glucose, which is a monosaccharide (one sugar unit). Dietary disaccharides are composed of two sugar units.
6
SECTION ONE / FUEL METABOLISM
Miss O’Rexia consumed
100 ϫ 4 ϭ 400 kcal as carbohydrate
20 ϫ 4 ϭ 80 kcal as protein
15 ϫ 9 ϭ 135 kcal as fat
NH
R1
O
CH
C
O
NH
CH
C
NH
R3
O
CH
C
R
+
H3N
CH
COO–
R2
for a total of 615 kcal/day.
Protein
Amino acid
Fig. 1.5. General structure of proteins and amino acids. R ϭ side chain. Different amino
acids have different side chains. For example, R1 might be –CH3; R2,
; R3, –CH2 –COOϪ.
O
O
CH3
(CH2)7
CH
CH
(CH2)7
C
CH2
O
O
(CH2)14 CH3
O
CH
CH2
C
O
C
(CH2)16 CH3
Triacylglycerol
CH2 OH
HO
C H
O
CH3
CH2OH
(CH2)14 C
O–
Palmitate
Glycerol
O
CH3 (CH2)7
CH
CH
(CH2)7
C
O–
Oleate
O
CH3
(CH2)16
C
O–
Stearate
Fig. 1.6. Structure of a triacylglycerol. Palmitate and stearate are saturated fatty acids, i.e.,
they have no double bonds. Oleate is monounsaturated (one double bond). Polyunsaturated
fatty acids have more than one double bond.
Ivan Applebod ate 585 g carbohydrate, 150 g protein, and 95 g fat
each day. In addition, he drank 45 g
alcohol. How many calories did he consume
per day?
D. Alcohol
Many people used to believe that alcohol (ethanol, in the context of the diet) has no
caloric content. In fact, ethanol (CH3CH2OH) is oxidized to CO2 and H2O in the body
and yields approximately 7 kcal/g—that is, more than carbohydrate but less than fat.
II. BODY FUEL STORES
It is not surprising that our body
fuel stores consist of the same
kinds of compounds found in our
diet, because the plants and animals we eat
also store fuels in the form of starch or
glycogen, triacylglycerols, and proteins.
Although some of us may try, it is virtually impossible to eat constantly. Fortunately,
we carry supplies of fuel within our bodies (Fig. 1.7). These fuel stores are light in
weight, large in quantity, and readily converted into oxidizable substances. Most of
us are familiar with fat, our major fuel store, which is located in adipose tissue.
Although fat is distributed throughout our bodies, it tends to increase in quantity in
our hips and thighs and in our abdomens as we advance into middle age. In addition
to our fat stores, we also have important, although much smaller, stores of carbohydrate in the form of glycogen located primarily in our liver and muscles. Glycogen
CHAPTER 1 / METABOLIC FUELS AND DIETARY COMPONENTS
Muscle glycogen
0.15 kg (0.4%)
Liver glycogen
0.08 kg (0.2%)
7
Mr. Applebod consumed
585 ϫ 4 ϭ 2,340 kcal as carbohydrate
150 ϫ 4 ϭ 600 kcal as protein
95 ϫ 9 ϭ 855 kcal as fat
45 ϫ 7 ϭ 315 kcal as alcohol
for a total of 4,110 kcal/day.
Fat
15 kg (85%)
Protein
6 kg (14.5%)
Fig. 1.7. Fuel composition of the average 70-kg man after an overnight fast (in kilograms
and as percentage of total stored calories).
consists of glucose residues joined together to form a large, branched polysaccharide
(see Fig. 1.4). Body protein, particularly the protein of our large muscle masses, also
serves to some extent as a fuel store, and we draw on it for energy when we fast.
A. Fat
Our major fuel store is adipose triacylglycerol (triglyceride), a lipid more commonly
known as fat. The average 70-kg man has approximately 15 kg stored triacylglycerol,
which accounts for approximately 85% of his total stored calories (see Fig. 1.7).
Two characteristics make adipose triacylglycerol a very efficient fuel store: the
fact that triacylglycerol contains more calories per gram than carbohydrate or protein (9 kcal/g versus 4 kcal/g) and the fact that adipose tissue does not contain much
water. Adipose tissue contains only about 15% water, compared to tissues such as
muscle that contain about 80%. Thus, the 70-kg man with 15 kg stored triacylglycerol has only about 18 kg adipose tissue.
B. Glycogen
Our stores of glycogen in liver, muscle, and other cells are relatively small in quantity but are nevertheless important. Liver glycogen is used to maintain blood
glucose levels between meals. Thus, the size of this glycogen store fluctuates during the day; an average 70-kg man might have 200 g or more of liver glycogen after
a meal but only 80 g after an overnight fast. Muscle glycogen supplies energy for
muscle contraction during exercise. At rest, the 70-kg man has approximately 150 g
of muscle glycogen. Almost all cells, including neurons, maintain a small emergency supply of glucose as glycogen.
C. Protein
In biochemistry and nutrition, the
standard reference is often the
70-kg (154-lb) man. This standard
probably was chosen because in the first
half of the 20th century, when many nutritional studies were performed, young
healthy medical and graduate students (who
were mostly men) volunteered to serve as
subjects for these experiments.
What would happen to a 70-kg
man if the 135,000 kcal stored as
triacylglycerols in his 18 kg of adipose tissue were stored instead as skeletal
muscle glycogen? It would take approximately 34 kg glycogen to store as many calories. Glycogen, because it is a polar molecule with –OH groups, binds approximately
4 times its weight in water, or 136 kg. Thus,
his fuel stores would weigh 170 kg.
Protein serves many important roles in the body; unlike fat and glycogen, it is not
solely a fuel store. Muscle protein is essential for body movement. Other proteins
serve as enzymes (catalysts of biochemical reactions) or as structural components
of cells and tissues. Only a limited amount of body protein can be degraded, approximately 6 kg in the average 70-kg man, before our body functions are compromised.
III. DAILY ENERGY EXPENDITURE
If we want to stay in energy balance, neither gaining nor losing weight, we must, on
average, consume an amount of food equal to our daily energy expenditure. The
daily energy expenditure (DEE) includes the energy to support our basal metabolism
(basal metabolic rate or resting metabolic rate) and our physical activity, plus the
energy required to process the food we eat (diet-induced thermogenesis).
Daily energy expenditure ϭ
RMR ϩ Physical Activity ϩ DIT
where RMR is the resting metabolic rate and DIT is diet-induced thermogenesis. BMR (basal metabolic rate) is used
interchangeably with RMR in this equation.
8
SECTION ONE / FUEL METABOLISM
A. Resting Metabolic Rate
Table 1.2. Factors Affecting BMR
Expressed per kg Body Weight
Gender (males higher than females)
Body temperature (increased with fever)
Environmental temperature (increased in cold)
Thyroid status (increased in hyperthyroidism)
Pregnancy and lactation (increased)
Age (decreases with age)
What are Ivan Applebod’s and Ann
O’Rexia’s RMR? (Compare the
method for a rough estimate to values obtained with equations in Table 1.3.)
Registered dieticians use extensive
tables for calculating energy
requirements, based on height,
weight, age, and activity level. A more accurate calculation is based on the fat-free mass
(FFM), which is equal to the total body mass
minus the mass of the person’s adipose tissue. With FFM, the BMR is calculated using
the equation BMR ϭ 186 ϩ FFM ϫ 23.6 kcal/
kg per day. This formula eliminates differences between sexes and between aged versus young individuals that are attributable to
differences in relative adiposity. However,
determining FFM is relatively cumbersome—
it requires weighing the patient underwater
and measuring the residual lung volume.
Indirect calorimetry, a technique that
measures O2 consumption and CO2 production, can be used when more accurate determinations are required for hospitalized
patients. A portable indirect calorimeter is
used to measure oxygen consumption and
the respiratory quotient (RQ), which is the
ratio of O2 consumed to CO2 produced. The
RQ is 1.00 for individuals oxidizing carbohydrates, 0.83 for protein, and 0.71 for fat.
From these values, the daily energy expenditure (DEE) can be determined.
The resting metabolic rate (RMR) is a measure of the energy required to maintain
life: the functioning of the lungs, kidneys and brain, the pumping of the heart, the
maintenance of ionic gradients across membranes, the reactions of biochemical pathways, and so forth. Another term used to describe basal metabolism is the basal
metabolic rate (BMR). The BMR was originally defined as the energy expenditure
of a person mentally and bodily at rest in a thermoneutral environment 12 to18 hours
after a meal. However, when a person is awakened and their heat production or oxygen consumption is measured, they are no longer sleeping or totally at mental rest,
and their metabolic rate is called the resting metabolic rate (RMR). It is also sometimes called the resting energy expenditure (REE). The RMR and BMR differ very
little in value.
The BMR, which is usually expressed in kcal/day, is affected by body size, age,
sex, and other factors (Table 1.2). It is proportional to the amount of metabolically
active tissue (including the major organs) and to the lean (or fat-free) body mass.
Obviously, the amount of energy required for basal functions in a large person is
greater than the amount required in a small person. However, the BMR is usually
lower for women than for men of the same weight because women usually have
more metabolically inactive adipose tissue. Body temperature also affects the BMR,
which increases by 12% with each degree centigrade increase in body temperature
(i.e., “feed a fever; starve a cold”). The ambient temperature affects the BMR,
which increases slightly in colder climates as thermogenesis is activated. Excessive
secretion of thyroid hormone (hyperthyroidism) causes the BMR to increase,
whereas diminished secretion (hypothyroidism) causes it to decrease. The BMR
increases during pregnancy and lactation. Growing children have a higher BMR per
kilogram body weight than adults, because a greater proportion of their bodies is
composed of brain, muscle, and other more metabolically active tissues. The BMR
declines in aging individuals because their metabolically active tissue is shrinking
and body fat is increasing. In addition, large variations exist in BMR from one adult
to another, determined by genetic factors.
A rough estimate of the BMR may be obtained by assuming it is 24
kcal/day/kg body weight and multiplying by the body weight. An easy way to
remember this is 1 kcal/kg/hr. This estimate works best for young individuals who
are near their ideal weight. More accurate methods for calculating the BMR use
empirically derived equations for different gender and age groups (Table 1.3).
Even these calculations do not take into account variation among individuals.
B. Physical Activity
In addition to the RMR, the energy required for physical activity contributes to the
DEE. The difference in physical activity between a student and a lumberjack is
enormous, and a student who is relatively sedentary during the week may be much
Table 1.3. Equation for Predicting BMR from Body Weight (W) in kg
Males
Age Range
(years)
0–3
3–10
10–18
18–30
30–60
>60
Females
BMR
kcal/day
60.9W
22.7W
17.5W
15.3W
11.6W
13.5W
Ϫ
ϩ
ϩ
ϩ
ϩ
ϩ
54
495
651
679
879
487
Age Range
(years)
0–3
3–10
10–18
18–30
30–60
Ͼ60
BMR
kcal/day
61.0W
22.5W
12.2W
14.7W
8.7W
10.5W
Ϫ
ϩ
ϩ
ϩ
ϩ
ϩ
51
499
746
496
829
596
From Energy and protein requirements: report of a Joint FAO/WHO/UNU Expert Consultation. Technical
report series no. 724. Geneva World Health Organization, 1987:71. See also Schofield et al. Hum Nutr Clin
Nutr 1985;39 (suppl).
CHAPTER 1 / METABOLIC FUELS AND DIETARY COMPONENTS
Table 1.4. Typical Activities with Corresponding Hourly Activity Factors
ACTIVITY CATEGORY
Resting: sleeping, reclining
Very light: seated and standing activities, driving,
laboratory work, typing, sewing, ironing, cooking,
playing cards, playing a musical instrument
Light: walking on a level surface at 2.5–3 mph,
garage work, electrical trades, carpentry, restaurant trades,
house cleaning, golf, sailing, table tennis
Moderate: walking 3.5–4 mph, weeding and hoeing,
carrying loads, cycling, skiing, tennis, dancing
Heavy: walking uphill with a load, tree felling,
heavy manual digging, mountain climbing, basketball,
football, soccer
Hourly Activity Factor
(for Time in Activity)
1.0
1.5
2.5
5.0
7.0
Reprinted with permission from Recommended Dietary Allowances, 10th Ed. Washington, DC: National
Academy Press, 1989.
The hourly activity factor is multiplied by the BMR (RMR) per hour times the number of hours
engaged in the activity to give the caloric expenditure for that activity. If this is done for all of the hours in
a day, the sum over 24 hours will approximately equal the daily energy expenditure.
more active during the weekend. Table 1.4 gives factors for calculating the approximate energy expenditures associated with typical activities.
A rough estimate of the energy required per day for physical activity can be
made by using a value of 30% of the RMR (per day) for a very sedentary person
(such as a medical student who does little but study) and a value of 60 to 70% of
the RMR (per day) for a person who engages in about 2 hours of moderate exercise
per day (see Table 1.4). A value of 100% or more of the RMR is used for a person
who does several hours of heavy exercise per day.
9
Mr. Applebod weighs 264 lb or 120
kg (264 lb divided by 2.2 lb/kg). His
estimated RMR ϭ 24 kcal/kg/day ϫ
120 ϭ 2,880 kcal/day. His RMR calculated from Table 1.3 is only 2,271 kcal (11.6
W ϩ 879 ϭ (11.6 ϫ 120) ϩ 879). Miss O’Rexia
weighs 99 lb or 45 kg (99/2.2 lb/kg). Her estimated RMR ϭ (24 kcal/kg/day) ϫ (45 kg) ϭ
1,080 kcal/day. Her RMR from Table 1.3 is
very close to this value (14.7 W ϩ 496 ϭ
1,157 kcal/day). Thus, the rough estimate
does not work well for obese patients
because a disproportionately larger proportion of their body weight is metabolically
inactive adipose tissue.
Based on the activities listed in
Table 1.4, the average U.S. citizen
is rather sedentary. Sedentary
habits correlate strongly with risk for cardiovascular disease, so it is not surprising that
cardiovascular disease is the major cause of
death in this country.
C. Diet-Induced Thermogenesis
Our DEE includes a component related to the intake of food known as diet-induced
thermogenesis (DIT) or the thermic effect of food (TEF). DIT was formerly called
the specific dynamic action (SDA). After the ingestion of food, our metabolic rate
increases because energy is required to digest, absorb, distribute, and store nutrients.
The energy required to process the types and quantities of food in the typical
American diet is probably equal to approximately 10% of the kilocalories ingested.
This amount is roughly equivalent to the error involved in rounding off the caloric
content of carbohydrate, fat, and protein to 4, 9, and 4, respectively. Therefore, DIT
is often ignored and calculations are based simply on the RMR and the energy
required for physical activity.
D. Calculations of Daily Energy Expenditure
The total daily energy expenditure is usually calculated as the sum of the RMR
(in kcal/day) plus the energy required for the amount of time spent in each of the various types of physical activity (see Table 1.4). An approximate value for the daily
energy expenditure can be determined from the RMR and the appropriate percentage
of the RMR required for physical activity (given above). For example, a very sedentary medical student would have a DEE equal to the RMR plus 30% of the RMR (or
1.3 ϫ RMR) and an active person’s daily expenditure could be 2 times the RMR.
E. Healthy Body Weight
Ideally, we should strive to maintain a weight consistent with good health. Overweight people are frequently defined as more than 20% above their ideal weight.
But what is the ideal weight? The body mass index (BMI), calculated as
What are reasonable estimates for
Ivan Applebod’s and Ann O’Rexia’s
daily energy expenditure?
10
SECTION ONE / FUEL METABOLISM
BMI equals:
Weight/height2 (kg/m2)
or
Weight (lbs) ϫ 704
height2 (in2)
Where the height is measured without shoes
and the weight is measured with minimal
clothing.
BMI values of:
18.5 Ϫ 24.9 ϭ desirable
Ͻ18.5 ϭ underweight
25 Ϫ 29.9 ϭ overweight
Ն30 ϭ obese
Are Ivan Applebod and Ann
O’Rexia in a healthy weight range?
weight/height2 (kg/m2), is currently the preferred method for determining whether
a person’s weight is in the healthy range.
In general, adults with BMI values below 18.5 are considered underweight.
Those with BMIs between 18.5 and 24.9 are considered to be in the healthy weight
range, between 25 and 29.9 are in the overweight or preobese range, and above 30
are in the obese range.
F. Weight Gain and Loss
To maintain our body weight, we must stay in caloric balance. We are in caloric
balance if the kilocalories in the food we eat equal our DEE. If we eat less food
than we require for our DEE, our body fuel stores supply the additional calories,
To evaluate a patient’s weight, physicians need standards of obesity applicable in a genetically heterogeneous population. Life insurance industry statistics have been used to develop tables giving the weight ranges, based on
gender, height, and body frame size, that are associated with the greatest longevity,
such as the Metropolitan Height and Weight Tables. However, these tables are considered inadequate for a number of reasons (e.g., they reflect data from upper-middle-class white groups). The BMI is the classification that is currently used clinically.
It is based on two simple measurements, height without shoes and weight with minimal clothing. Patients can be shown their BMI in a nomogram and need not use calculations. The healthy weight range coincides with the mortality data derived from
life insurance tables. The BMI also shows a good correlation with independent measures of body fat. The major weakness of the use of the BMI is that some very muscular individuals may be classified as obese when they are not. Other measurements to
estimate body fat and other body compartments, such as weighing individuals underwater, are more difficult, expensive, and time consuming and have generally been
confined to research purposes.
Height*
6'6"
18.5
BMI (Body Mass Index)
25
30
6'5"
6'4"
6'3"
6'2"
6'1"
6'0"
5'11"
5'10"
5'9"
5'8"
5'7"
5'6"
Mr. Applebod’s BMR is 2,271
kcal/day. He is sedentary, so he
only requires approximately 30%
more calories for his physical activity. Therefore, his daily expenditure is approximately
2,271 ϩ (0.3 ϫ 2,271) or 1.3 ϫ 2,271 or 2,952
kcal/day. Miss O’Rexia’s BMR is 1,157
kcal/day. She performs 2 hours of moderate
exercise per day (jogging and walking), so
she requires approximately 65% more calories for her physical activity. Therefore, her
daily expenditure is approximately 1,157 ϩ
(0.65 ϫ 1157) or 1.65 ϫ 1,157 or 1,909
kcal/day.
5'5"
5'4"
5'3"
5'2"
5'1"
5'0"
4'11"
4'10"
50
75
100
125
150
175
Pounds†
200
225
*Without shoes
250
†Without
275
clothes
If patients are above or below ideal weight (such as Ivan Applebod or Ann O’Rexia),
the physician, often in consultation with a registered dietician, prescribes a diet designed
to bring the weight into the ideal range.
CHAPTER 1 / METABOLIC FUELS AND DIETARY COMPONENTS
and we lose weight. Conversely, if we eat more food than we require for our
energy needs, the excess fuel is stored (mainly in our adipose tissue), and we
gain weight (Fig. 1.8).
When we draw on our adipose tissue to meet our energy needs, we lose
approximately 1 lb whenever we expend approximately 3,500 calories more than
we consume. In other words, if we eat 1,000 calories less than we expend per
day, we will lose about 2 lb/week. Because the average individual’s food intake
is only about 2,000 to 3,000 calories/day, eating one-third to one-half the normal
amount will cause a person to lose weight rather slowly. Fad diets that promise
a loss of weight much more rapid than this have no scientific merit. In fact, the
rapid initial weight loss the fad dieter typically experiences is attributable largely
to loss of body water. This loss of water occurs in part because muscle tissue protein and liver glycogen are degraded rapidly to supply energy during the early
phase of the diet. When muscle tissue (which is approximately 80% water) and
glycogen (approximately 70% water) are broken down, this water is excreted
from the body.
IV. DIETARY REQUIREMENTS
In addition to supplying us with fuel and with general-purpose building blocks
for biosynthesis, our diet also provides us with specific nutrients that we need
to remain healthy. We must have a regular supply of vitamins and minerals and
of the essential fatty acids and essential amino acids. “Essential” means that
they are essential in the diet; the body cannot synthesize these compounds from
other molecules and therefore must obtain them from the diet. Nutrients that the
body requires in the diet only under certain conditions are called “conditionally
essential.”
The Recommended Dietary Allowance (RDA) and the Adequate Intake (AI) provide quantitative estimates of nutrient requirements. The RDA for a nutrient is the
average daily dietary intake level necessary to meet the requirement of nearly
all (97–98%) healthy individuals in a particular gender and life stage group. Life
stage group is a certain age range or physiologic status (i.e., pregnancy or lactation).
The RDA is intended to serve as a goal for intake by individuals. The AI is a
recommended intake value that is used when not enough data are available to establish an RDA.
11
Are Ivan Applebod and Ann
O’Rexia gaining or losing weight?
Positive caloric balance
Consumption > Expenditure
Caloric balance
Consumption = Expenditure
A. Carbohydrates
No specific carbohydrates have been identified as dietary requirements.
Carbohydrates can be synthesized from amino acids, and we can convert one type
Malnutrition, the absence of an adequate intake of nutrients, occurs in the
United States principally among children of families with incomes below the
poverty level, the elderly, individuals whose diet is influenced by alcohol and
drug usage, and those who make poor food choices. More than 13 million children in the
United States live in families with incomes below the poverty level. Of these, approximately 10% have clinical malnutrition, most often anemia resulting from inadequate iron
intake. A larger percentage have mild protein and energy malnutrition and exhibit growth
retardation, sometimes as a result of parental neglect. Childhood malnutrition may also
lead to learning failure and chronic illness later in life. A weight for age measurement is
one of the best indicators of childhood malnourishment because it is easy to measure,
and weight is one of the first parameters to change during malnutrition.
The term kwashiorkor refers to a disease originally seen in African children suffering
from a protein deficiency. It is characterized by marked hypoalbuminemia, anemia,
edema, pot belly, loss of hair, and other signs of tissue injury. The term marasmus is
used for prolonged protein–calorie malnutrition, particularly in young children.
Negative caloric balance
Consumption < Expenditure
Fig. 1.8. Caloric balance.
Ivan Applebod’s weight is classified as obese. His BMI is 264 lb ϫ
704/70 in2 ϭ 37.9. Ann O’Rexia is
underweight. Her BMI is 99 lb ϫ 704/67
in2 ϭ 15.5.
12
SECTION ONE / FUEL METABOLISM
Mr. Applebod expends about 2,952
kcal/day and consumes 4,110. By
this calculation, he consumes 1,158
more kcal than he expends each day and is
gaining weight. Miss O’Rexia expends 1,909
kcal/day while she consumes only 615.
Therefore, she expends 1,294 more kcal/day
than she consumes, so she is losing weight.
of carbohydrate to another. However, health problems are associated with the complete elimination of carbohydrate from the diet, partly because a low-carbohydrate
diet must contain higher amounts of fat to provide us with the energy we need.
High-fat diets are associated with obesity, atherosclerosis, and other health problems.
B. Essential Fatty Acids
Although most lipids required for cell structure, fuel storage, or hormone synthesis
can be synthesized from carbohydrates or proteins, we need a minimal level of certain dietary lipids for optimal health. These lipids, known as essential fatty acids, are
required in our diet because we cannot synthesize fatty acids with these particular
arrangements of double bonds. The essential fatty acids ␣-linoleic and ␣-linolenic
acid are supplied by dietary plant oils, and eicosapentaenoic acid (EPA) and docosahexaenoic acid (DHA) are supplied in fish oils. They are the precursors of the
eicosanoids (a set of hormone-like molecules that are secreted by cells in small quantities and have numerous important effects on neighboring cells). The eicosanoids
include the prostaglandins, thromboxanes, leukotrienes, and other related compounds.
C. Protein
The RDA for protein is approximately 0.8 g high-quality protein per kilogram of
ideal body weight, or approximately 60 g/day for men and 50 g/day for women.
“High-quality” protein contains all of the essential amino acids in adequate
amounts. Proteins of animal origin (milk, egg, and meat proteins) are high quality.
The proteins in plant foods are generally of lower quality, which means they are low
in one or more of the essential amino acids. Vegetarians may obtain adequate
amounts of the essential amino acids by eating mixtures of vegetables that complement each other in terms of their amino acid composition.
1.
Students often use mnemonics to
remember the essential amino
acids. One common mnemonic is
“Little TV tonight. Ha!” or LIL (lysineisoleucine-leucine) TV (threonine-valine) To
(tryptophan) PM (phenyl- alanine-methionine). (HA) (histidine-arginine)!
ESSENTIAL AMINO ACIDS
Different amino acids are used in the body as precursors for the synthesis of proteins and other nitrogen-containing compounds. Of the 20 amino acids commonly
required in the body for synthesis of protein and other compounds, nine amino acids
are essential in the diet of an adult human because they cannot be synthesized in the
body. These are lysine, isoleucine, leucine, threonine, valine, tryptophan, phenylalanine, methionine, and histidine.
Certain amino acids are conditionally essential, that is, required in the diet only
under certain conditions. Children and pregnant women have a high rate of protein synthesis to support growth, and require some arginine in the diet, although
it can be synthesized in the body. Histidine is essential in the diet of the adult in
very small quantities because adults efficiently recycle histidine. The increased
requirement of children and pregnant women for histidine is therefore much
larger than their increased requirement of other essential amino acids. Tyrosine
and cysteine are considered conditionally essential. Tyrosine is synthesized from
phenylalanine, and it is required in the diet if phenylalanine intake is inadequate,
or if an individual is congenitally deficient in an enzyme required to convert
phenylalanine to tyrosine (the congenital disease phenylketonuria). Cysteine is
synthesized by using sulfur from methionine, and it also may be required in the
diet under certain conditions.
2.
NITROGEN BALANCE
The proteins in the body undergo constant turnover; that is, they are constantly
being degraded to amino acids and resynthesized. When a protein is degraded,
CHAPTER 1 / METABOLIC FUELS AND DIETARY COMPONENTS
its amino acids are released into the pool of free amino acids in the body. The
amino acids from dietary proteins also enter this pool. Free amino acids can have
one of three fates: they are used to make proteins, they serve as precursors for
synthesis of essential nitrogen-containing compounds (e.g., heme, DNA, RNA),
or they are oxidized as fuel to yield energy. When amino acids are oxidized, their
nitrogen atoms are excreted in the urine principally in the form of urea. The urine
also contains smaller amounts of other nitrogenous excretory products (uric acid,
creatinine, and NH4ϩ) derived from the degradation of amino acids and compounds synthesized from amino acids (Table 1.5). Some nitrogen is also lost in
sweat, feces, and cells that slough off.
Nitrogen balance is the difference between the amount of nitrogen taken into
the body each day (mainly in the form of dietary protein) and the amount of
nitrogen in compounds lost (Table 1.6). If more nitrogen is ingested than
excreted, a person is said to be in positive nitrogen balance. Positive nitrogen
balance occurs in growing individuals (e.g., children, adolescents, and pregnant
women), who are synthesizing more protein than they are breaking down. Conversely, if less nitrogen is ingested than excreted, a person is said to be in negative nitrogen balance. A negative nitrogen balance develops in a person who is
eating either too little protein or protein that is deficient in one or more of the
essential amino acids. Amino acids are continuously being mobilized from body
proteins. If the diet is lacking an essential amino acid or if the intake of protein
is too low, new protein cannot be synthesized, and the unused amino acids will
be degraded, with the nitrogen appearing in the urine. If a negative nitrogen balance persists for too long, bodily function will be impaired by the net loss of critical proteins. In contrast, healthy adults are in nitrogen balance (neither positive
nor negative), and the amount of nitrogen consumed in the diet equals its loss in
urine, sweat, feces, and other excretions.
D. Vitamins
Vitamins are a diverse group of organic molecules required in very small quantities in the diet for health, growth, and survival (Latin vita, life). The absence of
a vitamin from the diet or an inadequate intake results in characteristic deficiency signs and, ultimately, death. Table 1.7 lists the signs or symptoms of deficiency for each vitamin, its RDA or AI for young adults, and common food
sources. The amount of each vitamin required in the diet is small (in the microgram or milligram range), compared with essential amino acid requirements (in
the gram range). The vitamins are often divided into two classes, water-soluble
vitamins and fat-soluble vitamins. This classification has little relationship to
their function but is related to the absorption and transport of fat-soluble vitamins with lipids.
Most vitamins are used for the synthesis of coenzymes, complex organic molecules that assist enzymes in catalyzing biochemical reactions, and the deficiency
symptoms reflect an inability of cells to carry out certain reactions. However, some
vitamins also act as hormones. We will consider the roles played by individual vitamins as we progress through the subsequent chapters of this text.
Although the RDA or AI for each vitamin varies with age and sex, the difference
is usually not very large once adolescence is reached. For example, the RDA for
Table 1.6. Nitrogen Balance
Positive Nitrogen Balance
Nitrogen Balance
Negative Nitrogen Balance
Growth (e.g., childhood, pregnancy)
Normal healthy adult
Dietary deficiency of total protein
or amino acids; catabolic stress
Dietary N Ͼ Excreted N
Dietary N ϭ Excreted N
Dietary N Ͻ Excreted N
13
Table 1.5. Major Nitrogenous Excretion
Products
Urea
Creatinine
Uric acid
NH4ϩ
Multiple
vitamin
deficiencies
accompanying malnutrition are far
more common in the United States
than the characteristic deficiency diseases
associated with diets lacking just one vitamin,
because we generally eat a variety of foods.
The characteristic deficiency diseases arising
from single vitamin deficiencies were often
identified and described in humans through
observations of populations consuming a
restricted diet because that was all that was
available. For example, thiamine deficiency
was discovered by a physician in Java, who
related the symptoms of beri-beri to diets
composed principally of polished rice. Today,
single vitamin deficiencies usually occur as a
result of conditions that interfere with the
uptake or utilization of a vitamin or as a result
of poor food choices or a lack of variety in the
diet. For example, peripheral neuropathy
associated with vitamin E deficiency can
occur in children with fat malabsorption, and
alcohol consumption can result in beri-beri.
Vegans, individuals who consume diets lacking all animal products, can develop deficiencies in vitamin B12.
In the hospital, it was learned that
Mr. Percy Veere had lost 32 lb in
the 8 months since his last visit to
his family physician. On admission, his
hemoglobin (the iron-containing compound
in the blood, which carries O2 from the lungs
to the tissues) was 10.7 g/dL (reference
range, males ϭ 12 Ϫ 15.5), his serum iron
was 38 g/dL (reference range, males ϭ
42 Ϫ 135), and other hematologic indices
were also abnormal. These values are
indicative of an iron deficiency anemia. His
serum folic acid level was 0.9 ng/mL (reference range ϭ 3 Ϫ 20), indicating a low intake
of this vitamin. His vitamin B12 level was 190
pg/mL (reference range ϭ 180 Ϫ 914). A low
blood vitamin B12 level can be caused by
decreased intake, absorption, or transport,
but it takes a long time to develop. His
serum albumin was 3.2 g/dL (reference
range ϭ 3.5 Ϫ 5.0), which is an indicator of
protein malnutrition or liver disease.
14
SECTION ONE / FUEL METABOLISM
Table 1.7. VITAMINS
Vitamin
a
Dietary
Reference
Intakes (DRI)
Females (F)
Males (M)
(18–30 yrs old)
Consequences
of Deficiency
(Names of deficiency
diseases are in bold)
Some Common
Food Sources
Water-soluble vitamins
Vitamin C
Thiamin
Riboflavin
Niacinb
Vitamin B6
(pyridoxine)
Folate
Vitamin B12
Biotin
Pantothenic
acid
Choline
RDA
F: 75 mg
M: 90 mg
UL: 2 g
RDA
F: 1.1 mg
M: 1.2 mg
RDA
F: 1.1 mg
M: 1.3 mg
Citrus fruits; potatoes; peppers, broccoli, spinach;
strawberries
Scurvy: defective collagen formation leading to subcutaneous hemorrhage, aching bones, joints, and muscle in
adults, rigid position and pain in infants.
Enriched cereals and breads; unrefined grains;
pork; legumes, seeds, nuts
RDA
F: 14 mg NEQ
M: 16 mg NEQ
UL: 35 mg
RDA
F: 1.3 mg
M: 1.3 mg
UL: 100 mg
RDA
F: 400 g
M: 400 g
RDA
F: 2.4 g
M: 2.4 g
AI
F: 30 g
M: 30 g
AI
F: 5 mg
M: 5 mg
AI
F: 550 mg
M: 425 mg
UL: 3.5 g
Meat: chicken, beef, fish; enriched cereals or
whole grains; most foods
Beri-beri: (wet) Edema; anorexia, weight loss; apathy,
decrease in short-term memory, confusion; irritability;
muscle weakness; an enlarged heart
Ariboflavinosis: Sore throat, hyperemia, edema of oral
mucusal membranes; cheilosis, angular stomatis; glossitis, magenta tongue; seborrheic dermatitis; normochromic normocylic anemia
Pellagra: Pigmented rash in areas exposed to sunlight;
vomiting; constipation or diarrhea; bright red tongue;
neurologic symptoms
Dairy products;
fortified cereals; meats, poultry, fish; legumes
Chicken, fish, pork; eggs; fortified cereals,
unmilled rice, oats; starchy vegetables;
noncitrus fruits; peanuts, walnuts
Seborrheic dermatitis; microcytic anemia; epileptiform
convulsions; depression and confusion
Citrus fruits; dark green vegetables; fortified cereals and breads; legumes
Impaired cell division and growth; megaloblastic anemia; neural tube defects
Animal productsc
Megaloblastic anemia Neurologic symptoms
Liver
Egg yolk
Conjunctivitis; central nervous system abnormalities;
glossitis; alopecia; dry, scaly dermatitis
Wide distribution in foods, especially animal tissues; whole grain cereals; legumes
Irritability and restlessness; fatigue, apathy, malaise;
gastiointestinal symptoms; neurological symptoms
Milk; liver; eggs; peanuts
Liver damage
Carrots; Dark green and leafy vegetables; sweet
potatoes and squash; broccoli
Night blindness; xerophthalmia; keratinization of
epithelium in GI, respiratory and genitourinary tract,
skin becomes dry and scaly
Green leafy vegetables; cabbage family (brassica); Bacterial flora of intestine
Defective blood coagulation; hemorrhagic anemia of the
newborn
Fortified milk; Exposure of skin to sunlight
Rickets (in children); inadequate bone mineralization
(osteomalacia)
Vegetable oils, margarine; wheat germ; nuts;
green leafy vegetables
Muscular dystrophy, neurologic abnormalities.
Fat-soluble vitamins
Vitamin A
Vitamin K
Vitamin D
Vitamin E
RDA
F: 700 g
M: 900 g
UL: 3000 g
RDA
F: 90 g
M: 120 g
AId
F: 5 g
M: 5 g
UL: 50 g
RDA
F: 15 mg
M: 15 mg
UL: 1 g
Dietary Reference Intakes (DRI): Recommended Dietary Allowance (RDA); Adequate Intake (AI); Tolerable Upper Intake Level (UL)
a
Information for this table is from Dietary Reference Intakes for Thiamin, Riboflavin, Niacin, Vitamin B6, Folate, Vitamin B12, Pantothenic Acid, Biotin, and Choline
(1998); Dietary Reference Intakes for Vitamin C, Vitamin E, Selenium, and Carotenoids (2000); Dietary Reference Intakes for Calcium, Phosphorus, Magnesium, Vitamin D, and Fluoride (1997), Dietary Reference Intakes for Vitamin A, Vitamin K, Arsenic, Boron, Chromium, Copper, Iodine, Iron, Manganese, Molybdenum, Nickel,
Silicon, Vanadium, and Zinc (2001). Washington, DC: Food and Nutrition Board, Institute of Medicine, National Academy Press.
b
neq ϭ niacin equivalents. Niacin can be synthesized in the human from tryptophan, and this term takes into account a conversion factor for dietary tryptophan.
c
Vitamin B12 is found only in animal products.
d
Dietary requirement assumes the absence of sunlight.
CHAPTER 1 / METABOLIC FUELS AND DIETARY COMPONENTS
15
riboflavin is 0.9 mg/day for males between 9 and 13 years of age, 1.3 mg/day for
males 19 to 30 years of age, still 1.3 mg/day for males older than 70 years, and 1.1
mg/day for females aged 19 to 30 years. The largest requirements occur during lactation (1.6 mg/day).
Vitamins, by definition, cannot be synthesized in the body, or are synthesized
from a very specific dietary precursor in insufficient amounts. For example, we
can synthesize the vitamin niacin from the essential amino acid tryptophan, but
not in sufficient quantities to meet our needs. Niacin is therefore still classified
as a vitamin.
Excessive intake of many vitamins, both fat-soluble and water-soluble, may
cause deleterious effects. For example, high doses of vitamin A, a fat-soluble vitamin, can cause desquamation of the skin and birth defects. High doses of vitamin C
cause diarrhea and gastrointestinal disturbances. One of the Reference Dietary
Intakes is the Tolerable Upper Intake Level (UL), which is the highest level of daily
nutrient intake that is likely to pose no risk of adverse effects to almost all individuals in the general population. As intake increases above the UL, the risk of adverse
effects increases. Table 1.7 includes the UL for vitamins known to pose a risk at
high levels. Intake above the UL occurs most often with dietary or pharmacologic
supplements of single vitamins, and not from foods.
E. Minerals
Many minerals are required in the diet. They are generally divided into the classifications of electrolytes (inorganic ions that are dissolved in the fluid compartments
of the body), minerals (required in relatively large quantities), trace minerals
(required in smaller quantities), and ultratrace minerals (Table 1.8).
Sodium (Naϩ), potassium (Kϩ), and chloride (Cl–) are the major electrolytes
(ions) in the body. They establish ion gradients across membranes, maintain
water balance, and neutralize positive and negative charges on proteins and other
molecules.
Calcium and phosphorus serve as structural components of bones and teeth
and are thus required in relatively large quantities. Calcium (Ca2ϩ) plays many
other roles in the body; for example, it is involved in hormone action and blood
clotting. Phosphorus is required for the formation of ATP and of phosphorylated intermediates in metabolism. Magnesium activates many enzymes and
also forms a complex with ATP. Iron is a particularly important mineral
because it functions as a component of hemoglobin (the oxygen-carrying protein in the blood) and is part of many enzymes. Other minerals, such as zinc or
molybdenum, are required in very small quantities (trace or ultra-trace
amounts).
Sulfur is ingested principally in the amino acids cysteine and methionine. It is
found in connective tissue, particularly in cartilage and skin. It has important functions in metabolism, which we will describe when we consider the action of coenzyme A, a compound used to activate carboxylic acids. Sulfur is excreted in the
urine as sulfate.
Table 1.8. Minerals Required in the Diet
Electrolytes
Sodium
Potassium
Chloride
a
Minerals
Trace Minerals
Calcium
Phosphorus
Magnesium
Iron
Sulfur
Iodine
Selenium
Copper
Zinc
These minerals are classified as trace or as ultratrace.
Ultratrace or
Trace Mineralsa
Manganese
Fluoride
Chromium
Molybdenum
Others?
A dietary deficiency of calcium can
lead to osteoporosis, a disease in
which bones are insufficiently mineralized and consequently are fragile and
easily fractured. Osteoporosis is a particularly common problem among elderly
women. Deficiency of phosphorus results in
bone loss along with weakness, anorexia,
malaise, and pain. Iron deficiencies lead to
anemia, a decrease in the concentration of
hemoglobin in the blood.
Which foods would provide Percy
Veere with good sources of folate
and vitamin B12?
16
SECTION ONE / FUEL METABOLISM
Folate is found in fruits and vegetables: citrus fruits (e.g., oranges),
green leafy vegetables (e.g.,
spinach and broccoli), fortified cereals, and
legumes (e.g., peas) (see Table 1.7). Conversely, vitamin B12 is found only in foods of
animal origin, including meats, eggs, and
milk.
Minerals, like vitamins, have adverse effects if ingested in excessive amounts.
Problems associated with dietary excesses or deficiencies of minerals are described
in subsequent chapters in conjunction with their normal metabolic functions.
F. Water
Water constitutes one half to four fifths of the weight of the human body. The intake
of water required per day depends on the balance between the amount produced by
body metabolism and the amount lost through the skin, through expired air, and in
the urine and feces.
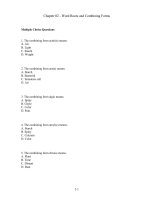
V. DIETARY GUIDELINES
Dietary guidelines or goals are recommendations for food choices that can reduce the
risk of developing chronic or degenerative diseases while maintaining an adequate
intake of nutrients. Many studies have shown an association between diet and exercise and decreased risk of certain diseases, including hypertension, atherosclerosis,
stroke, diabetes, certain types of cancer, and osteoarthritis. Thus, the American Heart
Institute and the American Cancer Institute, as well as several other groups, have
developed dietary and exercise recommendations to decrease the risk of these diseases. The “Dietary Guidelines for Americans (2000)”, prepared under the joint
authority of the US Department of Agriculture and the US Department of Health and
Human Services, merges many of these recommendations. Recommended servings
of different food groups are displayed as the food pyramid (Fig. 1.9). Issues of special concern for physicians who advise patients include the following:
A. General Recommendations
• Aim for a healthy weight and be physically active each day. For maintenance of
a healthy weight, caloric intake should balance caloric expenditure. Accumulate
at least 30 minutes of moderate physical activity (such as walking 2 miles) daily.
A regular exercise program helps in achieving and maintaining ideal weight, cardiovascular fitness, and strength.
• Choose foods in the proportions recommended in the food pyramid, including a
variety of grains and a variety of fruits and vegetables daily.
• Keep food safe to eat. For example, refrigerate leftovers promptly.
B. Vegetables, Fruits, and Grains
• Diets rich in vegetables, fruits, and grain products should be chosen. Five or
more servings of vegetables and fruits should be eaten each day, particularly
green and yellow vegetables and citrus fruits. Six or more daily servings of
grains should be eaten (starches and other complex carbohydrates, in the form of
breads, fortified cereals, rice, and pasta). In addition to energy, vegetables, fruits,
and grains supply vitamins, minerals, protective substances (such as
carotenoids), and fiber. Fiber, the indigestible part of plant food, has various beneficial effects, including relief of constipation.
• The consumption of refined sugar in foods and beverages should be reduced to
below the American norm. Refined sugar has no nutritional value other than its
caloric content, and it promotes tooth decay.
C. Fats
• Fat intake should be reduced. For those at risk of heart attacks or strokes, fat should
account for no more than 30% of total dietary calories, and saturated fatty acids
CHAPTER 1 / METABOLIC FUELS AND DIETARY COMPONENTS
17
Food Guide Pyramid
A Guide to Daily Food choices
KEY
Fats, Oils, & Sweets
USE SPARINGLY
Milk, Yogurt
& Cheese
Group
Fat (naturally occurring
Sugars
and added)
(added)
These symbols show that fat and added
sugars come mostly from fats, oils, and
sweets, but can be part of or added to
foods from the other food groups as well.
Meat, Poultry, Fish,
Dry Beans,Eggs
& Nuts Group
2-3 SERVINGS
Vegetable
Group
2-3 SERVINGS
Fruit
Group
3-5 SERVINGS
2-4 SERVINGS
Bread, Cereal,
Rice & Pasta
Group
6-11
SERVINGS
SOURCE: U.S. Department of Agriculture/U.S. Department of Health and Human Services
Fig. 1.9. The Food Guide Pyramid. The pyramid shows the number of servings that should
be eaten each day from each food group. Within each group, a variety of foods should be
eaten. Some examples of serving size: Grain products—1 slice of white bread or 1⁄2 cup of
cooked rice; Vegetable group—1⁄2 cup cooked vegetables; Fruit group—1 apple or banana;
Milk Group—1 cup of milk or 2 oz processed cheese; Meat and Beans Group—2–3 oz
cooked lean meat or fish or 1 egg or 2 tbsp peanut butter. Nutrition and Your Health: Dietary
Guidelines for Americans, 2000. Washington, DC: Dietary Guidelines Committee: The U.S.
Department of Agriculture and the U.S. Department of Health and Human Services.
should account for 10% or less. Foods high in saturated fat include cheese, whole
milk, butter, regular ice cream, and many cuts of beef. Trans fatty acids, such as
the partially hydrogenated vegetable oils used in margarine, should also be
avoided.
• Cholesterol intake should be less than 300 mg/day in subjects without atherosclerotic
disease and less than 200 mg/day in those with established atherosclerosis.
D. Proteins
• Protein intake for adults should be approximately 0.8 g/kg ideal body weight per
day. The protein should be of high quality and should be obtained from sources
low in saturated fat (e.g., fish, lean poultry, and dry beans). Vegetarians should
eat a mixture of vegetable proteins that ensures the intake of adequate amounts
of the essential amino acids.
Cholesterol is obtained from the
diet and synthesized in most cells
of the body. It is a component of
cell membranes and the precursor of steroid
hormones and of the bile salts used for fat
absorption. High concentrations of cholesterol in the blood, particularly the cholesterol in lipoprotein particles called low density lipoproteins (LDL), contribute to the
formation of atherosclerotic plaques. These
plaques (fatty deposits on arterial walls) are
associated with heart attacks and strokes. A
high content of saturated fat in the diet tends
to increase circulatory levels of LDL cholesterol and contributes to the development of
atherosclerosis.
E. Alcohol
• Alcohol consumption should not exceed moderate drinking. Moderation is
defined as no more than one drink per day for women and no more than two
drinks per day for men. A drink is defined as 1 regular beer, 5 ounces of wine
(a little over 1⁄2 cup), or 1.5 ounces of an 80-proof liquor, such as whiskey. Pregnant women should drink no alcohol.
The ingestion of alcohol by pregnant women can result in fetal
alcohol syndrome (FAS), which is
marked by prenatal and postnatal growth
deficiency, developmental delay, and craniofacial, limb, and cardiovascular defects.
18
SECTION ONE / FUEL METABOLISM
F. Vitamins and Minerals
The high intake of sodium and
chloride (in table salt) of the average American diet appears to be
related to the development of hypertension
(high blood pressure) in individuals who are
genetically predisposed to this disorder.
• Sodium intake should be decreased in most individuals. Sodium is usually consumed as salt, NaCl. Individuals prone to salt-sensitive hypertension should eat
less than 3 g sodium per day (approximately 6 g NaCl).
• Many of the required vitamins and minerals can be obtained from eating a
variety of fruits, vegetables, and grains (particularly whole grains). However,
calcium and iron are required in relatively high amounts. Low-fat or nonfat
dairy products and dark green leafy vegetables provide good sources of calcium. Lean meats, shellfish, poultry, dark meat, cooked dry beans, and some
leafy green vegetables provide good sources of iron. Vitamin B12 is found only
in animal sources.
• Dietary supplementation in excess of the recommended amounts (for example,
megavitamin regimens) should be avoided.
• Fluoride should be present in the diet, at least during the years of tooth formation, as a protection against dental caries.
VI. XENOBIOTICS
In addition to nutrients, our diet also contains a large number of chemicals called
xenobiotics, which have no nutritional value, are of no use in the body, and can be
harmful if consumed in excessive amounts. These compounds occur naturally in
foods, can enter the food chain as contaminants, or can be deliberately introduced
as food additives.
Dietary guidelines of the American Cancer Society and the American Institute
for Cancer Research make recommendations relevant to the ingestion of xenobiotic
compounds, particularly carcinogens. The dietary advice that we eat a variety of
food helps to protect us against the ingestion of a toxic level of any one xenobiotic
compound. It is also suggested that we reduce consumption of salt-cured, smoked,
and charred foods, which contain chemicals that can contribute to the development
of cancer. Other guidelines encourage the ingestion of fruits and vegetables that
contain protective chemicals called antioxidants.
CLINICAL COMMENTS
Physicians have an average lifespan that is longer than the general
population, and generally practice
healthier behaviors, especially with regard
to fat consumption, exercise, alcohol consumption, and smoking. Physicians who
practice healthy behaviors are more likely to
counsel patients with respect to these
behaviors and are better able to motivate
their patients.
Otto Shape. Otto Shape sought help in reducing his weight of 187 lb
(BMI of 27) to his previous level of 154 lb (BMI of 22, in the middle of
the healthy range). Otto Shape was 5 feet 10 inches tall, and he calculated
that his maximum healthy weight was 173 lbs. He planned on becoming a family
physician, and he knew that he would be better able to counsel patients in healthy
behaviors involving diet and exercise if he practiced them himself. With this information and assurances from the physician that he was otherwise in good health,
Otto embarked on a weight loss program. One of his strategies involved recording
all the food he ate and the portions. To analyze his diet for calories, saturated fat,
and nutrients, he used the Interactive Healthy Eating Index, available online from
the USDA Food and Nutrition Information Center.
Ivan Applebod. Ivan Applebod weighed 264 lb and was 70 inches tall
with a heavy skeletal frame. For a male of these proportions, a BMI of 18.5
to 24.9 would correspond to a weight between 129 and 173 lb. He is currently almost 100 lb overweight, and his BMI of 37.9 is in the obese range.
Mr. Applebod’s physician cautioned him that exogenous obesity (caused by
overeating) represents a risk factor for atherosclerotic vascular disease, particularly
when the distribution of fat is primarily “central” or in the abdominal region (apple
CHAPTER 1 / METABOLIC FUELS AND DIETARY COMPONENTS
shape, in contrast to the pear shape, which results from adipose tissue deposited in the
buttocks and hips). In addition, obesity may lead to other cardiovascular risk factors
such as hypertension (high blood pressure), hyperlipidemia (high blood lipid levels),
and type 2 diabetes mellitus (characterized by hyperglycemia). He already has a mild
elevation in both systolic and diastolic blood pressure. Furthermore, his total serum
cholesterol level was 296 mg/dL, well above the desired normal value (200 mg/dL).
Mr. Applebod was referred to the hospital’s weight reduction center, where a
team of physicians, dieticians, and psychologists could assist him in reaching his
ideal weight range.
Ann O’Rexia. Because of her history and physical examination, Ann
O’Rexia was diagnosed as having early anorexia nervosa, a behavioral disorder that involves both emotional and nutritional disturbances. Miss
O’Rexia was referred to a psychiatrist with special interest in anorexia nervosa, and
a program of psychotherapy and behavior modification was initiated.
19
The prevalence of obesity in the
U.S. population is increasing. In
1962, 12.8% of the population had
a BMI equal to or greater than 30 and therefore were clinically obese. That number
increased to 14.5% by 1980 and to 22.5% by
1998. An additional 30% were pre-obese in
1998 (BMI ϭ 25.0 Ϫ 29.9). Therefore, more
than 50% of the population is currently overweight, that is, obese or pre-obese.
Increased weight increases cardiovascular risk factors, including hypertension, diabetes, and alterations in blood lipid levels. It
also increases the risk for respiratory problems, gallbladder disease, and certain types
of cancer.
Percy Veere. Percy Veere weighed 125 lb and was 71 inches tall (without shoes) with a medium frame. His BMI was 17.5, which is significantly
underweight. At the time his wife died, he weighed 147 lbs. For his height,
a BMI in the healthy weight range corresponds to weights between 132 and 178 lb.
Mr. Veere’s malnourished state was reflected in his admission laboratory profile.
The results of hematologic studies were consistent with an iron deficiency anemia
complicated by low levels of folic acid and vitamin B12, two vitamins that can affect
the development of normal red blood cells. His low serum albumin level was caused
by insufficient protein intake and a shortage of essential amino acids, which result
in a reduced ability to synthesize body proteins. The psychiatrist requested a consultation with a hospital dietician to evaluate the extent of Mr. Veere’s marasmus
(malnutrition caused by a deficiency of both protein and total calories) as well as
his vitamin and mineral deficiencies.
BIOCHEMICAL COMMENTS
Dietary Reference Intakes. Dietary Reference Intakes (DRIs) are
quantitative estimates of nutrient intakes that can be used in evaluating and
planning diets for healthy people. They are prepared by the Standing Committee on the Scientific Evaluation of Dietary Reference Intakes (DRI) of the Food
and Nutrition Board, Institute of Medicine, and the National Academy of Science,
with active input of Health Canada. The four reference intake values are the Recommended Dietary Allowance (RDA), the Estimated Average Requirement (EAR), the
Adequate Intake (AI), and the Tolerable Upper Intake Level (UL). For each vitamin,
the Committee has reviewed available literature on studies with humans and established criteria for adequate intake, such as prevention of certain deficiency symptoms,
prevention of developmental abnormalities, or decreased risk of chronic degenerative
disease. The criteria are not always the same for each life stage group. A requirement
is defined as the lowest continuing intake level of a nutrient able to satisfy these criteria. The EAR is the daily intake value that is estimated to meet the requirement in
half of the apparently healthy individuals in a life stage or gender group. The RDA is
the EAR plus 2 standard deviations of the mean, which is the amount that should satisfy the requirement in 97 to 98% of the population. The AI level instead of an RDA
is set for nutrients when there is not enough data to determine the EAR.
The Tolerable Upper Intake Level (UL) refers to the highest level of daily nutrient intake consumed over time that is likely to pose no risks of adverse effects for
almost all healthy individuals in the general population. Adverse effects are defined
as any significant alteration in the structure or function of the human organism. The
An example of the difference
between the AI and the EAR is provided by riboflavin. Very few data
exist on the nutrient requirements of very
young infants. However, human milk is the
sole recommended food for the first 4 to 6
months, so the AI of the vitamin riboflavin for
this life stage group is based on the amount
in breast milk consumed by healthy full-term
infants. Conversely, the riboflavin EAR for
adults is based on a number of studies in
humans relating dietary intake of riboflavin
to biochemical markers of riboflavin status
and development of clinical deficiency symptoms.
20
SECTION ONE / FUEL METABOLISM
UL does not mean that most individuals who consume more than the UL will suffer
adverse health effects, but that the risk of adverse effects increases as intake
increases above the UL.
Suggested References
A good, comprehensive textbook on nutrition is Shils ME, Olson JA, Shike M, Ross, AC. Modern nutrition in health and disease. Baltimore: Williams & Wilkins, 1999. Extensive nutrition tables, including Metropolitan Height and Weight Tables, are available in the appendices.
Recent Dietary References Intakes prepared by the Food and Nutrition Board of the National Academy
of Science (1997–2001) are available in several volumes published by the National Academy Press
(see Table 1.7) and may be consulted online at />To analyze diets for calories and nutrient contents, consult food databases and resource lists made
available by the USDA. The site www.nal.usda.gov/fnic provides lists of resources on food composition, such as the database U.S. Department of Agriculture, Agricultural Research Service.
2001. USDA Nutrient Database for Standard Reference, Release 14. Nutrient Data Laboratory
Homepage, This site also provides lists of resources for
diet analysis, and links to the Interactive Healthy Eating Index, which is a program students can
use to analyze their diets (http://147.208.9.133). A useful computer program for evaluating the diet
of individuals, the MSU Nutriguide, can be obtained from Department of Nutrition, Michigan
State University.
Dietary recommendations change frequently as new data become available. Current Dietary Recommendations are available from the following sources: Food and Nutrition Information Center, National Agricultural Library, USDA (www.fns.usda.gov); National Heart, Lung, and Blood Institute Information
Center (www.nhlbi.nih.gov); American Heart Association (www.Americanheart.org); American Institute
for Cancer Research (www.aicr.org); and the American Diabetes Association (www.diabetes.org).
Another reliable source for nutrition information on the internet is www.navigator.tufts.edu.
A number of medical schools in the United States have received Nutrition Academic Awards from the
National Institute of Heart, Blood and Lung, National Institutes of Health (www.nhlbi.nih.gov/
funding/naa). These schools are developing products for medical nutrition education.
REVIEW QUESTIONS—CHAPTER 1
Directions: For each question below, select the single best answer.
1.
In the process of respiration, fuels
(A)
(B)
(C)
(D)
(E)
2.
The caloric content per gram of fuel
(A)
(B)
(C)
(D)
(E)
3.
are stored as triacylglycerols.
are oxidized to generate ATP.
release energy principally as heat.
combine with CO2 and H2O.
combine with other dietary components in anabolic pathways.
is higher for carbohydrates than triacylglycerols.
is higher for protein than for fat.
is proportionate to the amount of oxygen in a fuel.
is the amount of energy that can be obtained from oxidation of the fuel.
is higher for children than adults.
The resting metabolic rate is
(A)
(B)
(C)
(D)
(E)
equivalent to the caloric requirement of our major organs and resting muscle.
generally higher per kilogram body weight in women than in men.
generally lower per kilogram body weight in children than adults.
decreased in a cold environment.
approximately equivalent to the daily energy expenditure.
CHAPTER 1 / METABOLIC FUELS AND DIETARY COMPONENTS
4.
The RDA is
(A)
(B)
(C)
(D)
(E)
5.
21
the average amount of a nutrient required each day to maintain normal function in 50% of the U.S. population.
the average amount of a nutrient ingested daily by 50% of the U.S. population.
the minimum amount of a nutrient ingested daily that prevents deficiency symptoms.
a reasonable dietary goal for the intake of a nutrient by a healthy individual.
based principally on data obtained with laboratory animals.
A 35-year old sedentary male patient weighing 120 kg was experiencing angina (chest pain) and other signs of coronary artery
disease. His physician, in consultation with a registered dietician, conducted a 3-day dietary recall. The patient consumed an
average of 585 g carbohydrate, 150 g protein, and 95 g fat each day. In addition, he drank 45 g alcohol. The patient
(A)
(B)
(C)
(D)
(E)
consumed between 2,500 and 3,000 kcal per day.
had a fat intake within the range recommended in current dietary guidelines (i.e., year 2000).
consumed 50% of his calories as alcohol.
was deficient in protein intake.
was in negative caloric balance.
2
Hormones are compounds that are
synthesized by the endocrine
glands of the body. They are
secreted into the bloodstream and carry
messages to different tissues concerning
changes in the overall physiologic state of
the body or the needs of tissues.
Glucose
Oxidation
Energy
Storage
Glycogen
TAG
Synthesis
Many compounds
Amino acids
Protein
synthesis
The Fed or Absorptive State
The Fed State. During a meal, we ingest carbohydrates, lipids, and proteins,
which are subsequently digested and absorbed. Some of this food is oxidized to
meet the immediate energy needs of the body. The amount consumed in excess of
the body’s energy needs is transported to the fuel depots, where it is stored. During the period from the start of absorption until absorption is completed, we are
in the fed, or absorptive, state. Whether a fuel is oxidized or stored in the fed state
is determined principally by the concentration of two endocrine hormones in the
blood, insulin and glucagon.
Fate of Carbohydrates. Dietary carbohydrates are digested to monosaccharides, which are absorbed into the blood. The major monosaccharide in the blood
is glucose (Fig 2.1). After a meal, glucose is oxidized by various tissues for
energy, enters biosynthetic pathways, and is stored as glycogen, mainly in liver
and muscle. Glucose is the major biosynthetic precursor in the body, and the carbon skeletons of most of the compounds we synthesize can be synthesized from
glucose. Glucose is also converted to triacylglycerols. The liver packages triacylglycerols, made from glucose or from fatty acids obtained from the blood, into
very low-density lipoproteins (VLDL) and releases them into the blood. The fatty
acids of the VLDL are mainly stored as triacylglycerols in adipose tissue, but
some may be used to meet the energy needs of cells.
Fate of Proteins. Dietary proteins are digested to amino acids, which are
absorbed into the blood. In cells, the amino acids are converted to proteins or
used to make various nitrogen-containing compounds such as neurotransmitters
and heme. The carbon skeleton may also be oxidized for energy directly, or converted to glucose.
Fate of Fats. Triacylglycerols are the major lipids in the diet. They are digested
to fatty acids and 2-monoacylglycerols, which are resynthesized into triacylglycerols in intestinal epithelial cells, packaged in chylomicrons, and secreted by way
of the lymph into the blood. The fatty acids of the chylomicron triacylglycerols
are stored mainly as triacylglycerols in adipose cells. They are subsequently oxidized for energy or used in biosynthetic pathways, such as synthesis of membrane
lipids.
Synthesis of
nitrogen-containing
compounds
Oxidation
Energy
Fats
THE
Storage
TAG
Oxidation
Energy
Synthesis
Membrane lipids
Fig. 2.1. Major fates of fuels in the fed state.
22
WAITING
ROOM
Ivan Applebod returned to his doctor for a second visit. His initial
efforts to lose weight had failed dismally. In fact, he now weighed 270
lb, an increase of 6 lb since his first visit 2 months ago (see Chapter 1).
He reported that the recent death of his 45-year-old brother of a heart attack had
made him realize that he must pay more attention to his health. Because
CHAPTER 2 / THE FED OR ABSORPTIVE STATE
The body can make fatty acids
from a caloric excess of carbohydrate and protein. These fatty
acids, together with the fatty acids of chylomicrons (derived from dietary fat), are
deposited in adipose tissue as triacylglycerols. Thus, Ivan Applebod’s increased adipose tissue is coming from his intake of all
fuels in excess of his caloric need.
Mr. Applebod’s brother had a history of hypercholesterolemia and because Mr.
Applebod’s serum total cholesterol had been significantly elevated (296 mg/dL)
at his first visit, his blood lipid profile was determined, his blood glucose level
was measured, and a number of other blood tests were ordered. (The blood lipid
profile is a test that measures the content of the various triacylglycerol- and cholesterol-containing particles in the blood.) His blood pressure was 162 mm Hg
systolic and 98 mm Hg diastolic or 162/98 mm Hg (normal ϭ 140/90 mm Hg or
less). His waist circumference was 48 inches (healthy values for men, less than
40; for women, less than 35).
I.
23
DIGESTION AND ABSORPTION
After a meal is consumed, foods are digested (broken down into simpler components) by a series of enzymes in the mouth, stomach, and small intestine. The products of digestion eventually are absorbed into the blood. The period during which
digestion and absorption occur constitutes the fed state (Fig. 2.2)
Glucose
Blood
4
Intestine
Glucose
Glucagon
1
CHO
Liver
Insulin
Acetyl CoA
Acetyl CoA
+
2
Fat
(TG)
8
Glycogen
5 I
Glucose
I 6
+
+
TCA
Chylomicrons
[ATP]
Brain
I
TG
TCA
7
CO2
[ATP]
CO2
3
Protein
AA
VLDL
RBC
12
Pyruvate
FA + Glycerol
Lactate
9
14
10
Glucose
Tissues
AA
+
Protein
Important
compounds
TCA
[ATP]
CO2
Muscle
I
+
+
I
Acetyl CoA
I
11
13
TG
+
I
CO2
TCA
[ATP]
Adipose
Glycogen
Fig. 2.2. The fed state. The circled numbers indicate the approximate order in which the processes occur. TG ϭ triacylglycerols; FA ϭ fatty
acid; AA ϭ amino acid; RBC ϭ red blood cell; VLDL ϭ very-low-density lipoprotein; I ϭ insulin; ᮍ ϭ stimulated by.