Comparison of water quality and production performance of barramundi (lates calcarifer) fingerlings in two systems
Bạn đang xem bản rút gọn của tài liệu. Xem và tải ngay bản đầy đủ của tài liệu tại đây (1001.21 KB, 52 trang )
MINISTRY OF EDUCATION AND TRAINING
NHA TRANG UNIVERSITY
VO THI LUU
COMPARISON OF WATER QUALITY AND PRODUCTION
PERFORMANCE OF BARRAMUNDI (Lates calcarifer)
FINGERLINGS IN TWO SYSTEMS: A RECIRCULATION
SYSTEM AND A FLOW-THROUGH SYSTEM
MASTER THESIS
KHANH HOA - 2018
MINISTRY OF EDUCATION AND TRAINING
NHA TRANG UNIVERSITY
VO THI LUU
COMPARISON OF WATER QUALITY AND PRODUCTION
PERFORMANCE OF BARRAMUNDI (Lates calcarifer)
FINGERLINGS IN TWO SYSTEMS: A RECIRCULATION
SYSTEM AND A FLOW-THROUGH SYSTEM
MASTER THESIS
Major:
Marine Ecosystem Management
and Climate Change
Topic allocation Decision
1011/QD-DHNT dated
16/10/2017
Decision on establishing the
Committee:
06th June 2018
Defense date:
Suppervisors:
LE ANH TUAN
Chairman:
Faculty of Graduate Studies:
KHANH HOA - 2018
UNDERTAKING
I undertake that the thesis entitled: “Comparison of water quality and
performance of Barramundi (Lates calcarifer) fingerlings in two systems: a
recirculation systems and a flow-through system” is my own work. The work has not
been presented elsewhere for assessment until the time this thesis is submitted.
NhaTrang, 02nd May 2018
i
ACKNOWLEDGMENT
I would like to express the deepest appreciation to the Faculty of Graduate
Studies, Nha Trang University (NTU) for the helping and giving best conditions me
finish my thesis.
My special thanks go to Dr. Le Anh Tuan for the continuous support of my
study, for his patience, motivation, enthusiasm, and immense knowledge. My gratitude
is always there with all the Lecturers and the coordinators of the Norhed Master’s
Programme.
I sincerely would like to thank the collaboration of the Australis Aquaculture
Vietnam Ltd. Company (Ninh Hoa, Khanh Hoa, Vietnam) where the recirculating
system was constructed and all the data collections were carried out. I am grateful with
Mr. Daniel Fisk, the Managing Director of AAV and all of the colleagues from nursery
farm, RAS team and laboratory for their supports.
Last but not the least, to thank my family and my friends for always concern
and encourage me during the past time.
Thank you!
NhaTrang, 02nd May 2018
ii
TABLE OF CONTENTS
UNDERTAKING ........................................................................................................................ i
ACKNOWLEDGMENT ............................................................................................................ ii
TABLE OF CONTENTS ..........................................................................................................iii
LIST OF SYMBOLS .................................................................................................................. v
LIST OF ABBREVIATIONS ................................................................................................... vi
LIST OF TABLES...................................................................................................... vii
LIST OF FIGURES ................................................................................................... viii
ABSTRACT ............................................................................................................................... 1
Chapter 1: INTRODUCTION .................................................................................................... 2
Chapter 2: LITERATURE REVIEW ......................................................................................... 5
2.1. Recirculation aquaculture system ........................................................................................ 5
2.2. Barramundi, distribution and production ............................................................................ 8
2.3. Nursery phase .................................................................................................................... 11
Chapter 3: MATERIALS AND METHOD .............................................................................. 12
3.1. Study site ........................................................................................................................... 12
3.2. Production setup ................................................................................................................ 14
3.3. Water quality...................................................................................................................... 14
3.4. Barramundi production parameters ................................................................................... 17
3.5. Statistical analysis.............................................................................................................. 19
Chapter 4: RESULTS AND DISCUSSION ............................................................................. 20
4.1. Water quality ..................................................................................................................... 20
4.1.1 Water quality in the RAS ................................................................................................ 20
4.1.2. Comparison of water quality between the RAS and the FTS ......................................... 21
4.1.3. Discussion....................................................................................................................... 22
4.2. Barramundi production performance................................................................................. 25
4.2.1. Comparison of barramundi production parameters between the FTS and the RAS ...... 25
4.2.2. Discussion....................................................................................................................... 29
4.3. Preliminary assessment of comparative economics .......................................................... 30
4.3.1. Comparison of economic parameters between the RAS and the FTS ............................ 30
iii
4.3.2. Discussion....................................................................................................................... 32
Chapter 5: CONCLUSION AND RECOMMENDATION ..................................................... 34
5.1. Conclusion ......................................................................................................................... 34
5.2. Recommendation ............................................................................................................... 34
REFERENCES ......................................................................................................................... 35
APPENDICES
iv
LIST OF SYMBOLS
B
: Biomass
Bf
: The final biomass
Bi
: The initial biomass
F
: Feed consumption
m1
: The pre weight
m2
: The post weight
P
: Population
Pf:
: The final population
Pi
: The stocking population.
t
: Time
W
: Weight of fish
Wf
: The
final weight
Wi
: The
initial weight
v
LIST OF ABBREVIATIONS
AAV
: Australis Aquaculture Vietnam
AGR
: Absolute growth rate
CO2
: Carbon dioxide
DFI
: Daily feed intake
DO
: Dissolved oxygen
FAO
: Food and Agriculture Organization
FCR
: Feed conversion ratio
FRP
: Fiberglass reinforced plastic
FTS
: Flow-through system
NH3
: ammonia
NH4
: ammonium
NO2
: nitrite
NO3
: nitrate
RAS
: Recirculation aquaculture system
SR
: Survival rate
SGR
: Specific growth rate
TSS
: Total suspended solids
UV
: Ultraviolet
vi
LIST OF TABLES
Table 3.1: Environmental parameters .......................................................................... 15
Table 4.1: Mean values for environmental parameters in RAS (mg.L-) (N = 12) ........ 20
Table 4.2: Compare mean values of environmental parameters between the RAS and
the FTS (NS, no significant difference; *, significant difference, P < 0.05) 22
Table 4.3: The stocking data of barramundi fingerlings in the FTS and in the RAS................ 25
Table 4.4: The mean values for barramundi production performance in the FTS and in
the RAS ....................................................................................................... 27
Table 4.5: Summary of all parameters monitored from October 2014 to September
2015 with FTS and from October 2015 to September 2016 with RAS at the
AAV facility ................................................................................................ 31
vii
LIST OF FIGURES
Figure 2.1: Schematic diagram of a basic RAS ............................................................. 5
Figure 2.2: A RAS compared with a traditional FTS ..................................................... 6
Figure 2.3: Distribution map for Lates calcarifer .......................................................... 8
Figure 2.4: Main producer countries of Lates calcarifer ............................................... 9
Figure 2.5: Global aquaculture production for Lates calcarifer ................................... 10
Figure 3.1: Small tanks in AAV nursery ...................................................................... 12
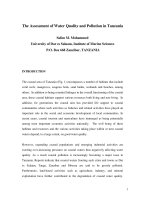
Figure 3.2: A schematic design of the basic components of AAV nursery ................... 13
Figure 3.3: Oxygen meters in AAV nursery ................................................................. 16
Figure 4.1: The mean values for pH, DO (mg.L-) and CO2 (mg.L-) in the RAS .......... 21
Figure 4.2: Population and fish weight of nursery period in the FTS and in the RAS ...... 26
Figure 4.3: Survival rate in the FTS and in the RAS during nursery phase ................. 27
Figure 4.4: Feeding rate and growth rate in the FTS and in the RAS of nursery period ...... 28
Figure 4.5: Feed conversion ratio in the FTS and in the RAS of nursery phase .......... 29
viii
Comparison of water quality and production performance of Barramundi
(Lates calcarifer) fingerlings in two systems: a recirculation system and a
flow-through system.
ABSTRACT
The comparison of water quality and barramundi (Lates calcarifer) production
performance were conducted using the recirculation system and the flow-through
system of Australis Aquaculture Vietnam (AAV) as an adaption option in the context
of climate change. The goals were; (1) to evaluate and compare the important
environmental parameters of the RAS versus the FTS for the commercial nursery
farm, (2) to compare the survival, feeding rate, growth rate and FCR of barramundi
production between RAS and FTS in the nursery phase, (3) preliminary assessment of
economic budget between two systems. All information in this study and production
scale were based on the technology design and production parameters existing at the
AAV facility.
pH and dissolved oxygen concentrations were lower in the RAS (7.2 ± 0.13, 5.8
± 0.41) compared to in the FTS (8.2 ± 0.13, 6.3 ± 0.58). The mean values of nitrite and
nitrate were higher in the RAS (1.3 ± 0.36 mg.L-, 49.6 ± 8.68 mg.L-) compared to in
the FTS (0.4 ± 0.16 mg.L-, 25 ± 7.92 mg.L-), but the ranges of these levels in both
systems were safe for aquaculture production. Water temperature and ammonia
concentrations were not significantly different between the RAS and the FTS. In
contrast to the high density of Vibrio bacteria (160 ± 72 CFU.mL-) and total bacteria
(432 ± 283 CFU.mL-) in water input of the FTS, no pathologies were detected in RAS
water.
Performance of barramundi fingerling production included survival rate,
feeding rate, growth rate and FCR respectively were higher in the RAS (93.8%, 4.1%,
6.49% and 1.04) compared to in the FTS (79%, 3.5%, 5.84% and 0.99). Combined
with the requirements of environmental parameters, the results confirmed that the RAS
can produce more fish with high survival and less water consumption.
1
Chapter 1: INTRODUCTION
Aquaculture production is playing an important role in food demand for human
life. Fish is also an important source of animal protein, providing livelihood
opportunities and food security for millions of people. Aquaculture accounts for 50
percent of the world’s food fish and can potentially be increased to 62 percent of fish
for human consumption by 2030 (FAO, 2014). As the demand for aquaculture
products increases, producers must expand current fish farms based on existing land
and water resources by adopting new technology to enable higher rearing densities
(Clark, 2003).
Flow-through systems (FTS) can be used in intensive farming if there is an
abundant and easy to harness supply of clean water (Bijo, 2007). In a traditional flowthrough system, water simply passes through tank culture of fish only once before it is
discharged back to environment. The flowing water transports oxygen to the fish and
removes wastes out of the system (Bijo, 2007). However, this requires a large volume
of water resources and both water quantity necessary for fish production and amount
of pollutants out environment are very high. Thus, the FTS do not satisfy requirements
of future trends in the environmental protection and especially water resources
preservation (Lang et al., 2012).
Recirculation aquaculture system (RAS) is one of the new methods used to
increase aquaculture production after more than 30 years of research and development
(Timmon et al., 2007). In fish farms, a RAS includes the fish tanks, an adapted water
treatment system and pumps to maintain water flow. The water treatment system is the
center of the RAS that makes the system distinct from traditional FTS (Lekang, OddIvar, 2013). With RAS, the outlet water from the fish tanks goes through the water
treatment system, which includes physical, chemical and biological process to filter,
clean and improve water quality before turning back through fish culture tanks, thus
the amount of added new water can be reduced.
In the context of climate change, worldwide aquaculture production is
threatened to the sustainability (De Silva & Soto, 2009). The negative effects of
climate change on aquaculture natural resources such as land, water, seeds, feeds and
2
energy have directly impact on the productivity and profitability levels of this sector
(Oguntuga, Adesina & Akinwole, 2009). However, they are different among regions,
aquaculture practice systems, time, size and changeability (De Silva & Soto, 2009).
Some studies in Southeast Asian countries included the poverty, marginalization and
lack of alternative incomes that make fishery communities unable to cope with the
impact of climate change in Cambodia (Baran, Schwartz & Kura, 2009), the disease
and virus outbreaks led to decrease the profits of aquaculture activities in Thailand
(Flaherty, Vandergeest& Miller, 1999), the performance of aquaculture production
under the environmental pressure of climate change in Malaysia (Hamdan et al.,
2015). In Vietnam, the storm surges, sea level rise, high waves and strong winds had
caused severe damages and losses to aquaculture production (Kelly & Adger, 1999),
the frequent flood events had caused loose to a huge number of fish and shrimps
production in Red River Delta, Central Region and Mekong Delta (Asian
Development Bank [ADB], 2009).
Due to the remarkable contribution of aquaculture production towards
economic growth, the concerns about environmental externalities and consequences
related to sustainability of aquaculture activities have been increasing during recent
years (Tisdell & Leung, 1999). Fluctuation of climate events such as changing water
temperature and annual precipitation, the shift of raining and dry seasons all changes
the physiological, ecological and operational aspects of aquaculture activities
(Handisyde et al., 2006). Especially, changes in temperature and precipitation may
lead to a rise in the occurrence of some kinds of virus, bacteria and parasites in water
sources (Siwar, Alam, Murad and Al-Amin, 2009; Handisyde et al., 2006). It is hard to
predict and identify the causes of disease outbreaks and increasing mortality risks in
relation to aquaculture production.
In order to minimize the impacts from external environmental factors as well as
from fish farms to the environment, applying recirculation aquaculture technology
could be considered for a greater commercial scale providing for the development of
aquaculture production, profitability and environmental sustainability (Timmons et al.,
2007). The study “Comparison of water quality and production performance of
barramundi (Lates calcarifer) fingerlings in two systems: a recirculation system
and a flow-through system” was conducted as a pioneer model of application new
3
technology in barramundi fish farming in Viet Nam, especially in the context of
climate change.
The study focuses on barramundi fingerlings in the nursery phase. This stage plays a
decisive role for the final output because small fish are easy to be infected with disease
and get high mortality. The system was analyzed for a nursery with a single-batch,
reaching a desired 30 g fish size in 40 – 50 days before harvested. Survival data of fish
and water quality parameters were collected and monitored as indicators of the system
performance.
Specific objectives are to:
1) Evaluate the important environmental parameters of the recirculation system
for commercial fish farm in nursery phase, compared with the flow-through system in
the same facilities;
2) Compare the efficiency of barramundi production between the RAS and the
FTS in the nursery phase;
3) Preliminary assessment of investment costs for two systems: RAS and FTS.
4
Chapter 2: LITERATURE REVIEW
2.1. Recirculation aquaculture system
RAS is closed culture systems with less water change or zero-discharge,
intensive, usually indoor tank-based systems that achieve high rates of water re-use by
mechanical, biological chemical filtration and other treatment steps. Normally, the
mechanical stage removes the solid waste, the biological filtration removes the
dissolved wastes and converts the ammonia to nitrate, and sterilization subsequently
reduces the bacterial and pathogen concentration in the entire system (Figure 2.1).
Figure 2.1: Schematic diagram of a basic RAS
More recently, the addition of a denitrification stage has shown potential in
increasing the volume of water recycled and decreasing waste outputs (Steicke et al.,
2009). In fact, most recirculation technologies are being applied in aquaculture today
need a replacement of 10 – 20% of water used per day (Timmons and Ebeling, 2012).
Dissolved oxygen (DO), carbon dioxide, ammonia, nitrite, nitrate are the critical water
quality variables in RAS that may affect fish health as well as result of production
(Colt et al., 2006). With recirculation technology, an operator can secure greater
control over the environmental parameters and water quality, give less stress and better
growth, thus enabling optimal conditions for fish culture (Heinen et al., 1996; Badiola
et al., 2012; Carrera et al., 2013). Basically, RAS has a unit for growing fish, a
mechanical filter to remove larger particles before bio-filtration, an aerobic biological
5
nitrification area to remove potentially toxic nitrogenous compounds and sometimes
an anaerobic denitrification filter (Barbu et al., 2008).
RAS can be considered as an opportunity to reduce water consumption and
effluent emission by a factor of 100 in comparison to traditional FTS (Blancheton,
2000) and allow concomitant control of rearing water quality. In RAS, the make-up
water needs, about 1 m3 per kg of feed, are 100 times lower than in FTS (Mac Millan,
1992; Blancheton et al., 2007). Besides, RAS can reduce potential environmental
impacts by increasing feed conversion (Fredricks, K.T., 2015). The lower waterexchange rate in RAS also allows for controlling temperature, which creates the best
conditions for year-round production (Gutierrez-Wing and Malone, 2006; Lyssenko
and Wheaton, 2006) and reduces energy costs whilst maintaining a particular
temperature (Summerfelt et al., 2001; Avnimelech, 2006; Gutierrez-Wing and Malone,
2006). RAS also allows for better bio-security and independence in location of
production facilities (Summerfelt et al., 2001; Cancino-Madariaga et al., 2011).
Finally, RAS allows for higher output and a higher density of fish per unit of
production tanks (Lyssenko and Wheaton, 2006; Good et al.,2009; Gullian-Klanian
and Arámburu-Adame, 2013).
Figure 2.2: A RAS compared with a traditional FTS
(Source: Lekang, Odd-Ivar, 2013)
6
Due to the possibility to maintain a constant water quality, RAS may also
contribute to improve growth performance, feed conversion ratio (FCR) and survival
rate of aquatic animals. RAS production has increased significantly in volume and
species diversity since the late of 80’s (Rosenthal, 1980; Verreth and Eding, 1993;
Martins et al., 2005). Today, more than 10 species are produced in RAS facilities
(African catfish, tilapia, eel and trout as major freshwater species and salmon, rainbow
trout, turbot, sea-bass and sole as major marine species) (Martins et al., 2010).
Despite the many advantages of using recirculation technology in fish farming,
the operation of RAS requires a mechanically sophisticated and biologically complex
system (Duning et al. 1998). To control this system, managers and farmers have good
knowledge of the design of the system, specification of the technical components and
operation of it. Although RAS technology is considered to have environmentally
friendly characteristics and demonstrates an increasing number of applications in
European countries, its contribution to production is still small compared to sea cages,
ponds or FTS (Martins et al., 2010). Besides, the high initial capital investment does in
part lead to slow adoption of RAS technology (Schneider et al., 2006). High stocking
densities and production are required to be able to cover investment costs.
Literatures on RAS are still limited and mostly focuses on technical issues or
stocking densities at experimental scales. Some authors have reported about water
quality assessment and fish performance in recirculation systems for some species
productions, such as Arctic charr Salvelinus alpines L. in Iceland (Molleda, 2007),
Rainbow trout Oncorhynchusmykiss and European sea bass Dicentrarchuslabrax in
France (Blancheton et al., 2009), Nile Tilapia Oreochromisniloticus in Mexico
(Gullian-Klanian and Arámburu-Adame, 2013), Salmonid in Czech Republic (Buric et
al., 2014). The evaluation of water quality and performance of Barramundi (Lates
calcarifer) in RAS has not been studied to a significant level yet, particularly at the
commercial fish farming. A combination of environmental parameters such as DO
(Wajsbrot et al., 1991; Foss et al., 2003), salinity (Alabaster et al., 1979; Sampaio et
al., 2002), CO2 (Randall and Wright, 1989), nitrite (Lemarié et al., 2004) and
ammonia may cause fish health problems. Classical production parameters, such as
growth and survival rates (Jørgensen et al., 1993; Canario et al., 1998; Papoutsoglou et
al., 1998; Irwin et al., 1999; Sørum and Damsgård, 2004) can be used to assess fish
7
performance. Research conducted at a Barramundi farming documenting potential
benefits of applying RAS can help producers get more relevant information to select
the appropriate system with production scale and specific culture species.
2.2. Barramundi, distribution and production
Barramundi is the accepted common name used in Australia, but the fish is also
known under others names in different countries, but often more generally as Asian
sea-bass or Lates calcarifer (Bloch, 1790) in the literatures. Barramundi is a
euryhaline member of the family Centropomidae (Katayama, 1956; Grey, D. L. 1987,
Tucker et al., 2002), can be grown in salinities ranging from fresh to sea water (0 – 36
‰). Available information shows that juvenile barramundi tends to grow faster in
lower salinities. The optimum temperature for growth of this species is between 280C
and 320C. According to Meynecke et al., 2013, higher temperatures can enhance
primary production and increase growth rates as well as fish activity. The species is
widely distributed in the Indo-West Pacific region from the Arabian Gulf to China,
Taiwan, Papua New Guinea and northern Australia (Figure 2.3).
Figure 2.3: Distribution map for Lates calcarifer
(Source: www.aquamaps.org, 2013)
8
Aquaculture of this species commenced in the early 1970s in Thailand and
rapidly expanded to China, India, Indonesia, Malaysia, the Philippines, Singapore,
Taiwan, Vietnam and Australia. More recently countries such as the United States of
America, the Netherlands, the United Kingdom and Israel have also developed
barramundi farming (Glenn Schipp et al., 2007). The popularity and demand for
barramundi made it a potential candidate for aquaculture. It also has some
characteristics like tender, mild tasting, boneless fillets and rich omega-3 fatty acids
that endear it to the consumers.
Figure 2.4: Main producer countries of Lates calcarifer
(Source: FAO, 2006)
According to FAO Fishery statistics, annual barramundi production has been
quite stable since 1998, around 20 – 27 thousand tons, then, continuously increased in
subsequent years, particularly from 2008 onwards. The highest yield was achieved
over 77 thousand tons in 2012. Thailand is the largest producer with about 8 thousand
tons per year from 2001. Indonesia, Malaysia and Taiwan are also the substantial
producers. There has been a significant increase of international production of
barramundi in the last few years, mainly from Vietnam, Thailand and China. Because
of the differences in the consumption demand of barramundi in these countries,
various levels of production and culture technologies also exist (Ayson et al., 2013).
9
Barramundi is also successfully cultured in commercial farms in all Australian
mainland states and the Northern Territory (Harrison et al., 2013). Producers have
used land based ponds and raceways, open ocean sea cages, and recirculation
aquaculture systems in their farms. Recently years, the innovation and technological
advances have fuelled the growth of the Australian farmed barramundi industry, as
according to Harrison et al., 2013 wrote “industry production statistics in Australia do
not account for the commercial value of seed stock supply, but advancements in this
area certainly underpin the growth that this industry has enjoyed recently and is likely
to further fuel growth in the future”. Highly intensive shore-based grow out
aquaculture systems combined with a year-round supply of hatchery produced fish is
currently practiced in a number of Australian states (Meynecke et al., 2013).
Figure 2.5: Global aquaculture production for Lates calcarifer
(Source: FAO, 2014)
10
2.3. Nursery phase
The nursery phase can be defined as the growth period between 20 mm and 100
- 120 mm in length, it is also one of the most important steps for seed propagation in
the grow-out phase (Maneewong, S. et al., 1981). This is also considered the most
difficult phase of barramundi culture because cannibalism is usually more intense
during this period than during later stages of culture (Parazo et al., 1991). Barramundi
are weaned from a live food diet onto formulated feeds and grown in tanks to reach
100 mm total length (Glenn Schipp et al., 2007). In order to avoid high mortalities and
maintain high production at this stage, many factors must be considered, including
water quality, type of feeds and feeding schedule, stocking densities, grading and
diseases.
Today, most nurseries around the world use an intensive nursery system where
the fish are kept at high densities, fed formulated feed and graded regularly to control
cannibalism and improve growth rates (Glenn Schipp et al., 2007). The nursing period
lasts about 40 – 50 days until fish reach 100 mm of total length or about 30 g of body
weight. After this stage, fish can be stronger and are moved to acclimation system with
sea water before transferred to grow-out sea cages.
11
Chapter 3: MATERIALS AND METHOD
3.1. Study site
The study was conducted at Australis Aquaculture Viet Nam Ltd (AAV),
facilities which are located in Ninh Hai commune, Ninh Hoa town, Khanh Hoa
province. AAV has developed Barramundi fish farming at an industrial scale since
2007. They have hatched and reared Barramundi fingerling in land-based tanks and
complete the grow-out process in modern sea cages. Annual yield reached two
thousand tons (2014).
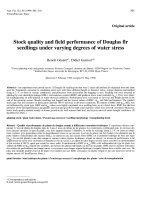
The nursery was designed around the need to regularly grade the fish to control
cannibalism with 12 small circular indoor tanks with a volume of 8 m3, flow rate of
150L.minutes- and 2 big circular tanks with a volume of 50 m3, flow rate of 300
L.minutes-. All tanks are made of fiberglass reinforced plastic (FRP).
Figure 3.1: Small tanks in AAV nursery
The data on FTS in the nursery phase was gathered from October 2014 to
September 2015. Water was continuously pumped (Ebara, Italia) from the sea through
the baffle filter (38 m x 2.4 m x 1.8 m) to the drum filter (Ohex, Denmark) and came
the culture tanks. The circular tanks were set up with new sea water flowing through at
an exchange rate of 100 – 200 percent per hour for small tanks and 50 – 70 percent per
12
hour respectively for big tanks. Water temperature depended on environmental
conditions and salinity oscillated around 30 – 34‰.
From October 2015 to September 2016, RAS has replaced the FTS in the same
facility. Instead of directly pumping water from the sea, water was continuously
recirculated from the rearing tanks through the up-weller and the drum filter, next to
the biological filter, degassing box and then went through to UV light before back to
the rearing tanks (Figure 2.2). The total water volume of the system is 196 m3 and 20 –
30% of the system water is exchanged with new water to dilute the high level of
ammonia and nitrites. The salinity was 15‰, be reused throughout the system and
water temperature was maintained above 280C using a heat pump.
Figure 3.2: A schematic design of the basic components of AAV nursery
13
Liquid oxygen was used to increase stocking densities and efficiency of
operation in both FTS and RAS. These high stocking densities could be achieved using
high water exchange in the FTS and oxygenation delivered to the tanks via bio-weave
diffusers. The same commercial pellet containing 55% crude protein and 5000 kcal.kg(Ocialis, INVIVO NSA – France) was used until the fish reached 30 g of body weight
(BW). After that, fish were moved to acclimation system for few days before
transferring to sea cage. Actual data on the FTS and the RAS at this facility and some
other data on commercial scale barramundi for this thesis work were collected under
the guidance of Mr. Daniel Mark Fisk – Managing Director of AAV.
3.2. Production setup
The general protocols for all stocking fingerlings include checking fish health
before moving to nursery farm and the results were free with pathogens (virus, bacteria
and parasites). At the FTS, 300,000 barramundi fingerlings (2.0 ± 0.15 g) were stocked
at 8 kg.m-3 in small tanks, fed 4 times a day for 48 days. In the meanwhile, 400,000
barramundi fingerlingsof the same size were stocked at 20 kg.m-3 in small tanks, fed 3
times a day during 40 – 50 days in the RAS. The maximum stocking densities in FTS
and RAS was 40 kg.m-3 and 66 kg.m-3, respectively. With these facilities, the FTS and
the RAS could produce approximately 1.8 million and more than 2.5 million
fingerlings a year, respectively.
All fish in the FTS and the RAS were injected with Irrido V and Strep Si vaccines at
10 g of average weight. The same chemical treatment and handling protocols were
applied in both systems. The various production parameters include survival rate,
feeding rate, growth rate which were recorded and managed every day till the fish are
ready for transfer to sea cages for grow-out farm.
3.3. Water quality
Concentrations of dissolved oxygen (DO), temperature, un-ionized ammonianitrogen, nitrite-nitrogen and carbon dioxide in the water of the culture system are the
critical environmental parameters. Besides nitrate concentration, pH and alkalinity
levels within the system are also important factors. If aquaculture systems are
maintained good water quality during periods of fish growth, fish production can get
high effective.
14
Table 3.1: Environmental parameters
Parameters
Measuring method/Tool
In RAS
In FTS
DO
Oxyguard/ In-situ probes
6 times a day
6 times a day
Temperature
Oxyguard/ In-situ probes
6 times a day
6 times a day
pH
pH meter
At 8.00 am, 4.00 pm
At 8.00 am, 4.00 pm
NH4+
Sera Test
At 8.00 am, 4.00 pm
At 8.00 am, 4.00 pm
NO2-
Sera Test
At 8.00 am, 4.00 pm
At 8.00 am, 4.00 pm
NO3-
Sera Test
At 8.00 am, 4.00 pm
At 8.00 am, 4.00 pm
CO2
Oxyguard CO2 portable analyser
At 8.00 am, 4.00 pm
N/A
Alkalinity
Sera Test
At 8.00 am, 4.00 pm
N/A
Hardness
Sera Test
At 8.00 am, 4.00 pm
N/A
208D
At 8.00 am
N/A
At 8.00 am
At 8.00 am
At 8.00 am
At 8.00 am
TSS
Total bacteria Cultured on TSA media
Vibrio
Cultured on TCBS media
In both the FTS and the RAS, water temperature and DO were monitored at least six
times a day after feeding in each tank using Oxyguard® probes and In-situ probes
connected to an Apple Ipod or a computerized measuring system (Linde soft) (Figure
3.3).
15