Minimization of reworks in the apparel industry
Bạn đang xem bản rút gọn của tài liệu. Xem và tải ngay bản đầy đủ của tài liệu tại đây (1.28 MB, 18 trang )
January 2013. Vol. 1, No.4
ISSN 2305-8269
International Journal of Engineering and Applied Sciences
© 2012 EAAS & ARF. All rights reserved
www.eaas-journal.org
MINIMIZATION OF REWORKS IN QUALITY AND PRODUCTIVITY
IMPROVEMENT IN THE APPAREL INDUSTRY
1
Md. Mazedul Islam
Adnan Maroof Khan
2
Md.Mashiur Rahman Khan
1
Department of Textile Engineering, Daffodil International University, Bangladesh 1
Department of Apparel Manufacturing Engineering, Bangladesh University of textiles.
; ;
Abstract
The fast changing economic conditions such as global competition, declining profit margin, customer demand for
high quality product, product variety and reduced lead–time etc. had a major impact on manufacturing industries.
The demand for higher value at lower price is increasing and to survive, apparel manufacturers need to improve
their operations through-Producing right first time quality and waste reduction. This paper discusses the quality
and productivity improvement in a manufacturing enterprise through practical study. The paper deals with an
application of methodology in an industry which provides a framework to identify quantify and eliminate sources of
variation in an operational process, to optimize the operation variables, improve and sustain process performance
with well-executed control plans. The application of this paper improves the process performance of the critical
operational process, leading to better utilization of resources, decreases variations & maintains consistent quality
of the process output. The outcome of this observation reflected that an industry may gain higher productivity and
profitability with improved quality product by minimizing reworks activities. It also minimizes cost and improves
internal throughput time. A general overview over this development is given in this paper.
Keywords— Costs, Operation, Productivity, Profitability, product Quality, Reworks.
I. Introduction
As the global economic condition changing in a rapid
motion, generally in an industry more focus is given
on profit margin, customer demand for high quality
product and improved productivity. In garment
manufacturing, it is usual few rejected garments after
shipment. Reason, most of the manufacturers believe
that garments are soft goods and non-repairable
defect may occur due to low quality raw materials or
faulty process or employee casual behavior.
However, factory must have check points to control
over this issue. There is no ready-made solution that
can reduce rejection percentage overnight. Each order
is unique. But this paper works suggest how to
handle this issue and bring down rejection rate to
minimum. We see a lot of rejected garment after
shipment. Most of the organization termed these
garments as rejected because those garments can’t be
repaired by any means. Reworks in the garments
industry is a common works that hampers the smooth
production rate and focus poor quality products
having an impact on overall factory economy.
Minimization of reworks is a must in quality and
productivity improvement. Rework is a vital issue for
poor quality product and low production rate.
Reworks are the non -productive activities focusing
on any activity that customer are not willing to pay
for. Non-productive activities describe that the
customer does not consider as adding value to his
product. By reacting quicker in minimization of
reworks to make a product as per customer demand
with expected quality, the company can invest less
money and more costs savings. Therefore, a study
was carried out in the garment industry named Opex
& Sinha Textile Group located at Mirpur, Dhaka,
147
January 2013. Vol. 1, No.4
ISSN 2305-8269
International Journal of Engineering and Applied Sciences
© 2012 EAAS & ARF. All rights reserved
www.eaas-journal.org
Bangladesh at cutting, sewing and finishing section
to identify reworks so as to eliminate them for saving
time,
2. Problem Definition and Methodology
6.
In the Apparel Manufacturing Industry, main raw
material is fabric; others are different types of
trimming and accessories. Operational wastages in
the Apparel manufacturing process are- top surface
rework, printed label rework, sewing fault rework,
pinhole rework, fabric rework Improper fly shape,
and other reworks. The general methodology
followed to minimize reworks is given below.
7.
8.
9.
1.
Review of the existing quality system in the
company
2. Identification of defects in the various
departments by collecting data from old
records
3. Analysis of data collected in order to
identify majorly occurring defects
4. Categorization of defects
5. Development of a model Quality Inspection
System
2.1. Review of factory existing Quality System
10.
11.
12.
13.
Fig. 1 Review of Existing Quality System
148
cost
and
improved
product
quality.
Implementation of check sheets to capture
defects in different departments
Training on concepts of quality, importance
of maintaining correct data, usage of the
collected data to analyze and solve quality
issues through the tools of quality
Introduction of Inline Inspection on Sewing
floor through a pilot run in one line
Training on the Sewing floor to QC’s,
supervisors and checkers on filling in the
format and on making Cause & Effect
Diagrams
Analysis of defects occurring in the check
sheets implemented in various departments
and devising suggestions to improve upon
them
Spreading of Inline inspection to other lines
Tracking of improvements and comparing
them with previous situation in different
departments
Visual communication of performance.
January 2013. Vol. 1, No.4
ISSN 2305-8269
International Journal of Engineering and Applied Sciences
© 2012 EAAS & ARF. All rights reserved
www.eaas-journal.org
2.1. Identification of Defects
The reports of quality inspections in various departments were studied for the period of January – April- 2012.
2.1.1 Cutting Department:
Percentage of lots
3%
21%
PASS
FAIL
HOLD
76%
Fig. 2 Lots percentages overview of cutting departments
2.1.2 Sewing Department
6.00
Defect categories wise D.H.U.
5.06
5.00
4.00
3.00
3.36
3.12
2.70 2.63
2.00
2.00
1.57
1.30 1.19
1.13 1.11 1.02 0.94
0.68
1.00
0.49 0.36 0.34
0.23 0.19 0.10 0.09
0.00
OPEN SEAMS
UNEVEN MARGIN
UNEVEN NECK/PLACKET/W.BAND
EXPOSED RAW STITCH
FULLNESS
UNEVEN GATHER
BROKEN STITCH
SHADE VARIATION
ZIPPER PLACEMENT
JOINT OUT
BALANCING OUT
PUCKERING
ROPING
WRONG LABEL ATTACH/LABEL MISSING
FABRIC DEFECTS
LOOSE TENSION
WRONG PANEL ATTACH
HOOK /LACE/ BUTTON PLACEMENT
Fig. 3 Defect categories wise D.H.U in the sewing department
149
January 2013. Vol. 1, No.4
ISSN 2305-8269
International Journal of Engineering and Applied Sciences
© 2012 EAAS & ARF. All rights reserved
www.eaas-journal.org
2.1.3 Categorizations of Defects
Sewing Defects: These defects are usually caused by
errors arising from wrong functioning of sewing
machines.
Seaming defects: These defects are usually caused by
errors arising from the interaction of the operator and
machine in the handling of garment.
Placement Defects: These defects are usually caused
by errors arising in marking and cutting as well as
sewing operations in the sewing room or a
combination of these
Fabric defects: These defects are usually caused by
errors arising from the fabric processing like knitting
and dyeing.
Embroidery defects: These defects are usually caused
by errors arising from the embroidery processing of
the garments.
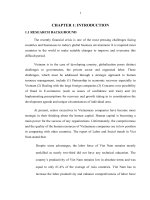
2.1.4 Sewing Department Defects categories wise
Defect categories wise D.H.U. (Defects per Hundread Unit)
Total pieces inspected- 30030
Defects encountered-11778
25.00
20.73
D.H.U.- 39.22
20.00
D.H.U.
14.00
Where,
15.00
Seaming defects- 6224
10.00
5.00
Sewing defects- 4204
3.37
1.02
Placement defects-1012
0.10
0.00
Defect Categories
Fabric defects-307
Embroidery defects-31
SEAMING DEFECTS
SEWING DEFECTS
PLACEMENT DEFECTS
FABRIC DEFECTS
EMBROIDERY DEFECTS
Fig. 4 Defect categories wise D.H.U in the sewing department
150
January 2013. Vol. 1, No.4
ISSN 2305-8269
International Journal of Engineering and Applied Sciences
© 2012 EAAS & ARF. All rights reserved
www.eaas-journal.org
2.2 Stages of Model Development
Identification of
various options at the
check points to capture
defects
Selection of various
tools to be used the
model
Developments of
model
2.3 Development of Model
Inline
Inspection
through Defect
Frequency
Rating System
Defect
capturing at the
End Line
through check
sheets
Analysis of
defects
Cause & Effect
Analysis of
highest
occurring
Defects
Effective
Solutions
Provided
2.4 Formats introduced in various departments.
1. Cutting audit format 2. Cutting pattern check
format. 3. Sewing in-line inspection format
4. Sewing end-line inspection format 5. Sewing cause
& effect analysis format. 6. Finishing initial
inspection format
151
January 2013. Vol. 1, No.4
ISSN 2305-8269
International Journal of Engineering and Applied Sciences
© 2012 EAAS & ARF. All rights reserved
www.eaas-journal.org
4
9
2
5
2
5
4
2
3
35
1
4
3
1
1
11
20
4
2
2
5
3
4
1
5
3
2
9
9
7
4
3
3
2
2
3
2
1
3
3
3
1
3
2
2
2
2
72
3
2
14
2
27
1
30
5
2
3
2
55
70
Total Checked
Pieces
Others
Measurement out
Label Attachment
Uneven Raw
Margin
Exposed Raw stitch
56
4
9
10
13
2
56
8
42
11
77
4
42
8
78
6
67
8
75
3
70
15 139
5
97
5
55
4
116
7
203
9
151
11 139
12 207
12 135
3
87
2
70
1
94
134 2000
Table.1 Defect categories wise and percentage defectives in the sewing department
152
Percentage
Defective
2
6
10
1
3
1
Uneven Top Stitch
Uneven fly shape
Puckering
Roping
Broken stitch
4
6
Total Defective
Pieces
1-Mar
3-Mar
4-Mar
5-Mar
6-Mar
7-Mar
8-Mar
10-Mar 1
11-Mar
12-Mar
13-Mar
14-Mar
15-Mar
17-Mar
18-Mar
19-Mar
20-Mar
21-Mar
24-Mar
25-Mar
TOTAL 1
Slip stitch
Thread Tension
DATE
3.0 Experimental Sewing Data
56
22
22
5
12
16
17
10
23
17
11
12
18
14
17
29
14
8
8
8
339
100
52
29
12
15
24
23
14
17
18
20
10
9
9
12
14
10
9
11
9
17
January 2013. Vol. 1, No.4
ISSN 2305-8269
International Journal of Engineering and Applied Sciences
© 2012 EAAS & ARF. All rights reserved
www.eaas-journal.org
4.0 Cause & Effect diagram for major occurring defects and their implemented solutions
4.1 Measurement out of tolerance
Improper sweep shape
after panel attachment
Notches not proper
Solutions Provided
Cause
Notches improper at pleats
Improper sweep
panel attachment
shape
after
Solution
Cutting Department was informed about the cause and the reason
identified was misalignment of plies during cutting. This being a
major defect causing activity was asked to be checked 100% in the
audit before sending the bundles to sewing. A template was provided
against which the pieces were checked and in case of any deviation,
white pencil was used to mark pleat positions.
Bottom trimming was done to make the sweep uniform.
153
January 2013. Vol. 1, No.4
ISSN 2305-8269
International Journal of Engineering and Applied Sciences
© 2012 EAAS & ARF. All rights reserved
www.eaas-journal.org
4.2 Puckering at waistband
Improper pre-setting of
waistband
Causes
Solution
Improper pre- setting of waistband after thumb
pressing
Pressing was done by steam iron with a spray of starch over it.
This made the handling of the waistband easier while stitching and
thus reduced puckering at the waistband.
154
January 2013. Vol. 1, No.4
ISSN 2305-8269
International Journal of Engineering and Applied Sciences
© 2012 EAAS & ARF. All rights reserved
www.eaas-journal.org
4.3 Roping
4.4 Waistband extension uneven
Causes
Improper folder setting on machine
Solution
The folder guide was adjusted and improper materials
handling avoided
155
January 2013. Vol. 1, No.4
ISSN 2305-8269
International Journal of Engineering and Applied Sciences
© 2012 EAAS & ARF. All rights reserved
www.eaas-journal.org
Causes
Margin not followed while attaching waistband and
waistband edge not finished properly
Solution
The operator was instructed to be careful while feeding
and following the margins strictly
4.5 Improper fly shape
Causes
Top stitch is being inhibited by zipper lock underneath
Solution
A template was provided to the operator and the stitch
was shifted a little below, altering the fly shape within
tolerance level
156
January 2013. Vol. 1, No.4
ISSN 2305-8269
International Journal of Engineering and Applied Sciences
© 2012 EAAS & ARF. All rights reserved
www.eaas-journal.org
4.6 Fusing shining marks
Causes
Poor quality fusing used
Solution
Fusing was changed and skilled operator required
5.0 Trend chart showing reduction in defect levels after implemented solutions
D.H.U. levels in Measurement Out
60
40
20
0
1-Mar
2-Mar
3-Mar
Fig. 5 Defects level Reduction in Measurements Out
157
4-Mar
January 2013. Vol. 1, No.4
ISSN 2305-8269
International Journal of Engineering and Applied Sciences
© 2012 EAAS & ARF. All rights reserved
www.eaas-journal.org
D.H.U. levels in Puckering
25
20
15
10
5
0
Fig. 6 Defects levels Reduction in Puckering
D.H.U. levels in Roping
Fig. 7 Defects levels Reduction in Roping
D.H.U. levels in Uneven fly shape
40
30
20
10
0
3-Mar
4-Mar
5-Mar
158
6-Mar
19-Mar
18-Mar
17-Mar
16-Mar
15-Mar
14-Mar
13-Mar
12-Mar
11-Mar
10-Mar
9-Mar
8-Mar
7-Mar
6-Mar
14
12
10
8
6
4
2
0
January 2013. Vol. 1, No.4
ISSN 2305-8269
International Journal of Engineering and Applied Sciences
© 2012 EAAS & ARF. All rights reserved
www.eaas-journal.org
Fig. 8 Defects levels Reduction in Uneven Fly Shape
Defects levels in Label Attachment
16
14
12
10
8
6
4
2
0
Fig. 9 Defects levels Reduction in Label Attachment
Defects levels in Uneven Top Stitch
25
20
15
10
5
0
3-Mar
4-Mar
5-Mar
6-Mar
7-Mar
8-Mar
Uneven top stitch
Fig. 10 Defects levels Reduction in Uneven top Stitch
159
9-Mar
10-Mar
11-Mar
12-Mar
January 2013. Vol. 1, No.4
ISSN 2305-8269
International Journal of Engineering and Applied Sciences
© 2012 EAAS & ARF. All rights reserved
www.eaas-journal.org
6.0 Defects analysis in finishing department
239
250
206
200
150
132
106
100
50
4
3
3
0
SOIL/ DUST/ RUST
STICKER MARKS
SWEAT MARKS
VEGETABLE MARKS
OIL SPOT
INK/CHALK MARK
TOBACCO MARK
Fig. 11 Defects analysis in finishing department
6.1 Recommended Suggestions Implemented to Reduce Defects in finishing section
1.Oil spots: Application of a scrap paper under the
presser feet of sewing machines after the day’s work
so that the machines which are leaking oil can be
tracked.
2. Proper oiling level to be maintained in order to
prevent leakage of extra oil
3.Operator to take responsibility of cleaning the
machine after lubrication
4. Immediate reporting of oil leakage
Ink/ chalk marks: Usage of good quality markers, the
marks of which are easily washable 2.Avoid using
pencils for marking. 3. Usage of chalks on white and
light colored fabrics.
Soil and dust: 1.Usage of plastic bags for storing and
transportation of pieces. 2. Cleaning of checking
tables and machines before the start of day’s work 3.
Avoid keeping garments on the floor, using trolleys
for storage. 4. Creating a polyethene sheet partition
between sewing and finishing departments so that
fabric dust doesn’t come over to the finishing unit
and settle down on the washed fabric.
Suggestions implemented to reduce no. of uncut &
loose thread: 1.Thread cutting operation to be carried
out after washing in order to counteract unraveling of
threads after washing 2. Use of thread sucking
machine to prevent any loose threads to reach the
checkpoint
160
January 2013. Vol. 1, No.4
ISSN 2305-8269
International Journal of Engineering and Applied Sciences
© 2012 EAAS & ARF. All rights reserved
www.eaas-journal.org
7.0 Department wise results and discussion (Sewing, Finishing and Cutting department)
7.1 Cutting Department
11/04/08
04/04/08
28/03/08
21/03/08
14/03/08
07/03/08
29/02/08
22/02/08
15/02/08
08/02/08
01/02/08
45
40
35
30
25
20
15
10
5
0
Fig. 12 Overall reductions in defect levels for cutting department
7.2 Sewing Department
Overall Percent defective trend
120
100
80
60
40
20
1-Mar
2-Mar
3-Mar
4-Mar
5-Mar
6-Mar
7-Mar
8-Mar
9-Mar
10-Mar
11-Mar
12-Mar
13-Mar
14-Mar
15-Mar
16-Mar
17-Mar
18-Mar
19-Mar
20-Mar
21-Mar
22-Mar
23-Mar
24-Mar
25-Mar
0
Percentage defective
Fig. 13 Overall reductions in defect levels for sewing department
161
January 2013. Vol. 1, No.4
ISSN 2305-8269
International Journal of Engineering and Applied Sciences
© 2012 EAAS & ARF. All rights reserved
www.eaas-journal.org
7.4 Finishing Department
March
Others
Touching
Mending
Cut & Hole
Wrong/Missing Label
Embroidery/Beads/Printing
February
Hard Stains
Insecure stitch
Uncut/ Loose thread
Stitching
Shade Variation
Fabric Fault
20
18
16
14
12
10
8
6
4
2
0
April 1- 15
Fig. 14 Overall reductions in defect levels for finishing department
Cutting lot failure rate reduced to zero percent
generally. Sewing percent defective reduced to
approximately 40%. In finishing, stitching D.H.U.
came down to approximately 8% from 16% as
earlier, uncut thread D.H.U. came down to
approximately 10% from 22% as earlier. Rework
increased the cost of the different work categories
between 2% to 30%. However, some best practices to
control defect generation within the factory were
suggested as- Make the workplace clean – from
fabric store to cutting to sewing to washing and
finishing. Place quality control system in proper
place. Implies that sufficient no. of checkers, trained
checkers, checkers making report while checking,
analysis of reports and take action based on the
quality check reports. Conduct training program for
the checkers on how to check piece correctly to
capture defective pieces. Train them to make garment
checking reports. Run quality awareness program for
your employees. Quality standard must be understood
by each employee and everybody have to work to
meet quality goal. No low standard work should be
accepted by the following department. In sewing line
don’t allow operators to keep bundles open and each
bundle must be completed before forwarding to the
next. It will help you track missing pieces. It is usual
experience that operators throw pieces under tables
when they make mistake or receive defective
(incomplete) garments from previous operator.
Nobody keeps track of these missing pieces until you
found shortage of garments in finishing. Set standard
operating procedures (SOP) for each task performed
by your employees. SOP for quality control system
for each department. Set audit team to audit your
quality system in a regular interval. These
162
January 2013. Vol. 1, No.4
ISSN 2305-8269
International Journal of Engineering and Applied Sciences
© 2012 EAAS & ARF. All rights reserved
www.eaas-journal.org
recommendations were suggested to the individual
department.
8. Conclusion
The suggestive tools developed in this article cover a
comprehensive series of aspects in minimizing
reworks in the sewing section of apparel industries by
ensuring quality production. The importance of the
textile industry in the economy of Bangladesh is very
high. The explosive growth of the RMG industry in
the country, however, has not been enough supported
by the growth of backward linkage facilities. So
manufacturing the quality product is mandatory to
sustain in this global competitive market. Quality is
ultimately a question of customer satisfaction. Good
Quality increases the value of a product or service,
establishes brand name, and builds up good
reputation for the garment exporter, which in turn
results into consumer satisfaction, high sales and
foreign exchange for the country. The perceived
quality of a garment is the result of a number of
aspects, which together help achieve the desired level
of satisfaction for the customer. However, we should
bear in mind that 1% defective product for an
organization is 100% defective for the customer who
buys that defective product. The study clearly
indicates that by eliminating non-productive activities
like reworks in the apparel industries time as well as
cost are saved by ensuring quality production which
have an important impact on overall factory
economy.
References
[12] Florida, R. “Lean and Green The Move to
Environmentally
Conscious
Manufacturing.”
California Management Review 39, (1996) 80-105
[13]Environmental Technology Best Practice
Programmed. (1996). saving money through waste
minimization raw material use, GG25, Crown
Copyright.
[14]M.Mahajan, “Statistical Quality Control”,
Dhanpat Rai & Co. (P) LTD. pp.186-206,
[1] Dr P Khanna: Work study, time and motion study,
Dhanpat Rai and Sons, New Delhi, (pp 21-31).
[2] F.M. Gryna, J.A. DeFeo, “Quality Planning &
Analysis for Enterprise Quality”, Tata McGrawHill, Edition, 2008
[3] (Opex Group) (n.d.). Retrieved december 2012,
from viyellatex group: http//www.opexgroup.com
[4] (viyellatex group)(n.d.). Retrieved december
2012,
from
viyellatex
group:
http//www.viyellatexgroup.com
[5] http//www.asiantextilejournal.com
[6] (Sepal Group)(n.d.). Retrieved december 2012.
From sepal group http//www.sepalgroup.com
[7] (n.d.). Retrieved nov 2012, from fiber 2 fashion:
http//www.fiber2fashion.com
[8]Saroj Bala, Factors Influencing
Costing of
Woven Fabrics, The Indian Textile Journal, 2003
[9]Dean J W and Bowen D E., 1994, Management
Theory and Total Quality: Improving Research
and Practice and Theory Development, the Academy
of Management Review 19, (3) PP 392-418.
[10]O.H. Khan, “A Study of Six Sigma
Implementation and Critical Success Factor”,
Pakistan’s Ninth International Convention on Quality
Improvement, Karachi, Pakistan, pp. 1-12, Nov. 2005
[11]Hawken, Paul, Amory Lovins, and L. Hunter
Lovins. Natural Capitalism: Creating the
Next
Industrial Revolution (New York Little, Brown and
Company, 1999)
Authors Biographies:
Md. Mazedul Islam
The author is associated as Lecturer in
the Department of Textile Engineering
at Daffodil International University,
Dhaka, Bangladesh. His research
interest fields are- Apparel production
and
Merchandising,
Production
Management. Industrial Engineering,
Apparel and fabric finishing, Textile
and Apparel Quality control, Apparel
Brand management, Apparel Washing
etc.
Adnan Maroof Khan
The author is associated as Lecturer in
the Department of Textile Engineering
at Daffodil International University,
163
January 2013. Vol. 1, No.4
ISSN 2305-8269
International Journal of Engineering and Applied Sciences
© 2012 EAAS & ARF. All rights reserved
www.eaas-journal.org
Dhaka, Bangladesh. His research
interest
fields’
areGarments
Technology, Production Management,
Garments
Quality
Control
&
Management, Textile Coloration &
Fabric Structure and design, etc.
Md. Mashiur Rahman Khan
Assistant Professor & Head,
Department of Apparel Manufacturing
Engineering, Bangladesh University
of textiles.
164