Berichte der Geologischen Bundesanstalt Vol 87-gesamt
Bạn đang xem bản rút gọn của tài liệu. Xem và tải ngay bản đầy đủ của tài liệu tại đây (8.58 MB, 217 trang )
©Geol. Bundesanstalt, Wien; download unter www.geologie.ac.at
21st Biennial Conference
-
European Current Research on Fluid Inclusions
ECROFI XXI
Abstracts
9-11 August 2011
Montanuniversitaet Leoben
Austria
Berichte der Geologischen Bundesanstalt
Nr. 87
©Geol. Bundesanstalt, Wien; download unter www.geologie.ac.at
©Geol. Bundesanstalt, Wien; download unter www.geologie.ac.at
21st Biennial Conference
-
European Current Research on Fluid Inclusions
9 - 11 August 2011
Leoben
Austria
ECROFI XXI
Abstracts
Edited by:
Ronald J. Bakker
Miriam Baumgartner
Gerald Doppler
© Geologische Bundesanstalt
Berichte der Geologischen Bundesanstalt Nr. 87
ISSN 1017-8880
©Geol. Bundesanstalt, Wien; download unter www.geologie.ac.at
BIBLIOGRAPHIC REFERENCE
Bakker RJ, Baumgartner M, Doppler G, 2011. ECROFI XXI Abstracts,
9 - 11 August 2011, Leoben, Austria Berichte der Geologischen Bundesanstalt, 87, 213 p., Wien
ISSN 1017-8880
This work is subject to copyrights. All rights are reserved.
© Geologische Bundesanstalt, Neulinggasse 38, A 1030 Wien
www.geologie.ac.at
Printed in Austria
Verlagsort: Wien
Herstellungsort: Wien
Ziel der „Berichte der Geologischen Bundesanstalt“ ist die Verbreitung wissenschaftlicher Ergebnisse.
Die „Berichte der Geologischen Bundesanstalt“ sind im Handel nicht erhältlich.
Die einzelnen Beiträge sind auf der Website der Geologischen Bundesanstalt frei verfügbar.
Druck: Offset-Schnelldruck Riegelnik, Piaristengasse 8, A 1080 Wien
Cover photo: Image of a fluid inclusion (ca. 50 µm diameter) in quartz with crossed nicols, illustrating
the birefringence character of quartz in a thick-section.
©Geol. Bundesanstalt, Wien; download unter www.geologie.ac.at
European Current Research on Fluid Inclusions (ECROFI-XXI)
Montanuniversität Leoben, Austria, 9–11 August, 2011. Abstracts, p. 1
Organizing Committee ECROFI XXI
Ronald J. Bakker
Miriam Baumgartner
Judith D. Bergthaler
Gerald Doppler
Chair of Resource Mineralogy
Department of Applied Geology and Geophysics
Montanuniversitaet Leoben
Austria
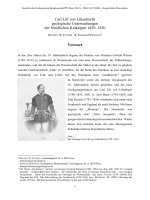
The "Fluid Inclusion Team" from Leoben. from left to right Ronald J. Bakker,
Gerald Doppler, Miriam Baumgartner, and Amir M. Azim Zadeh
1
©Geol. Bundesanstalt, Wien; download unter www.geologie.ac.at
European Current Research on Fluid Inclusions (ECROFI-XXI)
Montanuniversität Leoben, Austria, 9–11 August, 2011. Abstracts, p. 2
Preface
The ECROFI (European Current Research on Fluid Inclusions) has now reached the age of majority (21),
and is part of a family: with her little sister PACROFI, and the newly born ACROFI, which are named after
the continents where they take place, i.e. Pan-American (PA), Asian (A), and European (E). The ECROFI
meetings have been the most successful in this series, because many participants come from Europe. Up to
180 participants attended these meetings in the past. Traditionally, the ECROFI meetings are held biennially,
alternating with the PACROFI. Since 2006, the ACROFI is organized in the same year as the PACROFI
ECROFI meetings are visited by wide range of Earth-scientists investigating the role of fluids and melts
within the Earth. For ECROFI XXI (21) we have invited scientific presentations on almost anything related to
the development and application of research into fluid- and melt inclusions, including the following fields:
•
•
•
•
•
•
•
•
•
•
•
•
•
•
•
Advances in analytical techniques
Experimental studies
Theoretical studies (e.g. fluid phase relations, equations of state)
Diagenetic fluids
Petroleum fluids
Geothermal systems
Fluid flow
Deep crustal and mantle fluids
Ore deposits
Melt inclusions and igneous processes
Fluids in tectonics
Paleoclimate
Extraterrestrial fluids
Waste disposal
Novel fields
Fluid inclusion research has become a thoughtful science in the 1960's and finally became subjected to the
empirical scientific method. The experimental method was actively applied since the 1980's, but is restricted
to only a few universities. The importance of fluid inclusion research is well known within the community of
"fluid inclusionists", but lacks attention elsewhere. It is, therefore, not as successful as, for example, isotope
research. Nevertheless, approximately 300 manuscripts with fluid inclusion studies are published every year,
mainly within ore deposit research. The quality of these manuscripts must be under permanent surveillance,
using international standards for scientific work, fundamental principles of chemistry and physics, and a lot of
common sense. The ECROFI meetings are valuable for innovations, discussions and research quality
improvements within the fluid inclusion community, and, moreover, they are strong signals to "fluid inclusion
aliens" that our community is alive and kicking.
Groetjes
Ronald J. Bakker
2
©Geol. Bundesanstalt, Wien; download unter www.geologie.ac.at
European Current Research on Fluid Inclusions (ECROFI-XXI)
Montanuniversität Leoben, Austria, 9–11 August, 2011. Abstracts, p. 3
History of the ECROFI (European Current Research on Fluid Inclusions)
Chronological list of ECROFI meetings
I
13-15 September 1969 Naturhistorisches Museum, Bern (Switzerland)
II
2-3 October 1970
Universitá di Milano (Italy)
III(?)
4 December 1975
Centre National de la Recherche Scientifique (CNRS)
Paris (France)
III or IV 14-17 December 1976 University of Durham (England)
IV (?)
26-29 September 1978 Société Française de Minéralogie et de Cristallographie and
CNRS, Nancy (France)
V
February 1979
Universität Karlsruhe (Germany)
VI
22-24 April 1981
Rijks-Universiteit Utrecht (Netherlands)
VII
6-8 April 1983
Université de Orléans (France)
VIII
10-12 April 1985
Universität Göttingen (Germany)
IX
4-6 May 1987
Universidade do Porto (Portugal)
X
6-8 April 1989
Imperial College, London (England)
XI
10-12 April 1991
Universitá di Firenze (Italy)
XII
14-16 June 1993
Uniwersytet Warszawski, Warsaw (Poland)
XIII
21-23 June 1995
Institut de Ciències de la Tierra "Jaume Almera", CSIC
Barcelona-Sitges (Spain)
XIV
1-4 July 1997
Ecoles des Mines and CREGU, Nancy (France)
XV
21-24 June 1999
Geoforschungszentrum (GFZ) Potsdam (Germany)
XVI
2-4 May 2001
Universidade do Porto (Portugal)
XVII
5-7 June 2003
Eötvös University, Budapest (Hungary)
XVIII
6-9 July 2005
Università degli Studi, Siena (Italy)
XIX
17-20 July 2007
Universität Bern (Switzerland)
XX
23-25 September 2009 Universidad de Granada (Spain)
XXI
9-11 August 2011
Montanuniversität Leoben (Austria)
3
©Geol. Bundesanstalt, Wien; download unter www.geologie.ac.at
European Current Research on Fluid Inclusions (ECROFI-XXI)
Montanuniversität Leoben, Austria, 9–11 August, 2011. Abstracts, p. 4
4
©Geol. Bundesanstalt, Wien; download unter www.geologie.ac.at
European Current Research on Fluid Inclusions (ECROFI-XXI)
Montanuniversität Leoben, Austria, 9–11 August, 2011. Abstracts, p. 5
The use of quantities, units and symbols in fluid inclusion research
Bakker, Ronald J.
Resource Mineralogy, Department of Applied Geology and Geophysics, University of Leoben, Peter-Tunner
Str. 5, Leoben, Austria
Publications, manuscripts and presentations,
which include studies of fluid and melt inclusions,
reveal a wide variety of units and symbols that are
not conform with the SI (international system of
units). This may cause confusion if these studies
are communicated towards the chemical, physical,
and mathematical society. Moreover, even within
the community of fluid inclusion researchers
quantities,
symbols
and
units
may
be
misunderstood.
Recently,
Diamond
(2003)
presented a glossary with terms and quantities of
importance for fluid inclusion studies, and Kerkhof
& Thiery (2001) introduced a variety of quantities
to characterize the behaviour (i.e. a series of
phase change) of carbonic fluid inclusions during
heating in microthermometrical experiments.
These recommendations are still absent in many
publications. Several modifications have to be
applied to these considerations to make them SI
conform, which are presented in this study. The
main objective of this study is to stimulate the
awareness of fluid inclusion researchers of the
existence of an internationally accepted code to
present quantities in scientific papers.
The international system of units
(published by the Bureau International des Poids
et Mesures, 2006) is the main tool for worldwide
unification of measurements, and contains
fundamental standards and scales for the
measurements of the principal physical quantities.
nd
The IUPAC (the 'greenbook', 2 edition, 1998) has
adopted the same objectives as the BIPM to
improve the international exchange of scientific
information and describes a large variety of
coherent derived quantities from SI. The coherent
derived quantities are mainly used in fluid inclusion
research. They provide clear rules about the use of
units and symbols, and recommendations about
style in geological sciences.
1. Basic quantities
The basic quantities of the SI are given in Table 1
(see also: The international System of Units (SI).
th
Bureau International des Poids et Mesures, 8
edition, 2006). The use of the correct form of
symbols for units is obligatory, whereas symbols
for quantities are recommendations. Authors may
use a symbol of their own choice for a quantity, for
example in order to avoid a conflict arising from the
use of the same symbol for two different quantities.
In such cases, the meaning of the symbol must be
clearly stated. However, neither the name of a
quantity, nor the symbol used to denote it, should
imply any particular choice of unit.
Quantity name
length
Symbol
for
quantity
(italic)
l, x, r,
etc
m
t
I
T
Unit
name
Unit
Symbol
(upright)
metre
m
mass
kilogram
time
second
electric current
ampere
thermodynamic
Kelvin
temperature
amount of
n
mole
substance
luminous
IV
candela
intensity
Table 1. SI base quantities and units
kg
s
A
K
mol
cd
1.1 Mass
The unified atomic mass unit, symbol u or mu (also
known as dalton, symbol Da) is the atomic mass of
12
one C atom divided by 12:
12
u = ma( C)/12 ≈ 1.66053886·10
-27
kg
Subscripts, superscripts or text in brackets can be
used to illustrate further information of a specific
quantity. The subscript 'a' specifies that the mass
of atoms is expressed in this equation, and the
specific isotope is given in brackets. The use of
subscripts and superscripts in the text within
subscripts and superscripts should be omitted. The
quantity relative atomic mass has the symbol Ar
16
16
For example: Ar( O) = ma( O)/mu = 16
This quantity is also known as "atomic weight".
The word "weight" is used sometimes for
mechanical force, sometimes for mass. This
5
©Geol. Bundesanstalt, Wien; download unter www.geologie.ac.at
European Current Research on Fluid Inclusions (ECROFI-XXI)
Montanuniversität Leoben, Austria, 9–11 August, 2011. Abstracts, p. 6
ambiguity must be put to an end, therefore, the
CIPM1 (see also BIPM, 2006) declared that: 1. The
kilogram is the unit of mass; 2. The word "weight"
denotes a quantity of the same nature as a "force":
the weight of a body is the product of its mass and
the acceleration due to gravity; in particular, the
standard weight of a body is the product of its
mass and the standard acceleration due to gravity.
This is a major deficiency within geological
sciences because electron microprobe analyses as
well as salinities of aqueous fluid inclusions are
usually given in "weight fractions" (symbol wt. %).
There are no acceptable logical arguments for
ignoring the international standards, or for the
continuation of using the word "weight" when mass
is the proper name for the quantity involved.
proper name. It was simply referred to as the
"number of moles". This practice should be
abandoned, because it is wrong to confuse the
name of a physical quantity with the name of a
unit. In a similar way it would be wrong to use
"number of kilogram" as a synonym for "mass".
The length of the word "amount of substance" is
somewhat large, therefore, it can be shortened by
using only (1) "amount" or (2) "substance". When
there is no risk of confusion, it can be left out
completely.
For example:
the amount of substance of CO2 is 25 mol
the amount of CO2 is 25 mol
1.2 Thermodynamic temperature
and not:
The melting of ice occurs at 273.15 K, and 0.1
MPa. The difference between a measured
temperature and this reference value is called
Celsius temperature, symbol t. The unit of the
quantity Celsius is degree Celsius, symbol ˚C,
which is by definition equal in magnitude to the
Kelvin.
the number of moles of CO2 is 25 mol
t = T - T0
2. Derived quantities
Derived quantities have units that are products of
powers of the base units. The most common
quantities in fluid inclusion research are given in
Table 2.
t/˚C = T/K - 273.15
The basic quantity time has the same symbol, but
it is hardly ever used in fluid inclusion studies. The
subscript "C" can also be used to specify the
Celsius temperature:
TC
1.3 Amount of substance
The amount of substance is defined to be
proportional to the number of specified elementary
entities (e.g. atoms or molecules) in a sample. The
relation between the number of molecules (N,
dimensionless) and the amount of substance (n,
mole) is given by the Avogadro constant (NA unit is
-1
mol ).
n = N/NA
NA ≈ 6.02214179(30)·10
For example:
23
6
Symbol
(italic)
A
volume
V
molar volume
Vm (= V/n)
concentration
(amount
concentration)
density
(mass density)
or mass
concentration
specific
volume
c (= n/V)
force
f
ρ (= m/V)
v (= V/m)
-1
mol
n(CO2) = N(CO2)/NA
The quantity "amount of substance" or "chemical
amount" has been used for a long time without a
1
Derived
quantity
area
Comité International des Poids et Mesures
Table 2. Derived quantities
Unit
name
square
metre
cubic
metre
cubic
metre per
mole
mole per
cubic
metre
kilogram
per cubic
metre
Unit
symbol
2
m
cubic
metre per
kilogram
metre
kilogram
per
square
second
or newton
m /kg
3
m
3
-1
m mol
3
mol/m
3
kg/m
3
m kg s
N
-2
©Geol. Bundesanstalt, Wien; download unter www.geologie.ac.at
European Current Research on Fluid Inclusions (ECROFI-XXI)
Montanuniversität Leoben, Austria, 9–11 August, 2011. Abstracts, p. 7
3. Fractions, dimensionless quantities
Derived
quantity
pressure,
stress
energy,
work,
amount of
heat
Symbol
(italic)
p
G, H, A,
etc.
Unit name
kilogram
per metre
per square
second
or pascal
square
metre
kilogram
per square
second
or joule
Unit
symbol
-1 -2
kg m s
A fraction is a number that is not a whole number,
and varies between 0 and 1. Fractions can be
used in solutions (mixtures) for amount of
substance, mass, and volume (Table 3).
Quantity
mass fraction
volume fraction
amount fraction
Pa
2
= N/m
2
-2
m kg s
Symbol (italic)
w
φ, ϕ
x, y
Table 3. Fractions
The definitions of these fractions are:
J=Nm
Table 2. continued
w(i) =
2.1 Pressure
m(i)
"m j
j
Pressure is expressed in Pascal (unit name), but
can also be expressed in bar (with symbol bar),
which is a non-SI unit, and which was selected as
a
standard
pressure
for
tabulating
all
thermodynamic data. One bar is per definition 0.1
5
MPa (10 Pa). The use of Pascal is preferred.
" (i) =
!
j
x(i) =
2.2 Solubility of salt in aqueous liquid solutions
!
The solubility of NaCl in water can be expressed
as a concentration, and as a molality (symbol b):
-1
bsolute = nsolute/msolvent (in mol kg )
The solvent is water, and the solute is a salt e.g.
NaCl and KCl.
For example:
b(NaCl) = 16.2 mol kg
-1
bNaCl = 16.2 mol kg
-1
Dissociation of salt molecules or chemical
reactions is usually ignored in the characterisation
of the composition of aqueous liquid solutions in
fluid inclusion research. The behaviour of multicomponent fluid systems that involve H2O and
salts is in general described in terms of associated
salt molecules. Partial dissociation of NaCl in
aqueous solutions results in the formation of a
0
+
variety of ions: NaCl , Na and Cl ions in distinct
concentrations. Complete dissociation results in
+
the formation of equal numbers of Na and Cl ions
that are equal to the amount of NaCl. For example,
one kilogram of average seawater contains 965 g
+
H2O, 10.7 g Na and 19.25 g Cl , consequently the
molality of an associated NaCl complex is 0.482
-1
mol kg , in the presence of excess Cl ions.
!
V (i)
#V j
n(i)
"n j
j
For a condensed phase x is used for mass fraction
(e.g. liquid), and for a gaseous mixtures y may be
used (e.g. vapour). Mass fractions are often
erroneously described as "weight fraction" (see
paragraph 1.1), which should be omitted because
weight is per definition a force (in newton), and
mass is expressed in kg. The term “ppm”, meaning
−6
6
10 relative value, or 1 in 10 , or parts per million,
is also used. This is analogous to the meaning of
percent as parts per hundred. The terms “parts per
billion”, and “parts per trillion”, and their respective
abbreviations “ppb”, and “ppt”, are best avoided,
because their meanings are language dependent.
In English-speaking countries, a billion is now
9
12
generally taken to be 10 and a trillion to be 10 ;
however, a billion may still sometimes be
12
18
interpreted as 10 and a trillion as 10 . The
abbreviation "ppt" is also sometimes read as parts
per thousand, adding further confusion.
In
mathematical
expressions,
the
internationally recognized symbol % (percent) may
be used with the SI to represent the number 0.01.
Thus, it can be used to express the values of
dimensionless quantities. When it is used, a space
separates the number and the symbol %. In
expressing the values of dimensionless quantities
in this way, the symbol % should be used rather
than the name “percent”. When any of the terms %
and ppm are used it is important to state the
7
©Geol. Bundesanstalt, Wien; download unter www.geologie.ac.at
European Current Research on Fluid Inclusions (ECROFI-XXI)
Montanuniversität Leoben, Austria, 9–11 August, 2011. Abstracts, p. 8
dimensionless quantity whose value is being
specified.
For example:
and it is therefore recommended to use the space
or dot.
For example:
the mass fraction
w = 0.12
w = 12 %
w = 120 g/kg
the amount fraction
x = 3.7·10
x = 3.7 %
x = 37 mmol/mol
-2
Numerical values of physical quantities, which
have been experimentally determined, are usually
subject to some uncertainty. The experimental
uncertainty should always be specified. The
magnitude of the uncertainty may be represented
as follows:
For example:
l = (5.3478 ± 0.0065) cm
l = 5.3478 cm ± 0.0065 cm
N m or N·m (for a newton metre)
-1 -1
-1 -1
J/(mol K) or J mol K or J·mol ·K
and not:
Nm or N×m
Within the text, for example, the equation T = 293
K may equally be written T/K = 293. The numerical
value always precedes the unit, and a space is
always used to separate the unit from the number.
Thus the value of the quantity is the product of the
number and the unit, the space being regarded as
a multiplication sign. The symbol ˚C for the degree
Celsius is preceded by a space when one
expresses values of Celsius temperature t. Only
when the name of the unit is spelled out would the
ordinary rules of grammar apply, so that in English
a hyphen would be used to separate the number
from the unit.
For example:
4. Writing unit symbols and names, and
expressing the values of quantities
Symbols for quantities are generally single letters
set in an italic font, although they may be qualified
by further information in subscripts or superscripts
or in brackets (in upright fond). Thus V is the
recommended symbol for volume, Vm for molar
volume, Vm, A or Vm(A) for molar volume of phase
A.
Unit symbols are mathematical entities and
not abbreviations. Therefore they are not followed
by a period except at the end of a sentence, and
one must neither use the plural nor mix unit
symbols and unit names within one expression,
since names are not mathematical entities. It is not
permissible to use abbreviations for unit symbols
3
or unit names, such as cc (for either cm or cubic
centimetres).
In forming products and quotients of unit
symbols the normal rules of algebraic multiplication
or division apply. Multiplication must be indicated
by a space or a half-high dot (·). When multiplying
the value of quantities either a multiplication sign
(×), or brackets should be used, not a half-high dot.
When multiplying numbers only the multiplication
sign (×) should be used. Division is indicated by an
oblique stroke (/) or by negative exponents. In
general, the sign × can be mistaken for the symbol
of the quantity 'amount of substance fraction' (x),
8
3
a 35-cm vessel
The decimal marker is the point on the line. If the
number is between +1 and -1, then the decimal
marker is always preceded by a zero. For numbers
with many digits, the digits may be divided into
groups of three by a thin space, in order to
facilitate reading.
4.1 State of aggregation
The components within fluid inclusions can be
present in several states of aggregation (phases),
in general, in the liquid, vapour and super-critical
state. The following two- or three-letter symbols
(Table 4) are used to represent the states of
aggregation of chemical species for specific
quantities. The letters should be printed in upright
font without a full stop (period) in a superscript.
Phase
vapour
liquid
supercritical
fluid
solid
clathrate
Symbol
vap
liq
scf
Microthermometry
V
L
SCF
sol
cla
S
Table 4. States of aggregation
©Geol. Bundesanstalt, Wien; download unter www.geologie.ac.at
European Current Research on Fluid Inclusions (ECROFI-XXI)
Montanuniversität Leoben, Austria, 9–11 August, 2011. Abstracts, p. 9
Phase
Symbol
crystalline
cr
amorphous
am
solid
vitreous
vit
substance
solution
sln
aqueous
aq
solution
Table 4. continued
Microthermometry
For example:
liq
Vm = molar volume of the liquid phase
liq
liq
xa = 0.3, or x (a) = 0.3
xa = 0.3, or x(a) = 0.3
If the name of the specified component (a) is
rather large, i.e. more than 3 letters, the notation
with brackets is preferred. The Greek letter
symbols α, β, may be similarly used to denote
phase α, phase β, etc., in a general notation.
Phase changes that occur in fluid inclusions in
microthermometrical experiments can be illustrated
with single-letter symbols V, L and S.
Both "gas" and "vapour" have been used
to indicate the lower density aggregation state. It is
preferred to use "vapour" for this phase, whereas
"gas" refers to components or a mixture of
components.
4.2 Tables and figures
It is often convenient to write the quotient of a
quantity and a unit for the heading of a column in a
table, so that the entities in the table are all simple
numbers. For example, a table of the natural
logarithm of vapour pressure against temperature,
reciprocal temperature, and molar volume may be
formatted as shown below.
3
3
-1
T/K
10 K/T
Vm/cm mol
573.15
1.7447
22.47
600.00
1.6667
23.03
623.15
1.6048
23.55
Table 5. Example table.
ln(p/MPa)
1.8073
2.1920
2.4907
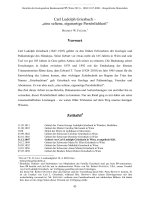
The axes of a graph may also be labelled in this
way, so that the tic marks are labelled only with
numbers, as in Figure 1.
Fig. 1. Example phase diagram of H2O, with curves
3
-1
of equal molar volume (18 to 500 cm ·mol ).
5. Quantities in fluid inclusion research
Temperature is an important quantity in fluid
inclusion research, because microthermometry
reveals a variety of phase changes at specific
temperatures, including homogenization and
melting temperatures (Table 5, see also Diamond,
2003; v.d. Kerkhof & Thiery, 2001). All
temperatures involve a process where two phases
are unified in one phase by homogenization or
dissolution upon heating. In addition, freezing of
inclusions can also be analysed at specific
temperatures. All temperatures are expressed in
degree Celsius or Kelvin.
Quantity
Symbol of
quantity
Th
Phase
transition
homogenization
LV → L
temperature
LV → V
LV → SCF
a
LLV → LV
a
LLV → LL
a
LLV → LSCF
a
SLV → SL
dissolution
Tm
SV → LV
b
c
temperature
SL → L
d
SL → LV
SLV → LV
SLL → LL
nucleation
Tn
LV → SV
temperature
LL → SL
LV → S
Table 5. The main quantities in microthermometry
9
©Geol. Bundesanstalt, Wien; download unter www.geologie.ac.at
European Current Research on Fluid Inclusions (ECROFI-XXI)
Montanuniversität Leoben, Austria, 9–11 August, 2011. Abstracts, p. 10
5.3 Nucleation temperature
a)
These
processes
are
"partial
homogenizations", e.g. CO2 liquid and
vapour phases may homogenize in the
presence of an aqueous liquid solution that
wets the walls of the inclusion.
b) The process of "melting" refers to pure
substances,
and
corresponds
to
"dissolution" in multi-component systems.
c) This process of dissolution is in principle
also a homogenization of two phases.
d) This process is also known as
"metastable melting", when a vapour
phase appears simultaneously with the
complete dissolution of a solid phase.
5.4 Decrepitation
5.1 Style
The general
temperatures:
style
of
expressing
these
Tprocess (phase transition)
!
Nucleation temperature is usually measured during
cooling
experiments,
and
represents
a
spontaneous phase changes of an undercooled
metastable phase assemblage to a stable
assemblage. The value of Tn depends on the size
and shape of the inclusion and the velocity of
cooling, and it can only be reproduced within a
range of several degrees Celsius. The value of Tn
is indicative for the salinity of the fluid system, e.g.
highly saline aqueous solutions have lower Tn
values than solutions with lower salinities. Some
brines fail to nucleate solid phases, even at -190
˚C (see also Bakker, 2004).
where it is important to note that the subscript is in
upright font and the symbol of the quantity in italic
font. Specific solid phases can be indicated with
their proper name, and specific phase transition
can be indicated with symbols.
The strength of the host mineral around fluid
inclusions can be characterized by the
"decrepitation" temperature (symbol Td). At this
temperature, cracks are formed in the crystal
around fluid inclusions with high internal fluid
pressures. When the extensions of these cracks
remain inside the crystal, the fluid inclusions has
suffered an uncontrolled increase in total volume,
otherwise, fluid can be lost from the inclusions.
The value of Td is also affected by the shape and
size of fluid inclusions, and their distance to the
crystal surface (or grain boundary).
For example:
Tm(IceV→LV), or Tm(Ice)
Th(HaliteL→L), or Th(Halite)
Th(LV→L), or Th(total)
The word "total" does not include the mode of
homogenization, it requires, therefore, extra
information.
5.2 Eutectic temperature
The eutectic temperature, symbol Te, the minimum
temperature of liquid stability, is a variety of Tm. In
binary systems (i.e. two components), this
temperature corresponds with the dissolution of
one solid phase and the simultaneous appearance
of a liquid phase, whereas the other solid phase(s)
remain(s) present (e.g. Ice + Hydrohalite + Vapour
→ Ice + Liquid + Vapour). The value of Te can be
correlated to a specific system, for example, -21 ˚C
is indicative for the binary H2O-NaCl system, but is
very difficult to detect optically (see also Bakker,
2004).
5.5 Equivalent mass
The term "equivalent" has a general application in
chemistry. In fluid inclusion research, it is used to
describe the mass of one equivalent entity (e.g.
NaCl) that produces a specific dissolution
temperature of ice, salt-hydrates, or salt in a liquid
aqueous solution of unknown composition.
Equivalent is abbreviated with eq and it is put in
front of the base unit symbol. For example, a liquid
-1
solution with b(CaCl2) = 1.0 mol kg will have a
Tm(Ice) of -6.0 ˚C; the same temperature is
obtained from a solution with b(NaCl) = 1.7 eq mol
-1
kg . As a fraction, this solution has a w(NaCl) of
9.2 eq %. Alternatively, the type of percentage can
be further specified with its quantity, e.g. 9.2 eq
mass%.
For example:
w(NaCl) = 9.2 eq %
the mass fraction of NaCl is 9.2 eq %
the solution contains 9.2 eq mass% NaCl
The eutectic temperature of the binary H2O-NaCl
system is -21.2 ˚C, therefore, lower dissolution
10
©Geol. Bundesanstalt, Wien; download unter www.geologie.ac.at
European Current Research on Fluid Inclusions (ECROFI-XXI)
Montanuniversität Leoben, Austria, 9–11 August, 2011. Abstracts, p. 11
temperatures cannot be transformed in NaCl mass
equivalents. CaCl2 or ZnCl2 can be selected as
equivalent entities for dissolution temperatures
below -21.2 ˚C.
5.6 Fluid inclusion types
Fluid inclusions are usually classified according to
their fluid properties, shapes, and distributions.
The main component of a fluid inclusion can be
used as a specification in the type-name.
or
p =
nRT
n 2a
" 2
(V " nb) V
where R is the gas constant, and a and b are van
der Waals constants (see also Bakker, 2009). The
symbols
! for temperature and volume are written in
capital italic font, whereas the symbols for
pressure and amount of substance (and fractions)
are written in normal italic font.
For example:
References
a H2O-rich fluid inclusion
a water-rich fluid inclusion
Bakker, R.J. (2003) Package FLUIDS 1. Computer
programs for analysis of fluid inclusion data and
for modelling bulk fluid properties. Chemical
Geology, v. 194 , 3-23.
Bakker, R.J. (2004) Raman spectra of fluid and
crystal mixtures in the systems H2O, H2O-NaCl
and H2O-MgCl2 at low temperatures: application
to
fluid
inclusion
research.
Canadian
Mineralogist, vol. 42, 1283-1314.
Bakker, R.J. (2009) Package FLUIDS. part 3.
Correlations between equations of state,
thermodynamics and fluid inclusions. Geofluids,
vol. 9, 63-74.
Boiron, M.C., Essarraj, S., Sellier, E., Cathelineau,
M., Lespinasse, M., Poty, B. (1992)
Identification of fluid inclusions in relation to
their host microstructural domains in quartz by
cathodoluminescence.
Geochimica
et
Cosmochimica Acta, vol. 56, 175-185.
Bureau International des Poids et Mesures (2006)
th
The International System of Units. 8 Edition,
Organisation Intergouvernementale de la
Convention du Metre, 95-180.
Diamond, L.W. (2003) Glossary: Terms and
Symbols used in Fluid Inclusion studies. In:
Fluid Inclusions: Analysis and Interpretation (I.
Samson,
A.
Anderson,
D.
Marshall)
Mineralogical Association of Canada Short
Course Series Vol. 32, 363-372.
Kerkhof, A.M. van den, Thiery, R. (2001) Carbonic
inclusions. Lithos, vol. 55, 49-68.
Mills, I., Cvitas, T., Homann, K., Kally, N., Kuchitsu,
K. (1998) Quantities, Units and Symbols in
Physical Chemistry. International Union of Pure
and Applied Chemistry (IUPAC), Physical
Chemistry Division, Second Edition, Blackwell
Science, pp 167.
The type names can also be related directly to
their behaviour in microthermometric experiments
(Boiron et al., 1992). The upper case letters L and
V are symbols for inclusions that homogenize in
the liquid phase and vapour phase, respectively.
The lower case letters w and c are symbols for the
compositions: H2O-rich (±salt) and CO2-rich (±CH4
and N2), respectively.
For example, a Lw inclusion is a water-rich
fluid inclusion with total homogenization in the
liquid phase. The presence of salt may depress the
dissolution temperature of ice. A Lcw inclusion
may reveal clathrate, ice and CO2 dissolution
temperatures, because it is composed of H2O and
CO2, with or without minor amounts of CH4, N2 and
NaCl. The total homogenization of this inclusion
occurs in the liquid phase.
Lc and Vc fluid inclusions are gas-rich that
homogenize in the liquid and vapour phase,
respectively. Kerkhof & Thiery (2001) have further
classified these types of inclusions in the CO2-CH4N2 fluid system according to their complex
behaviour at low temperatures as H-type (liquidvapour homogenization) and S-type (solid-liquid or
solid-vapour homogenization).
5.7 Fluid properties
The properties of fluids can be described in terms
of n, T, V, and p. Alternatively, x, T, Vm, and p are
used (see also Bakker, 2003). These properties
can be expressed in an equation of state, i.e. a
mathematical formula that relates these quantities,
e.g.:
p =
RT
a
"
(Vm " b) Vm 2
!
11
©Geol. Bundesanstalt, Wien; download unter www.geologie.ac.at
European Current Research on Fluid Inclusions (ECROFI-XXI)
Montanuniversität Leoben, Austria, 9–11 August, 2011. Abstracts, p. 12
12
©Geol. Bundesanstalt, Wien; download unter www.geologie.ac.at
European Current Research on Fluid Inclusions (ECROFI-XXI)
Montanuniversität Leoben, Austria, 9–11 August, 2011. Abstracts, p. 13
Session Index
In alphabetical order according to first author
Theoretical Studies on Fluid and Mineral Properties
Bakker, Ronald J.
Lecumberri-Sanchez, Pilar
Marti, Dominik
34
126
138
Experimental Studies
Azim Zadeh, Amir, M.
Baumgartner, Miriam
Doppler, Gerald
Hidalgo Staub, Rita
Kotelnikov, Alexey
Tarantola, Alexandre
26
44
72,74
102
120
196
Advances in Analytical Methods
Bakker, Ronald J.
Baumgartner, Miriam
Burruss, Robert C.
Esposito, Rosario
Greminger, Andrea
Hrstka, Thomas
Lüders, V.
Takács, Ágnes
32
42
54
84
96
104
130
190
Diagenetic and Petroleum Fluids
Balitsky, Vladimir S.
Bourdet, J.
Demange, C.
Dolníček, Zdeněk
Fall, András
González-Acebrón, L.
Kiss, Gabriella
Naumov, Vladimir B.
Speranza, G.
36
48,50
60
70
86
94
116
146
184
13
©Geol. Bundesanstalt, Wien; download unter www.geologie.ac.at
European Current Research on Fluid Inclusions (ECROFI-XXI)
Montanuniversität Leoben, Austria, 9–11 August, 2011. Abstracts, p. 14
Ore Deposits
Ankusheva, Natalia N.
Azim Zadeh, Amir, M.
Banks, David
Bozkaya, Gulcan
Canosa, Francisco
Daliran, Farahnaz
Dobes, Petr
Dolníček, Zdeněk
Doria, Armanda
Einali, Morteza
Fan, Hong-Rui
Figueiredo e Silva, Rosaline C.
Gál, Benedek
Hagemann, Steffen .G.
Hu, Fang-Fang
Hübst, Zdenek
Kovalenker, Vladimir
Krupenin, M.T.
Lecumberri-Sanchez, Pilar
Mackizadeh, Mohammad Ali
Marques de Sá, Carlos
Marshall, Dan
Martínez-Abad, Iker
Mavrogenes, John A.
Moncada, Daniel
Ortelli, Melissa
Piribauer, Christoph J.
Prokofiev, Vsevolod Yu.
Sezerer Kuru, G.
Shahinfar, Hamid
Sokolov, Stanislav V.
Sosa, Graciela M.
Sośnicka, Marta
Steele-MacInnis, Matthew
Tanner, Dominique
Vikentyev, Ilya V.
Vikentyeva, Olga V.
Xu, Jiuhua
Zacharias, Jiri
22
28
40
52
56
58
62,64
68
76
80,82
88
90
92
100
106
108
122
124
128
132
134
136
140
142
144
154
162
164
168
170
172
180
182
186
192
200
202
206
208
Deep Crustal and Mantle Fluids
Bagheriyan, Siyamak
Berkesi, Márta
Káldos, Réka
14
30
46
112
©Geol. Bundesanstalt, Wien; download unter www.geologie.ac.at
European Current Research on Fluid Inclusions (ECROFI-XXI)
Montanuniversität Leoben, Austria, 9–11 August, 2011. Abstracts, p. 15
Kerkhof, Alfons M. van den
Németh, Bianca
Park, Munjae
Pintér, Zsanett
Piribauer, Christoph J.
Tarantola, Alexandre
114
150
156
158
160
194
Melt Inclusions and Igneous Processes
Andreeva, Irina A.
Andreeva, Olga A.
Astrelina Elena
Doherty, Angela
Guzmics, Tibor
Hurai, Vratislav
Klébesz, Rita
Naumov, Vladimir B.
Nikolaeva A.T.
Rokosova E. Yu.
Sokolova, Ekaterina
Solovova Irina
Steele-MacInnis, Matthew
Tolstykh, M.L.
Whan, Tarun H. E.
18
20
24
66
98
110
118
148
152
166
174
176,178
188
198
204
Paleoclimate and Groundwater
Dublyansky, Yuri
Shahinfar, Hamid
78
171
15
©Geol. Bundesanstalt, Wien; download unter www.geologie.ac.at
European Current Research on Fluid Inclusions (ECROFI-XXI)
Montanuniversität Leoben, Austria, 9–11 August, 2011. Abstracts, p. 16
16
©Geol. Bundesanstalt, Wien; download unter www.geologie.ac.at
European Current Research on Fluid Inclusions (ECROFI-XXI)
Montanuniversität Leoben, Austria, 9–11 August, 2011. Abstracts, p. 17
Oral and Poster Abstracts
in alphabetical order according to first author
17
©Geol. Bundesanstalt, Wien; download unter www.geologie.ac.at
European Current Research on Fluid Inclusions (ECROFI-XXI)
Montanuniversität Leoben, Austria, 9–11 August, 2011. Abstracts, p. 18
Composition and evolution of magmas producing alkaline salic rocks
(trachydacite and pantellerite) of the Dzarta Khuduk bimodal volcanic
association, Central Mongolia
Andreeva, Irina A.
Institute of Geology of Ore Deposits, Petrography, Mineralogy and Geochemistry Russian Academy of
Sciences (Igem Ras), Staromonetny 35, 119017, Moscow, Russia
The composition, evolution, and origin of
the melts that produced trachydacite and
pantellerite of the Late Paleozoic bimodal volcanic
association at Dzarta Khuduk, central Mongolia,
were studied by examining melt inclusions with the
use of electron microprobe and ion probe.
The Dzarta Khuduk magmatic complex in
the western part of the Northern Gobi Rift Zone is
restricted to a number of narrow grabens of
latitudinal strike. The complex comprises alkaline
2
granosyenite and nordmarkite of a small (~15 km )
massif, alkaline granitoid and basalt dikes, and
volcanic piles of basalt, trachydiorite, comendite,
pantellerite, alkaline and subalkaline trachydacite,
and their tuffs. The age of the complex was
evaluated by U-Pb, Ar-Ar, and Rb-Sr techniques at
211 Ma. The volcanic fields have a complicated
facies structure, primarily because of the local
predominance of mafic or acid rocks, a fact
suggesting that these sites were close to
corresponding volcanic centres. The complex
includes three ancient volcanos and corresponding
isolated volcanic fields of Dzarta Khuduk, Unege
Betogin and Ulziit.
One of the largest massifs of acid
volcanics is Dzarta Khuduk paleovolcano, whose
fragments occur over an area of more than 120
2
km . The bottom of the volcanic pile is not
exposed, and judging by rock relations observable
1.5 km north of the volcanic field boundary, the
lower portions of the vertical section most probably
consist of basalt. The paleovolcano is made up of
alternating alkaline trachydacite, comendite,
pantellerite, their tuffs and ignimbrite. The volcanic
pile has a thickness of 600 m and is cut by
subvolcanic comendite bodies and agpaitic syenite
massifs. The rocks of the paleovolcano are
dominated by fluidal and eutaxitic lavas at
subordinate amounts of ignimbrite; the lavas have
18
aphyric or porphyritic textures and are often altered
and silicified (mostly in the proximity of subvolcanic
bodies). The mineralogical and chemical
composition of the unaltered rocks corresponds to
those of acid alkaline rocks of the K-Na series, with
an agpaitic coefficient (Ka) > 1 and with elevated
concentrations of F, REE, Rb, and Zr. Silicified
lithologies are enriched in REE (up to a few
mass%).
Primary crystalline and melt inclusions
were found in anorthoclase from trachydacite and
quartz from pantellerite and pantellerite tuff. The
identified minerals of crystalline inclusions in the
trachydacite are hedenbergite, F-apatite, and
pyrrhotite, and those in the pantellerite are Farfvedsonite, fluorite, ilmenite, and the rare REE
diorthosilicate chevkinite. Melt inclusions in
anorthoclase from the trachydacite consist of
glass, a gas phase, and daughter minerals (Farfvedsonite, fluorite, villiaumite, and anorthoclase
as a rim on the walls of the inclusions). Melt
inclusions in quartz from the pantellerite contain
glass, a gas phase, and fine-crystalline salt
aggregates of Li, Na, and Ca fluorides (griceite,
villiaumite, and fluorite) (Andreeva et. al, 2007). To
our knowledge, griceite has been reported in the
literature only once from sodalite inclusions in
hornfels of the Mont Saint-Hilaire massif, Quebec
(Canada) (Van Velthuizen J., Chao G., 1989). Melt
inclusions in clasts of quartz crystals from the
pantellerite tuff are originally homogeneous silicate
glasses.
The thermometry of melt inclusions in
phenocrysts in the trachydacite and pantellerite
indicates that they crystallized at temperatures of
1060 - 1030 °C. It was also determined that
inclusions in quartz from the pantellerite show
evidence of immiscibility between silicate and salt
(fluoride) melts at a temperature of 800 °C.
©Geol. Bundesanstalt, Wien; download unter www.geologie.ac.at
European Current Research on Fluid Inclusions (ECROFI-XXI)
Montanuniversität Leoben, Austria, 9–11 August, 2011. Abstracts, p. 19
Homogeneous melt inclusions in anorthoclase
from the trachydacite have a trachydacite or
rhyolite composition and contain 68 to 70 mass%
SiO2, 12 to 13 mass % Al2O3, 0.34 to 0.74 mass%
TiO2, 5 to 7 mass% FeO, 0.4 to 0.9 mass% СаО, 9
to 12 mass% Na2O + K2O at a agpaitic coefficient
(Ka) = 0.92 to 1.24. The glasses of homogenized
melt inclusions in quartz from the pantellerite and
pantellerite tuff have a rhyolite composition.
Compared to the glasses of melt inclusions in
anorthoclase from the trachydacite, glasses of melt
inclusions in quartz from the pantellerite are richer
in SiO2 (72 to 78 mass%) and poorer in Al2O3 (7.8
to 10.0 mass%). They contain 0.14 to 0.26 mass%
TiO2, 2.5 to 4.9 mass% FeO, 9 to 11 mass% Na2O
+ K2O, and 0.9 to 0.15 mass% СаО. The agpaitic
coefficient is 1.2 to 2.05. Homogeneous melt
inclusions in quartz from the pantellerite tuff
contain 69 to 72 mass% SiO2, and the
concentrations of other major components, for
example, TiO2, Al2O3, FeO, and CaO, are close to
the concentrations of these elements in the
homogeneous glasses of melt inclusions in quartz
from the pantellerite. The Na2O and K2O
concentrations are 4 to 10 mass%, the agpaitic
coefficient is 1 to 1.6.
The glasses of melt inclusions of each rock
group have different concentrations of volatile
components. Their Н2О concentrations are 0.08
mass% (in anorthoclase from the trachydacite), 0.4
to 1.4 mass% (in quartz from the pantellerite), and
up to 5 mass% (in quartz from the pantellerite tuff).
The F concentrations in glasses of melt inclusions
in phenocrysts of the trachydacite are not higher
than 0.67 mass%, and those in quartz form the
pantellerite and pantellerite tuff reach 2.8 and 1.4
mass%, respectively. The Cl concentrations in
glasses of melt inclusions in minerals in the
trachydacite reach 0.2 mass%, and those in
glasses in inclusions in quartz from the pantellerite
tuff are up to 0.5 mass%.
The trace-element composition of the
glasses and homogenized melt inclusions in
minerals from the rocks suggests that trachydacite
and pantellerite were produced by profoundly
differentiated rare-metal silicate alkaline melts with
high Li, Zr, Rb, Y, Hf, Th, U, and REE
concentrations. The composition of homogeneous
melt inclusions in minerals from the rocks provides
an insight into the magmatic processes that led to
concentrating trace elements (including REE) in
the rocks. The leading role there in was played by
the crystal fractionation and liquid immiscibility that
involved salt (fluoride) melts. It was also
determined that all of the melts underwent
differentiation in spatially separated magmatic
chambers, which predetermined differences in the
evolution of the trachydacite and pantellerite melts.
Late in the course of differentiation, when the
magmatic systems were saturated in ore elements,
salt Na-Ca fluoride melts were segregated and
extracted much Li.
REFERENCES
Andreeva I.A., Kovalenko V.I., Yarmolyuk V.V.,
Listratova E.N., Kononkova N.N. (2007).
Doklady Earth Sciences. 414 (4): 655-660.
Van Velthuizen J., Chao G. (1989). Canadian
Mineralogist. 27: 125-127.
19
©Geol. Bundesanstalt, Wien; download unter www.geologie.ac.at
European Current Research on Fluid Inclusions (ECROFI-XXI)
Montanuniversität Leoben, Austria, 9–11 August, 2011. Abstracts, p. 20
Basaltic melts in olivine phenocrysts from alkaline pumice of Southern
Primorye
*
**
*
Andreeva, Olga A. , Naumov, Vladimir B. , Andreeva Irina, A. and Kovalenko, Vyatcheslav I.
*
*Institute of Geology of Ore Deposits, Petrography, Mineralogy, Geochemistry, Russian Academy of
Sciences (IGEM RAS), Staromonetny 35, Moscow, 109017, Russia
**Vernadsky Institute of Geochemistry and Analytical Chemistry, Kosygina 19, Moscow 119991, Russia
A large intraplate volcanic province was
formed in the Late Cenozoic within Central and
Eastern Asia. Subalkaline and alkaline magmatism
is mainly typical for it. Acid magmatic rocks are a
rare exception. In the far eastern part of the
province, they are related only to the formation of
the large Pektusan volcano located at the
boundary between China and Northern Korea and
composed of alkaline trachyte and rhyolite. The
presence of such a volcano in this province is not
only a large geological problem it also determines
the high volcanic danger in the region as well. In
particular, its historical eruption 969 ± 20 AD was
accompanied by an outburst of a huge mass of
pyroclastic products, which reached the Islands of
Japan.
Based on the study of mineral inclusions
we consider the peculiarities of the composition of
a melt registered in olivine from alkaline pumices
of one of the Pektusan volcano eruptions and
estimate the mechanisms that could result in its
catastrophic eruptions.
The studied pumices produced by the
Pektusan volcano were collected in the territory of
Southern Primorye, in the Tyumen-Ula River area.
The Pektusan volcano is composed of lavas and
pyroclastic rocks of trachyte–comendite–rhyolite
composition intruded by volcanic necks and dykes
of
alkaline
basalt,
trachybasalt,
and
trachyandesite. According to the geochronological
data, the formation of the volcano proceeded over
>3 Ma. Alkaline pumices were removed by the
Tyumen-Ula River starting close to the Pektusan
volcano to the Sea of Japan and later dispersed by
sea currents along the coast.
Pumices are composed of light-grey glass
with a refractive index of 1.506 ± 0.002 and a small
portion (2 to 3 vol%) of phenocrysts of sanidine,
ferrohedenbergite, magnetite, olivine, apatite,
20
ilmenite, zircon, and chevkinite. According to the
chemical composition, pumices correspond to
trachyrhyodacite. The total concentration of alkalis
in them reaches up to 9.5 mass%, with an
insignificant prevalence of sodium over potassium.
Pumices are characterized by high concentrations
of niobium, zirconium, and REE). These pumices
are unusual, since olivine in them is magnesiumrich with the composition of Fo74 to Fo79. It is
characterized by a high CaO concentration (up to
0.22 mass%) as well.
Coexisting primary melt, crystalline, and
fluid inclusions were studied in olivine phenocrysts.
Crystalline inclusions in olivine comprise chromespinellid, titanomagnetite, picroilmenite, and
clinopyroxene (?). Chrome-spinellid inclusions
contain 8.8 to 16.7 mass% Cr2O3, 8.5 to 12.0
mass% Al2O3, and 7 to 8 mass% MgO at a FeO
concentration of 48 to 57 mass%. The studied
chrome-spinellids are characterized by an
extremely high TiO2 concentration reaching 10.5 to
14.0 mass%, which allowed us to characterize
them as titanium chrome-spinellids. Titanomagnetite contain 65 to 70 mass% FeO and 13
mass% TiO2. The chemical composition of ilmenite
is characterized by very high concentrations of
MgO (up to 9.6 mass%), which corresponds to the
composition of picroilmenite. In addition to ore
minerals, crystalline inclusions comprised an
unusual silicate phase with the composition close
to clinopyroxene. This phase is characterized by
extremely high concentrations of TiO2 and P2O5 (6
and 4 mass%, respectively). Thus, the mineral
association registered in olivine is not typical for
trachyrhyodacite.
Primary melt inclusions in olivine are
located irregularly and have a shape close to oval
and sizes from 30 to 150 µm. They are usually
partly crystallized and contain residual glass,
©Geol. Bundesanstalt, Wien; download unter www.geologie.ac.at
European Current Research on Fluid Inclusions (ECROFI-XXI)
Montanuniversität Leoben, Austria, 9–11 August, 2011. Abstracts, p. 21
daughter minerals and a gaseous phase. Residual
(not heated) glasses in melt inclusions contain high
concentrations of alkalis (Na2O + K2O) up to 5.2
mass%, CaO up to 5 mass%, P2O5 up to 1.3
mass% at concentrations of 60 to 64 mass% SiO2
and 21 mass% Al2O3. As a whole, the
compositions of residual glasses from melt
inclusions plot on the andesite field in the
classification SiO2 – (Na2O + K2O) diagram.
Daughter minerals of melt inclusions comprise
augite, ilmenite, titanium chrome-spinellid and
apatite. As a whole, the set of daughter minerals in
melt inclusions is close to the mineral association
registered in olivine as crystalline inclusions.
According to our thermometric data, the melt
inclusions homogenize at 1040 to 1230 ºС.
In addition, several two-phase fluid
inclusions containing liquid and gaseous carbon
dioxide were registered in two olivine phenocrysts.
Homogenization into the liquid phase occurs at
29.0 °C, which provides evidence a high density in
3
the inclusions (0.63 g/cm ). The pressure
calculated from PVT data of CO2 in a temperature
interval of 1040 to 1230 °C is 2600 to 3000 bar,
which corresponds to a depth of 10 to 13 km.
Examination of the glasses under an
electron microscope allowed us to reveal a
significant difference between their composition
and that of the pumice. The chemical composition
of homogeneous glasses from melt inclusions
corresponds to the composition of basalt and is
characterized by high concentrations of 2.2 to 3.5
mass% TiO2 and up to 0.7 mass% P2O5 at a SiO2
content of 44 to 52 mass% and 12 to 18 mass%
Al2O3. The concentration of alkalis (Na2O + K2O) in
the melts is quite high as well (4.0 to 6.6 mass%)
with a strong prevalence of Na2O over K2O. The
comparison of the compositions of the melt
inclusions and those of the alkali basalts of
Pektusan volcano show their obvious similarities
(Table 1). Similarly to the studied melts, alkaline
basalts are characterized by high TiO2
concentrations. As was mentioned above, the
formation of the Pektusan volcano with alkaline
pumices of Primorye as products occurred in
intracontinental
conditions.
The
studied
peculiarities of the composition of glasses from
homogenized
melt
inclusions
in
olivine
demonstrate clear characteristics of intraplate
magmas, particularly the high concentrations of
TiO2, P2O5, and K2O. Thus, the results of the study
of inclusions allow us to consider that olivine
observed in alkaline pumices as phenocrysts is a
non-equilibrium mineral and most likely a
crystalline fragment of the basalts. The identity of
the composition of glasses from melt inclusions in
olivine from basalts supports this assumption. The
presence of high-titanium and high-magnesium
minerals, namely titanium chrome-spinellid and
picroilmenite in olivine, is quite consistent with the
suggested assumption as well.
This allows us to assume participation of
the processes of mixing of melts with contrasting
compositions in the formation of alkaline pumices.
Portions of basaltic magma together with olivine
crystals contained in it were incorporated in the
mobile acid melt, which provided degassing and
foaming of magma. An increase in pressure in the
magmatic chamber could catalyze the explosive
eruption, which resulted in an outburst of trachyte
pumices containing phenocrysts of xenogenic
olivine. Thus, pumices of Primorye are most likely
hybrid rocks formed as a result of mixing of acid
and basic magmas.
SiO2
TiO2
Al2O3
FeO
MnO
MgO
CaO
Na2O
K2O
P2O5
Cl
S
Н2О
Total
1
43.89
3.55
12.36
18.92
0.32
6.47
7.7
3.03
1.41
0.79
0.03
0.13
98.6
2
47.32
2.67
13.85
13.62
0.17
7.79
7.16
3.07
1.55
0.59
0.03
0.08
97.9
3
46.77
3.06
14.78
12.81
0.21
4.51
6.96
3.71
2.18
0.64
0.48
99.91*
Table 1. Chemical composition of glass in melt
inclusions contained in olivine from pumice from
Primoye and basalt from Pektusan volcano
Note: 1, 2 – glasses in melt inclusions; 3 – basalt
(the analytical total is reported with regard for 3.80
mass% LOI (Sakhno, 2007)).
REFERENCES
Sakhno, V.G. (2007). Dokl. Ros. Akad. Nauk 417
(3): 528-534.
21