The exchange rate misalignment and its relationship with trade balance the case of vietnam
Bạn đang xem bản rút gọn của tài liệu. Xem và tải ngay bản đầy đủ của tài liệu tại đây (1.52 MB, 88 trang )
UNIVERSITY OF ECONOMICS
HO CHI MINH CITY
VIETNAM
INSTITUTE OF SOCIAL STUDIES
THE HAGUE
THE NETHERLANDS
VIETNAM - NETHERLANDS
PROGRAMME FOR M.A. IN DEVELOPMENT ECONOMICS
THE EXCHANGE RATE MISALIGNMENT AND
ITS RELATIONSHIP WITH TRADE BALANCE:
THE CASE OF VIETNAM
BY
CAO THANH BÌNH
MASTER OF ARTS IN DEVELOPMENT ECONOMICS
HO CHI MINH CITY, AUGUST 2013
UNIVERSITY OF ECONOMICS
HO CHI MINH CITY
VIETNAM
INSTITUTE OF SOCIAL STUDIES
THE HAGUE
THE NETHERLANDS
VIETNAM - NETHERLANDS
PROGRAMME FOR M.A IN DEVELOPMENT ECONOMICS
THE EXCHANGE RATE MISALIGNMENT AND
ITS RELATIONSHIP WITH TRADE BALANCE:
THE CASE OF VIETNAM
A thesis submitted in partial fulfilment of the requirements for the degree of
MASTER OF ARTS IN DEVELOPMENT ECONOMICS
BY
CAO THANH BÌNH
Academic Supervisor:
PHẠM THỊ THU TRÀ
HO CHI MINH CITY, AUGUST 2013
Acknowledgement
I would like to express sincere gratitude to my supervisor – Dr Pham Thi Thu Tra
for scientific guidance, patient encouragement and useful advices, which she has
provided throughout the time of preparation and accomplishment of this paper. I
also would like to thank to Prof Howard Nicholas who gave helpful comments on
the draft. Special thanks to Prof Nguyen Trong Hoai, and Dr Pham Khanh Nam for
guidance and support as our program administrators.
I also would like to give my deepest thanks to my parents, and my beloved wife
Khanh Linh for her spiritual supports, encouragements.
i
Table of contents
Acknowledgement....................................................................................................... i
Table of contents ........................................................................................................ ii
List of tables .............................................................................................................. iv
List of figures ............................................................................................................ iv
Abbreviations ............................................................................................................ vi
Abstract .................................................................................................................... vii
CHAPTER 1:
INTRODUCTION ...........................................................................1
1.1 Introduction .......................................................................................................1
1.2 Background, and problem statement .................................................................1
1.2.1 A brief history of Vietnamese exchange rate policy ..................................1
1.2.2 Recent Vietnam economic concerns ...........................................................2
1.3 Research objectives and research questions ......................................................5
1.3.1 Research objectives ....................................................................................5
1.3.2 Research questions......................................................................................5
1.4 Justification of the study....................................................................................5
1.5 Scope and limitation of the study ......................................................................5
1.6 Organization of the study ..................................................................................6
CHAPTER 2:
THEORETICAL FRAMEWORK ...................................................7
2.1 Introduction .......................................................................................................7
2.2 Overview of exchange rate misalignment .........................................................7
2.3 Theoretical background of exchange rate misalignment...................................8
2.3.1 The Purchasing Power Parity approach ......................................................8
2.3.2 The Fundamental Equilibrium Exchange Rate .........................................12
2.3.3 The Behavioral Equilibrium Exchange Rate ............................................13
2.4 Empirical studies .............................................................................................18
2.5 Conceptual Framework ...................................................................................27
2.6 Summary..........................................................................................................28
CHAPTER 3:
DATA AND RESEARCH METHODOLOGY .............................30
ii
3.1 Introduction .....................................................................................................30
3.2 The PPP approach............................................................................................30
3.3 The trade balance .............................................................................................31
3.4 The BEER approach ........................................................................................31
3.4.1 Real effective exchange rate (REER) .......................................................31
3.4.2 Other variables ..........................................................................................31
3.4.3 The calculation of the Real Exchange Rate Misalignment.......................33
3.4.4 The econometric procedure of the BEER approach .................................33
CHAPTER 4:
THE HISTORY OF ER MANAGEMENT IN VIETNAM...........38
4.1 Introduction .....................................................................................................38
4.2 Vietnam exchange rate history ........................................................................38
4.3 Summary..........................................................................................................46
CHAPTER 5:
FINDINGS AND DISCUSSIONS ................................................47
5.1 Introduction .....................................................................................................47
5.2 Equilibrium real exchange rate and misalignment ..........................................47
5.2.1 BEER approach ........................................................................................47
5.2.2 PPP approach ............................................................................................56
5.3 The relationship between the PPP exchange rate misalignment and the
Vietnam’s trade balance ........................................................................................57
5.3.1 The Vietnam’s trade structure ..................................................................58
5.3.2 The conclusion ..........................................................................................65
5.4 The movement of several Asian currencies ....................................................65
CHAPTER 6:
CONCLUSIONS AND RECOMMENDATIONS ........................68
6.1 Conclusion .......................................................................................................68
6.2 Policy recommendations .................................................................................69
6.3 Limitations and directions for further studies .................................................71
6.3.1 Limitations ................................................................................................71
6.3.2 Directions for further studies ....................................................................71
References .................................................................................................................72
Appendices ................................................................................................................ 78
iii
List of tables
Table 1: Several results of empirical researches for Chinese Renminbi ..................22
Table 2: Empirical studies of real ER misalignment in several countries ................24
Table 3: The measurements and expected signs of variables ...................................32
Table 4: Critical values for Dickey Fuller test ..........................................................35
Table 5: Inflation and exchange rate trends in 1985 – 1992 .....................................41
Table 6: Descriptive statistics ...................................................................................47
Table 7: The correlation matrix of variables .............................................................48
Table 8: The values of stationary tests of all variables .............................................49
Table 9: Regression result .........................................................................................50
Table 10: The values of stationary tests for residual (at level) .................................51
Table 11: Summary of estimating ER misalignment results in case of LICs ...........53
Table 12: The values of ER misalignment, according to BEER method..................78
Table 13: The values of ER misalignment, according to PPP method .....................79
List of figures
Figure 1: Inflation rate from period 1996Q1 to 2011Q3. ............................................. 3
Figure 2: Trade balance of all goods and services from 1995 to 2012. ........................ 4
Figure 3: The conceptual framework .......................................................................... 28
Figure 4: Inflation rate and nominal exchange rate (VND/USD). .............................. 39
Figure 5: Gaps between official exchange rate and unofficial market rate. ............... 39
Figure 6: Trading bands declared by the SBV. ........................................................... 40
Figure 7: Inflation and exchange rate trends in 1985 – 1992 ..................................... 41
Figure 8: Official and black market exchange rate in 2008 to 2009 ........................... 44
Figure 9: Official and black market exchange rate in 2010 to 2011 ........................... 45
iv
Figure 10: The residual of the regression result. ......................................................... 51
Figure 11: The histogram of residual .......................................................................... 53
Figure 12: The current exchange rate misalignment of the VND. .............................. 55
Figure 13: The permanent exchange rate misalignment of the VND. ........................ 55
Figure 14: The PPP ER misalignment (against a basket of currencies). .................... 56
Figure 15: The average current misalignment and TB from 2000 to 2009. ............... 57
Figure 16: The average permanent misalignment and TB from 2000 to 2009. .......... 57
Figure 17: The PPP exchange rate misalignment and TB from 2000 to 2012. .......... 58
Figure 18: The structure of Vietnam’s export from 2006 to 2012. ............................. 59
Figure 19: Several Vietnamese major exports’ products from 2000 to 2010 ............. 60
Figure 20: Several Vietnamese major exports’ products from 2000 to 2010.. ........... 60
Figure 21: The structure of Vietnam’s import from 2006 to 2012 ............................. 61
Figure 22: Several major imports’ commodities......................................................... 61
Figure 23: The imports of necessary machineries for export sectors ......................... 62
Figure 24: The exports and imports of electronic products and parts......................... 63
Figure 25: The exports and imports of mobile products and parts. ............................ 64
Figure 26: The TB excluding the exports & imports of mobile products and parts. .. 64
Figure 27: The percentage change of the nominal ER and the Vietnam’s inflation. .. 66
Figure 28: The percentage change of the Vietnam’s nominal ER and PPP ER. ........ 66
Figure 29: The percentage change of PPP exchange rate of several currencies. ........ 67
v
Abbreviations
BEER : Behavioral Equilibrium Exchange Rate
ER
: Exchange Rate
FEER : Fundamental Equilibrium Exchange Rate
GSO : General Statistics Office
IFS
: International Financial Statistics
LIC
: Low Income Country
MoIT : Ministry of Industry and Trade
PPP
: Purchasing Power Parity
REER : Real Effective Exchange Rate
SBV : State Bank of Vietnam
TB
: Trade Balance
USD : United States Dollar
VND : Vietnam Dong
vi
Abstract
It is said that the exchange rate policy plays an important role in an economy.
It links the domestic economy to other foreign ones. And exchange rate
misalignment is often the most interested topic of economists. Hence, the aim of
this research is to (i) estimate the exchange rate misalignment and (ii) investigate its
relationship with trade balance, in case of Vietnam.
The equilibrium exchange rates are obtained by two methods: the relative
PPP approach and the Behavioral Equilibrium Exchange Rate (BEER) model. The
misalignment of exchange rate is defined as the difference between the actual and
the equilibrium exchange rate. In the BEER approach, the co-integration is used to
test the long run relationship between the real effective exchange rate (REER) and
several macroeconomics variables. In the PPP approach, the misalignment of
exchange rate is calculated simply based on the domestic and foreign CPIs.
The result from the PPP approach suggests that: (i) the VND was
undervalued and slightly overvalued from 2000 to the middle of 2007; (ii) the
overvaluation of VND has sharply increased from the last half of 2007 up to now.
The exchange rate misalignment from PPP approach is chosen to examine the
impacts on the Vietnam’s trade balance. The conclusion is that the exchange rate
misalignment does not have strong relationship with trade balance.
Key words: exchange rate, misalignment of exchange rate, trade balance.
vii
CHAPTER 1: INTRODUCTION
1.1 Introduction
The purpose of this research is, first, to measure the Vietnam’s real exchange
rate misalignment; second, to study its relationship on Vietnam trade balance. The
exchange rate misalignment is defined as the deviation between the equilibrium1
and actual real exchange rate. An exchange rate is named overvalued when it is
higher than its equilibrium level; in the otherwise, an exchange rate is labeled
undervalued when it is lower than its equilibrium level.
This research presents two estimating exchange rate approaches: the relative
PPP approach and the Behavioral Equilibrium Exchange Rate model. First of all,
we need to quantify the real exchange rate equilibrium and calculate the
misalignment of real exchange rate by using two methods above. After that, by
applying several visual graphs, we can investigate the relationship between the
exchange rate misalignment and trade balance.
1.2 Background, and problem statement
1.2.1 A brief history of Vietnamese exchange rate policy
In 1986, Vietnamese economy had been coped with persistent concerns such
as the shortage of food, skyrocketing inflation, and twin deficits. Under pressure to
reform, policymakers had to make a series of action to transform the Vietnamese
economy from command to market oriented. In accordance to that economic
reforming process, Vietnam’s exchange rate regime also had several significant
changes. Vo, Dinh, Do, Hoang, & Pham (2000) found that multiple types of
exchange rate were applied before 1989. The first official exchange rates were
employed for foreign commercial transactions and non-commercial, respectively.
1
There are several different definitions of equilibrium real exchange rate. They will be reviewed specifically
in next chapter.
1
The second rate included the compensation for export firms. The third rate was
applied separately for exchanging abroad remittances. Obviously, that system
seemed to be complicated and was implemented inefficiently. Consequently, these
exchange rates were merged into the unique official rate in March 1989. The
official exchange rate was expressed publicly in the value of VND against USD by
the State Bank of Vietnam (SBV). The cross exchange rate between VND and the
third foreign currency is determined based on the information of SBV’s official
exchange rate and the rate between USD against that foreign currency.
From 1989 up to now, the Vietnamese exchange rate regime has been
considered as a crawling band regime. In theory, under crawling band system, the
state bank declares the official exchange rate within a trading band; and it may
change the value of official exchange rate and trading band according to the goals in
certain periods. In case of Vietnam, the exchange rate is declared officially by the
SBV with a specific trading band. Based on that information, Vietnamese
commercial banks can decide their buying and selling exchange rate. Besides two
instruments above, the SBV still exercises various administrative tools to assurance
its key role in the foreign exchange market. In several periods, SBV has applied
fixed interbank exchange rate with very low fluctuating band (i.e. 1 percent).
Therefore, numerous economists have considered that Vietnam exchange rate
policy looks like fixed exchange rate regime.
1.2.2 Recent Vietnam economic concerns
Recently, many economists have mentioned that the Vietnam’s exchange
rate is misaligned, particularly, high overvaluation. It leads to the urgent question,
that VND should be devaluated or not. However, finding the answer is a complex
task since exchange rate policy is always a challenged issue. Theoretically, the
exchange rate policy can affect many macroeconomics variables such as the
inflation rate, trade competitiveness, stability of financial system, and foreign
exchange market’s performance (Ho and McCauley, 2003). On the one hand, it is
2
argued that government could react against inflationary threat by using a nominal
exchange rate as an anchor (Giavazzi & Pagano, 1989). On the other hand, there are
opinions that to ameliorate trade balance, the exchange rate must be devaluated
enough to obtain competitiveness. As a result, import decreases, export increases
and trade balance improves (Dooley, Folkerts-Landau, & Garber, 2003).
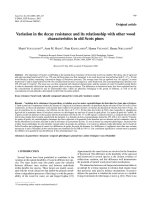
The first and hottest major issue is the inflation when it has become a serious
macroeconomic cyclical issue in recent years (Figure 1). Especially, Vietnam’s inflation
rate hits around 23% in 2011, which is the highest rate of inflation comparing to other Asia
countries. Vietnam’s high inflation over years erodes the VND’s value and pushes
pressures on living quality of Vietnamese people and exacerbates the Vietnam’s
macroeconomic turbulences.
Figure 1: Inflation rate from period 1996Q1 to 2011Q3.
2011Q4
2011Q1
2010Q2
2009Q3
2008Q4
2008Q1
2007Q2
2006Q3
2005Q4
2005Q1
2004Q2
2003Q3
2002Q4
2002Q1
2001Q2
2000Q3
1999Q4
1999Q1
1998Q2
1997Q3
1996Q4
1996Q1
30.00
25.00
20.00
15.00
10.00
5.00
0.00
-5.00
Inflation Rate(%)
Source: Data from IFS
According to Svensson (1998), exchange rate policy can influence inflation
in several ways. By keeping the nominal exchange rate stable, government can
manage imported foreign goods’ prices, which come into the domestic consumer
price index. For this reason, inflation can be controlled partially by keeping
exchange rate stable. Moreover, in an economy which was highly affected by
dollarization problem like Vietnam’s, the psychological expectation of holding
foreign currencies plays a significant role. Therefore, the stability of exchange rate
value in VND against USD helps ensure the benefit of holding VND and leads to
3
maintain the confidence of keeping domestic currency. Hence, this expectation also
contributes to reduce inflation in certain ways.
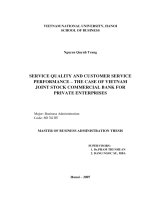
Trade deficit is the second major problem while it has dramatically climbed
up since 2000 (Figure 2), especially when Vietnam joined WTO at 2007. In theory,
trade deficit is believed to dry up national foreign reserve, increase foreign debts,
lead to a monetary crisis in several cases.
Figure 2: Trade balance of all goods and services from 1995 to 2012.
5
5.00%
0
0.00%
-5.00%
-5
-10.00%
-10
-15.00%
-15
-20.00%
-20
-25.00%
2000 2001 2002 2003 2004 2005 2006 2007 2008 2009 2010 2011 2012
Trade Balance
TB/GDP
Source: Data from IFS.
In the situation that trade deficit is one of major concerns, exchange rate
policy is also considered as a supportive solution to improve it. Traditionally, a
depreciation of the domestic currency enhances competitiveness by increasing the
price of import goods in domestic currency units and reducing the price of exports
in terms of foreign currencies. Subsequently, the effect of currency depreciation can
lead to an increase in exports’ volume and a decrease in imports’ volume and hence
improve trade balance.
Depending on the targets which are focused by policymakers, the exchange
rate policy will be designed to deal with specific problem and bypass others. From
the end of 2010 up to now, Vietnamese government has prioritized the settlement of
inflation by applying both market and non-market instruments to keep VND’s value
almost unchanged. However, if we pay attention on inflation too much, the
misalignment of real exchange rate will happen dramatically due to the actual real
4
exchange rate is much different than its equilibrium level. After all, this may erodes
the competitiveness of domestic tradable goods and leads to deteriorate the trade
balance.
1.3 Research objectives and research questions
1.3.1 Research objectives
The goal of this research paper is to study the degree of real exchange rates
misalignment and its relationship with trade balance.
1.3.2 Research questions
a) Is the real exchange rate of the VND misaligned?
b) If it is right, is there a relationship between the Vietnam’s real exchange rate
misalignment and its trade balance?
1.4 Justification of the study
There are few of studies that provide knowledge about the Vietnam exchange
rate misalignment. Hence, this is an interesting study that combines two separated
estimating exchange rate misalignment methods. First, the relative PPP based
approach is the earliest and simplest one. Second, the BEER model is the modern
approach which is based on an econometrics model with a set of macroeconomics
variables.
Moreover, we offer a vision of exchange rate misalignment’s impacts on
trade balance and propose appropriate policy recommendations. So the evidence
from this study is informative and useful for Vietnamese authorities when they
consider a proper exchange rate policy.
1.5 Scope and limitation of the study
This research examines the Vietnamese misalignment of exchange rate from
1995Q1 to 2011Q4. Since exchange rate issue is clearly a complex challenge, we
5
try to apply as many estimating methods as we can. The BEER model covers from
2000Q1 to 2010Q2 while PPP computation covers from 1995Q1 to 2011Q4.
Because of the lack of Vietnam macroeconomics data, several similar
proxies have to be used to substitute major variables. So the first limitation of this
research is the unavailability of macroeconomics data. Moreover, the PPP
computation and the BEER model by themselves contain weaknesses because of
their approach assumptions. Hence, the second limitation comes from the model
drawbacks.
1.6 Organization of the study
This research is organized as follows: the first chapter is an introduction part.
The second chapter provides theoretical framework. The third chapter presents the
source of data and the research methodology. The fourth chapter indicates the
Vietnamese exchange rate management history. The fifth chapter points out the
findings and discussions. The sixth chapter contains the conclusions and policy
recommendations.
6
CHAPTER 2: THEORETICAL FRAMEWORK
2.1 Introduction
In the literature, there are various equilibrium exchange rate concepts; and
there are also corresponding approaches which are used to estimate these concepts.
However, it is said that the “proper” criteria, which can be used to conclude what is
the most “correct” equilibrium exchange rate concept, do not exist. That is the
reason why there is no ideal model can be expected to deal with all policy
questions. Hence, depending on the particular questions that are being concerned,
the appropriate concepts and models are picked up to solve corresponding
problems. Therefore, the main target of this chapter is to: (i) describe approaches
that are utilized to calculate the misalignment of exchange rate and (ii) discuss
briefly the exchange rate misalignment’s impacts on trade balance.
2.2 Overview of exchange rate misalignment
The exchange rate misalignment is defined as the difference between the
equilibrium and actual real exchange rate. An exchange rate is named overvalued
when it is higher than its equilibrium level; in the otherwise, an exchange rate is
labeled undervalued when it is lower than its equilibrium level.
In emerging and developing countries, the misalignment of exchange rate is
one of the most essential issues in exchange rate regime. Furthermore, exchange
rate misalignments can originate in any regimes including fixed, floating, and
crawling peg (Obsfeld and Rogoff, 1995). In a floating system, the existence of
misalignment comes from speculative reasons which boost the real exchange rate
too much than its equilibrium. In fixed exchange rate regime or crawling peg
system, the causes of misalignments are poor macroeconomic policies which
prevent the appropriate movements of the exchange rate in the general economy’s
tendencies.
7
2.3 Theoretical background of exchange rate misalignment
In general, there are two major estimating approaches. They are the relative
Purchasing Power Parity based approach, and the model based approach. First, the
relative PPP based approach is the earliest one and is applied largely by many
economists. Second, the model based approach links the real exchange rate with a
set of macroeconomic variables to a single equation, and obtains the equilibrium
real exchange rate via this equation’s regression results. This approach is divided
into two classes: (1) the general equilibrium approach, and (2) the reduced form
general equilibrium approach. The most representative models of the first class are
the Fundamental Equilibrium Exchange Rate (FEER) model, and the Desired
Equilibrium Exchange Rate (DEER) model. The most popular models of the second
class are the Behavioral Equilibrium Exchange Rate (BEER) model, the Permanent
Equilibrium Exchange Rate (PEER) model, and the Natural Real Exchange Rate
Approach (NATREX). In this research, the relative PPP based approach, and the
BEER model are chosen to measure the equilibrium exchange rate of VND because
these methods are feasible to apply.
2.3.1 The Purchasing Power Parity approach
Purchasing power parity (PPP) theory is the most common approach that
deals with equilibrium exchange rate issue. Due to its simplicity, it is applied
broadly in various academic studies as well as in economic organizations’ yearly
publications.
2.3.1.1 The PPP concepts
PPP states that exchange rates will modify themselves to make sure that
purchasing powers of different currencies are the same in the long run.
Theoretically, there are three versions of PPP concept: the law of one price, absolute
PPP, and relative PPP.
8
The first, “the law of one price”, is based on assumption that there are no
transaction costs, trade barriers, and transportation costs in countries. If it holds,
then an individual tradable commodity that is sold in different countries has the
same price when its price is expressed in a common currency. This concept can be
illustrated as in the mathematical equation:
=
In which,
×
∗
(1)
is the domestic price level of an individual tradable commodity.
∗
is
the foreign price level of that commodity. S is nominal exchange rate expressed as
the number of home currency units per foreign currency unit per (i.e. 21000
VND/USD); so that an increase in S indicates a depreciation of the home-country
currency.
The second, absolute PPP is the extension of the first concepts when the law
of one price holds for all of tradable commodities across countries. This concept is
expressed as:
=
In which,
is the domestic price and
∗
×
∗
(2)
is foreign price of a certain set of tradable
commodities. S is the PPP (nominal) exchange rate that ensures the prices of a given
set of commodities in different countries are equal.
The third, relative PPP points out that the difference in the inflation rates
between domestic and foreign countries should be equal to the percentage change2
in the value of exchange rate. The relative PPP is expressed in logarithm form as:
∆ln( ) = ∆ln( ) − ∆ln(
∗
) or
=
−
∗
(3)
In reality, PPP theory scarcely holds even if its assumptions are not violated.
This is because all economies have various types of non-tradable goods and
2
The percentage change in the value of
can be calculated via formula:
9
≈
−
=∆
services. Furthermore, it takes time on transporting goods between countries and
regions around the world; the information needed for comparing identical goods is
not always available; the diverging income and preferences in different countries;
the specialized in producing differential goods in spectacular countries. These
reasons above make the prices of similar goods vary in different countries. That is
the explanation why PPP is expected to hold over medium to long run.
2.3.1.2 Applying the relative PPP approach to estimate equilibrium
exchange rate
Traditionally, the relative PPP is the simplest approach which is applied
mostly to estimate equilibrium real exchange rate in various macroeconomics
models. Using this approach to compute equilibrium exchange rate requires main
important assumptions. First, the equilibrium real exchange rate(
). Second, this equilibrium exchange rate
the real exchange rate in the base year(
=
is considered to be constant over years (
in several periods,
)is defined as
!
=⋯=
=
=
). Third,
could change slightly, however, the real exchange rates will
converge in the long run.
The misalignment real exchange rate (at year t) is defined as the percentage
deviation between the actual real exchange rate (
exchange rate(
)and the equilibrium real
). Hence, the value of this misalignment is:
#$
=
%
%&
%&
=
%
%'
%'
≈
−
(4)
The equation (4) means that the value of real exchange rate misalignment at
year t is equal the percentage change of the real exchange rate from year t to the
base year.
In theory, the real exchange rate is defined as the nominal exchange rate
adjusted by the domestic and foreign price levels (Rajan and Siregar, 2006). Hence,
the real exchange rate is expressed mathematically as:
10
=
×
∗
/
(5)
It is true that the percentage change in the value of left side variable and the
right side ones in equation (5) must be equal:
(
)=(
−
⇒ #$
=(
) − )(
−
) − )(
−
)−(
−
)−(
−
∗
∗
∗)
−
∗)
−
* (6)
*
(7)
This equation provides a directly way to compute the misalignment of
exchange rate via the subtraction between the percentage change of the nominal
exchange rate and the difference between the domestic and foreign inflation from
year t to the base year. The different between the percentage change of the nominal
exchange rate (
inflation)(
If (
−
−
−
) > )(
) and the difference between the domestic and foreign
)−(
−
∗
−
∗)
)−(
* presents the domestic currency’s state.
∗
−
∗)
* is true, it indicates an
undervaluation. In the otherwise, an overvaluation appears3.
In this research, the misalignment of exchange rate will be calculated against
a basket of foreign currencies by applying the weighted of traded goods with
Vietnam’s trading partners. For this reason, the equation (7) will be modified to:
#$
3
= - 4 ./(
−
) − )(
−
)−(
∗
−
∗
)*0 × 1 2 (8)
In which t is the year, n is the number of major trading partners of Vietnam,
and 1 is the shared volume of foreign country i’s traded goods and services
compared to Vietnam’s total trade at time t.
Although this approach saves a lot of estimating efforts due to its simplicity,
it contains three major weaknesses. Firstly, the issue of choosing the base year is a
complicated task and therefore it must be considered carefully. Secondly, the
assumption that mentioned about the unchanged equilibrium real exchange rate is
3
In this research, to obtain visual illustrations, the misalignment equation (7) is applied reversely. Hence, a
positive result presents an overvaluation, while a negative result presents an undervaluation.
11
seriously criticized. Thirdly, this approach contains few of variables that can explain
the real exchange rates’ movements. Hence, this approach does not capture changes
from macroeconomic events. These drawbacks lead to the needs of alternative
estimating approaches which are presented later.
2.3.2 The Fundamental Equilibrium Exchange Rate
The general equilibrium approach provides the equilibrium exchange rate by
establishing the single equation between the real exchange rate and several
fundamental macroeconomics factors. Specifically, the equilibrium exchange rate
obtained from this approach, is compatible with a certain set of fundamentals over
the medium to long run.
The FEER model, the best known one in this approach, was introduced by
Williamson in 1994. According to Williamson (1994), FEER is the equilibrium
exchange rate that satisfies both internal and external balance simultaneously in
medium run. By definition, the term “medium run” specify the period when output
reaches its potential level. Edwards (1989), Williamson (1994), and Elbadawi
(1994) pointed out that internal balance refers to a situation when an economy runs
at full-employment level and its price level is stable; and external balance implies a
condition when current account is at sustainable position over a medium run. The
term “sustainable” indicates the state in which all fundamental factors have impacts
on either internal or external balance, achieve their steady state level (Montiel,
1999). Because of the difficulty in identifying the value of potential output, it is
assumed that internal will balance when external balance is obtained.
Unlike relative PPP approach, the equilibrium exchange rate estimated by the
general equilibrium approach is not necessarily constant. The advantage of this
approach (FEER and DEER) is that it contains more variables which can explain the
movements of equilibrium exchange rate. This approach clearly exceeds the relative
PPP based approach in terms of the number of exchange rate determinants.
However, it has two main limitations. First, this approach is based on normative
12
assumptions about internal and external balances. Indeed, it is said that the term
“internal balance” is likely a controversial definition. Moreover, the external
balance condition is criticized because the assumption about the “sustainable value”
of current account is totally subjective sensation. Hence the level of currency
misalignment which is estimated by FEER method is possibly incorrect (Rajan and
Siregar, 2006). Second, this approach requires enormous data. However, in
developing countries like Vietnam, macroeconomic data are scarce and limit in
several sectors. Therefore, this approach is clearly inappropriate in order to estimate
the equilibrium exchange rate in this research.
2.3.3 The Behavioral Equilibrium Exchange Rate
2.3.3.1 Overview
The BEER approach is defined by Clark & MacDonald (1999). This
approach sets an equation that combines the real exchange rate with a set of
macroeconomic fundamentals. The equilibrium real exchange rate is estimated by
investigating that equation. The BEER approach’s foundation is based on the theory
of uncovered interest rate parity (UIP):
5(
In which: In period (t), 5 (
6
6
)−
= $ − $∗
(9)
) is the expected value of the nominal exchange rate
for period (t+1). $ , $ ∗ are the domestic and foreign nominal interest rates,
respectively4.
We can transform the nominal interest rate in the equation (9) into the real
interest rate by subtracting the expected inflation differential for both sides:
5(
4
6
)−
= 7 − 7∗
(10)
The full equation is89 (:96; ) − :9 = <9 − <∗9 + > . The term> , the risk premium, is assumed to be zero.
13
In which: In period (t), 5 (
6
) is the expected value of the real exchange rate for
period (t+1). 7 , 7 ∗ are the domestic and foreign real interest rates, respectively.
The equation (10) can be written as below:
=5(
6
) − (7 − 7 ∗ )
The BEER method assumes that term 5 (
6
(11)
)is settled mainly by a set of
macroeconomics fundamentals (? ). Therefore, by applying the BEER approach,
the relationship between the equilibrium exchange rate (
@
A
) and fundamentals
can be expressed as below:
@
A
= B(? , (7 − 7 ∗ ))
(12)
2.3.3.2 The construction of Behavioral Equilibrium Exchange Rate
equation
The set of macroeconomic fundamentals (? ) is mentioned in various studies.
Montiel (1999) classifies the fundamental variables into different categories: (i)
monetary policy (e.g. domestic credit), (ii) commercial policy (trade openness), and
(iii) the international economic environment (e.g. terms of trade, capital flows).
Following this approach, this set contains five explanatory variables, namely,
net foreign assets (NFA), trade openness (OPEN), terms of trade (TOT), and foreign
direct investment (FDI). However, the dependent variable is replaced by
multinational real exchange rate (REER) instead of bilateral real exchange rate (Q).
To examine Vietnam’s equilibrium exchange rate, this research will follow
the BEER approach from Montiel (1999) and Jongwanich (2009). For that reason,
the final equation is:
D55D @
A
= B(EFG , HI , J 5E , KJK , FHL , (7 − 7 ∗ ))
(13)
The next part will discuss more about the relationship between dependent
variable (REER) and other explanatory variables.
14
a. Net foreign asset (NFA)
In various empirical studies, it is claimed that the impact of NFA on REER is
ambiguous and the sign of this variable is different in spectacular research cases. On
the one hand, it is expected that there is a negative relationship between REER and
NFA. MacDonald & Ricci (2004) states that an increase in NFA will improve
income and increase aggregate demand. Consequently, it leads to an increase in the
price level and the result is a decrease (appreciation) of REER. In brief, NFA has
negative impacts on REER.
On the other hand, there are several cases that present the positive
relationship between NFA and REER. Empirically, Burgess, Fabrizio, & Xiao
(2003) found that empirical evidence when examining the equilibrium exchange
rate in Baltic’s countries within 8 years from 1994Q1 to 2002Q1. They argue that
result happened because of two reasons. Firstly, in several countries, the
significantly growing external debt (decreasing NFA) could be financed by trade
surpluses which are achieved by depreciating REER in the long run. However, in
the transitory position, an increase (decrease) in NFA may accompany by an
increase (decrease) in REER. Secondly, changes in risk premium may affect the
relationship between REER and NFA. A fall (rise) in risk premium would decrease
(increase) the size of trade surplus which is needed to finance external debt. As a
result, in some special cases, it is expected to have positive relationship between
REER and NFA.
b. Financial development (FD)
Domestic credit (DC) is a proxy for financial development. DC increases
when the central bank applies an expansionary policy. This leads to a pressure on
domestic prices, thus increasing imports, worsening current account, and causing
the REER to increase (depreciate). Therefore, it is expected that there is a positive
relationship between DC and REER.
15
c. Trade Openness (OPEN)
Trade openness is utilized as a measure for commercial policy. The impact of
trade openness on REER is also ambiguous. According to Edwards (1994) &
Elbadawi (1994), an increase in trade openness means that trade operation is more
liberalized; tradable goods have cheaper prices and better quality. This leads to a
substitution from non-tradable to tradable goods, then it worsens trade balance and
increases (depreciates) REER. Therefore, trade openness is expected to have
positive relationship with REER. On the contrary, Maeso Fernández, Osbat, &
Schnatz (2006) claims that in case of an economy enjoys growth and increases its
trade activities but still applies protection instruments, REER will decrease
(appreciate) when trade openness increases.
d. Terms of trade (TOT)
Terms of trade is considered to have ambiguous effects to the REER. In
theory, terms of trade has both income effects and substitution effects on REER
(Edwards, 1989). The income effects lead to depreciation while the substitution
effects cause appreciation. Therefore, the final effect of the terms of trade on REER
depends on the reality of each country.
e. Foreign Direct Investment (FDI)
In many studies, it is said that financial globalization is one of important
factors which affects real exchange rate. Xing & Zhang (2004) used FDI as a proxy
of financial globalization when they researched the income disparity in the China’s
economy. In terms of estimating equilibrium exchange rate, Frait & Komarek
(2001) has also used FDI, which is a proxy of financial globalization, as an
exchange rate determinant. Hence, in this research, FDI is also used to represent the
role of financial globalization to REER. The relationship between FDI and REER is
clearly negative. Indeed, Elbadawi (1994), and Frait & Komarek (2001) claim that
an increase in capital inflows will appreciate real exchange rate.
16