Maginal price of urban flooding in ho chi minh city
Bạn đang xem bản rút gọn của tài liệu. Xem và tải ngay bản đầy đủ của tài liệu tại đây (1.22 MB, 55 trang )
UNIVERSITY OF ECONOMICS
HO CHI MINH CITY
VIETNAM
ERASMUS UNVERSITY ROTTERDAM
INSTITUTE OF SOCIAL STUDIES
THE NETHERLANDS
VIETNAM – THE NETHERLANDS
PROGRAMME FOR M.A IN DEVELOPMENT ECONOMICS
THE MARGINAL PRICE OF URBAN
FLOODING IN HO CHI MINH CITY
BY
VO LE MINH PHUONG
MASTER OF ARTS IN DEVELOPMENT ECONOMICS
HO CHI MINH CITY, December 2017
1
UNIVERSITY OF ECONOMICS
HO CHI MINH CITY
VIETNAM
INSTITUTE OF SOCIAL STUDIES
THE HAGUE
THE NETHERLANDS
VIETNAM - NETHERLANDS
PROGRAMME FOR M.A IN DEVELOPMENT ECONOMICS
THE MARGINAL PRICE OF URBAN
FLOODING IN HO CHI MINH CITY
A thesis submitted in partial fulfilment of the requirements for the degree of
MASTER OF ARTS IN DEVELOPMENT ECONOMICS
By
VO LE MINH PHUONG
Academic supervisor:
Dr. PHAM KHANH NAM
HO CHI MINH CITY, December 2017
2
Abstract
This study applies hedonic price function to estimate the effect of urban flooding of Ho
Chi Minh city. Instead of using the sale price, this study alternatively uses the rental price
from three commercial banks located in Ho Chi Minh City as the dependent variable. The
explanatory variables are structural characteristic, locational characteristic and flood risk
existence. The result shows that the structure of house has positive correlation with the rental
price, the location of real estate gives the negative effect on rental price and the flood risk
existence makes the rental price decrease. As the result of this, the marginal price of urban
flooding of Ho Chi Minh City is -8,570,172 Viet Nam Dong in mean value of variables.
Chapter 1: Introduction
1. Problem statements
Ho Chi Minh City (HCMC) is the biggest flagship economic center of Vietnam and
plays the role as an important marine transit station of the South East Asia. This city has such
a rapid population growth rate and urbanization development that make it a promise land in
the view of labor force from other provinces (Kontgis et al., 2014). The increase of
population and market economics has been causing an enormous pressure to the antique
French colonial infrastructure in many aspect of the housing need, the garbage disposal
solution, the adaptation of drainage system, the transportation, the education, the standard of
living, etc. To relieve this pressure as well as broaden the city, the authorities approved for
many short term and long term projects, such as constructing many new houses, apartments
and buildings, widening and zoning the existing streets in corporate with opening the new
ones, bulldozing the rivers to supplement land resources, creating more jobs through
licensing many industrial parks and production factories, etc.
Unfortunately, the old drainage systems are not renovated in a compatible way yet so
that it is widely believed that solutions for Ho Chi Minh’s infrastructure conversely give the
additional bad effects to the significant flooding condition of some low elevation areas of the
city besides the well-known natural causal of high tides and climate change. This synthetic
flooding risk is considered as an environmental factor affecting the people’s lives, trading
and production activities.
3
In the record of Steering Center of the Urban Flood Control Program of Ho Chi Minh
City, in recent centuries, this city usually faces with the large-scale floods especially in the
rainy season from June to October of each year in corporate with the annual highest tide
peaks from October to November. The high intensity rainfalls with enormous water level
cannot drain quick enough through the old and overloading drainage system of the city make
huge desperation for its citizens. A research of Committee of Ho Chi Minh city’s government
in 2012 alerted that the average affected area by flood of city is 5.944 hectares with nearly
700.000 inhabitants. It is obviously that the flood risk in Ho Chi Minh City has caused a very
serious impact and damage for the living and wealth of citizens so that it becomes the most
concentrating subject in mainstream media channels as well as government programs.
After each flood event, people tend to give scattered complaint about the damage of
wealth as well as the waste of time and efforts to overcome the flooding situation with taking
inadvertently no notice of the long-term damage of flood risk which is expected to be more
serious than the short-term one.
This research will capture the long-term effects of flood risk as the foundation for
estimating the marginal price of flooding in Ho Chi Minh City which is so-called the
willingness to pay for avoiding the flood risk with the application of a traditional and popular
methodology for capturing the effect of environmental factors: the hedonic price function.
The Hedonic Price Function is established on the price of real estate. However, in the lack of
real house selling price data of Vietnam real estate market, this research examines the
variability of rental price of properties in Ho Chi Minh City with the presence of flood risk
beside the structural and locational attributes of the houses. The rental price is also a
transaction price. This transaction price is better than sale price since it often reflects the
market equilibrium price while sale price is often not equilibrium price since buyer and seller
tend to hide the real price. The rental price is considered as an accordant proxy for value of
property instead of the house price.
2. Research objectives:
The study aims to estimate the marginal price of urban flooding in Ho Chi Minh city. By
using the hedonic price function, this study will reveal the relationship between the value of
properties and theirs physical and locational characteristics which incorporate with the urban
flooding condition of Ho Chi Minh City.
3. Scope of the research
4
This research is executed on the data of rental price of three commercial banks in Ho Chi
Minh City collected in the period from January to March 2017. These banks have the
enormous physical network of branches that spread all over the city.
Beside the important characteristics of structure and location of real estate, flood risk will
become another essence element that affects to the value of properties. The initial hypothesis
of this research is that the flood risk may give a negative effect on the rental price of
properties which is located in and surround the flooding affected areas.
4. Structure of the thesis
This paper is constructed as follows. Chapter 2 is the literature review about the
empirical research of house price and the effect of flood risk. After that, chapter 3 mention
about the methodology and the data. The research result and discussion will be presented in
chapter 4. Finally, conclusion will come in chapter 5.
5
Chapter 2. Literature reviews
1.
Empirical studies of real estate (house) price
In literature, there are many research about the real estate (house) price and its
influencing factors. According to Oxford English Dictionary Online, real estate is defined as
“property consisting of land or buildings”. Nevertheless, it is widely accepted that the price
of house has to comprise the value of land where the house is built in, the cost of housing
construction and other added tangible and intangible costs. Glaeser et al. (2005), indeed,
stated that the increase of house price has been caused by the increase in construction costs,
the price of land and the “price” of certificate for building a new house. Similarly, Grimes
and Aitken (2010) emphasized that the housing supply is significant affected not only by the
cost of house and cost of construction but also by the value of land. Kamal et al. (2016)
generally summarized that the house price is mainly affected by land, location,
macroeconomic factors, demographic factors and industry factors. Coming after the previous
research, the targeted real estates in this thesis will be defined as aggregate properties that
include lands, the houses attached to lands as well as other related factors. The next parts will
mention about the factors that give effects to the fluctuation of real estate price.
Buying a house can be considered as a residential investment or just an ordinary
contemporary investment to resell in future to gain the profit. As the result of this, the buyers
of houses are usually classified into two groups: the first group buy houses for consumption
purposes and the second group buy houses for investment purposes (Glzindro, 2008).
Because the nature of real estate is an ownership transferable goods so that its price is
believed to be influenced mostly by the demand – supply rule. In other words, when the
disparity happens between the house buyers and house sellers, the price of house will
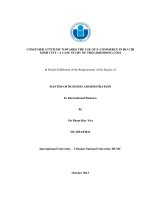
fluctuate consequently. Figure 1 generally described the factors that affect to the house price
under the view of housing demand and supply.
In the demand side, Mourouzi Sivitanidou (2011) proposed a theory that the consumers
would be induced to own a house by the basic residential demand caused by the increase of
population and employment, the growth rate of household formation, the development of
household income, the relative price of buying a house in compared with renting price and
the expectation of citizens about the prospective reselling price in the future. All these factors
are considered to be positively correlated with the real estate demand. This theory is quite
6
similar to the statement of Hofmann (2004) that the macroeconomics determinants such as
“economic growth, inflation, interest rate, bank lending and equity price” play an important
role in explaining the fluctuation of the house price. Firstly, the effect of population and
employment growth expressed through the fact that the demand for a fixed own-occupied
residence will become to be more essential when the city is gradually crowded with
employees from other places.
MacDonald (2011) who had practically analyzed the Malaysia population growth rate,
the migration and retire condition of citizens implied that those demographic factors made
the housing demand in Malaysia increase significantly. Likewise, a projection report of
Council, M.M.A.P (2014) of Metro Boston estimated that when the household size is reduced
by the larger number of single family, the increasing number of divorces and the fewer
children in one American family, the quality requirement of housing units up to 2040 will
increase 10% in compared with the present demand. Furthermore, urban centers tend to
attract the labor force from other regions which is believed to make the demand for house
increase.
Besides, Voith (1999) proved that the house price in market will increase when
employment grows but this phenomenon varies according to the characteristic of this growth.
Specifically, the fragment growth of job will only make the price of land and new houses in
suburban region increases while the concentrated job growth, on the contrary, will give
positive effect on the price of existing houses. Secondary, the household formation rate has a
very important impact on housing demand because each household essentially need a house
to shelter. The preferred consumption trend of young and single household is to rent house
while the married people usually want their family to be settled down by owning a house. As
the result of this, the high household formation rate will cause the demand for housing
increase.
Smith (1984) had examined the phenomenon of increasing in number of household of
United States up to 150 percentages in period of 1961 – 1983 claimed that this increase of
households made the housing demand go up because every household tend to occupy a house
for their living, Flavin and Yamashita (2002) also showed that the demand of people to own
a private house depends increase with the rate of population growth and household
formation. Besides that, these authors mentioned that the income of people also gave effect
on housing demand. The third element is the change in real household income and
7
innovation in financial market and economics. Actually, when the income of family is
increased, they can obviously afford to the house price in the market which induces the ownoccupying housing needs upward.
Hashim (2010) proposed that the increase of household income would give positive
effect on the family ability of paying financial debt which made the purchasing power as well
as the housing demand increase. Besides, it is widely recognized that the innovation of world
financial organization and fluctuation of interest rate give the great advantages for many
subprime individuals to enter the owned-occupied housing market through credit activities
using the houses as collateral.
This fact is supposed by Hornstein (2009) to make the demand for housing increase
which consequently pushes up the price of real estate. The empirical research of Glaeser et
al. (2010), however, notified that the effect of low interest rate on the change of house price
is very small when it could only explain for one-fifth of the house price increase. Next, the
expectation and preferences of consumers is the fourth factors that makes the house price
changed. The price of occupying a house gives consumers the information about the amount
of money which have to paid for their dream house. When consumers expect that the house
price will go up in the future, they will be induced to buy houses to take the best price at
present. Similarly, if the rent fee is intended to be increased in the near future and becomes
more asymptotic to the house price, the trend for occupying a private house is obviously in
dorminance. Hashim (2010) found that these expectations lead to the increase of speculative
activities which in turn creates a pressure to make the own-occupied housing demand go up
in Malaysia market.
8
Supply side
Demand side
Figure 1. Factors affect to house price under the view of housing demand and supply
(Moore and Goodman, 2012).
The price of renting a house is moving upward because of high housing demand of
increasing population in big cities, it is supposed that there is a transformation in consumers’
trend from renting a house with expensive price to contrive to own a private house with an
equivalent price. In this case, the high annual rent fee relative to the occupying price of
monthly payment plays an important role in inducing people to own a private house.
Nevertheless, Hargreaves (2002) concluded empirically that the rent gives little effect on the
house price in New Zealand and the house price is mostly affected by non-financial
determinants of demographic opinion and traditional conception. Similarly, Reed and
Greenhalgh (2002) examined the Australia real estate market and captured the point that the
increase of house price will be controlled if there is a surplus in stock of houses and the
9
unsteadiness neighbors created by the rental activities. In aspect of consumers’ preferences,
beside the traditional positive effect of type of houses to the price, Van Weesep (2000) and
Bryant & Eves (2011) also concluded that location of land where the house is situated
significantly affects the house price by the surrounding infrastructure, facilities and services.
If owner-occupiers have chosen the suitable area for their preferences such as locating in
frontage of the street, adapting to life enjoyment, entertainment, demographic characteristics,
memories, chances for studying or environment, etc. which bring them enough amount of
willingness to pay for the amenities, their perception about the land value which is expressed
through the price of the land will become higher, and vice versa. Obviously, it is absolutely
suitable when a house that is near to school, hospital, supermarket, bus station, restaurant,
cinema or other common facilities has a high sale price. Hilber and Vermeulen (2016)
echoed that the difference in preferences of buyers about amenities surrounding a location is
an important factor to determine the price of land. It is noticeable that their research found no
significant effect of land elevation on the house prices-earning elasticity which is one of the
most concern determinant of climate change. However, the impact of dis-amenities around a
house such as waste, flood risk or pollution area also give a negative effect on the price of
land as well.
Sivitanidou (2011) also noticed that another important group of determinants could
affect house price in the view of the supply side of real estate. The supply of real estate is
simply the market ability to afford quantitatively to real estate demand which expresses
mainly through the new housing construction, “expectations regarding demand/rents/prices
(myopic or adaptive) and uncertainty and risk (volatility of local economy and real estate
market) “. Initially, the new housing construction is defined as the completion of constructing
a house in accordance to the approved design of authorities and qualification standards as
well as having the final certificate of house. There are many determinants that give effect to
the new housing construction. The important determinants are land cost and construction cost
which includes materials and labor. Theoretically, these elements are considered to give the
negative effect to the availability of new houses in the market because when the availability
and price of labor, land or materials increase, it is absolutely made the cost for completing
the construction project increase as well. As the result of this, the profit of investors will be
lower which make their motivation of producing more new houses in the future become
downturn, then, the supply resources of house will decrease as well.
10
Carliner (2003) analyzed the data of the National Association of Home Builder (NAHB)
of United States of America in 2001 and indicated that the cost of land, the total cost of
materials and the cost of labor, respectively, accounts for 24.6, 30.6 and 21.8 percent of the
final sale price of house. However, Page (2008) found that the land value is the largest
affective component of house price, the second affective component is the construction
materials while labor cost is the smallest one. The land is commonly known as a scarcity
natural resource in condition of the continuous increase of world population. In the housing
literature, land is defined not only the area of the base floor of the house but it also contains
the intangible values of frontage location, ease to access, surrounding amenities, culture,
distance to work office, schools or entertainment center, etc. Davis and Heathcote (2007)
argued that land is a housing component that is impossible to reproduce or replicate while the
structure of the house is very simple to reproduce as long as technology and capital are
permitted so that the price of existing houses in the United States have been growing less
than twice in compared with the price of residential land in period 1970 – 2003.
In Asia, Teck Hong (2013) also proved that the scarcity of city land resource which had
caused by increasing population and urbanization would give a negative effect on the cost of
house significantly. Beside the true value of land due to scarcity, the zoning of land is also a
significant element in most countries and territories in the world. Although a land is perfect
in both location and amenities, it will be useless if it is situated in a non-permit construction
area. In case of locating in a restricting construction zone, the new housing developers have
to give much of their efforts in both physical costs and time to gain the construction
permission. Glaeser et al. (2005) figured out that the zoning and permission for construction
in America can make the cost of constructing a house increase which consequently makes the
house price increase.
Besides, the cost of materials is also a key determinant in forming the new construction
house price. The construction materials include sand, stone, gravel, cement, brick, gypsum,
glass, steel, paint etc. The material price is quite different among countries because of the
limitation in natural resource reserves of those countries. The lack of self-production
materials makes the demand for importation and exportation of construction materials
become more necessary so that any positive fluctuation in the price of oil, the price of power
or the exchange rate can cause the cost of materials to be moved up as well. Witnessed the
violent fluctuation of materials price from 15 to 30 percent in period 2006 – 2011,
11
MacDonald (2011) claimed that the high price of new houses in Penang – Malaysia primarily
comes from the developers’ purposes of retaining their earning ratio in defensing to the high
prices of construction materials.
The third essential element that affects to the new construction house price is the labor
cost. A house will not be constructed completely without the man power because the
construction process can only execute in some steps by mechanic. Page (2008) showed that,
in New Zealand, since 2004 the cost of labor in construction field had increased with the
fastest speed than others which contributed to the high price of new construction house.
Similarly, San Ong (2013) mentioned about high quality construction engineers as high –
house –price- causing factor.
Under fundamental law of supply – demand, the optimal house price is determined in
equilibrium status. The imbalance of demand and supply which can be caused by asymmetric
information, construction lags or long-term leases will make the house price change
relatively. Hargreaves (2008) proved that the house price is driven by the housing rental
price. As the result of this, the equilibrium status between housing supply and demand would
affect not only the house price but also the house value, generally, which include both the
house selling price and house rental price. This paper will examine the variation in the
housing rental price instead of the house price because the real transaction price of houses
has no chance to be found in Viet Nam real estate market.
2.
Empirical studies about the effect of flood risk on house value
It is obviously that identification and well-preparation for facing risk are important
solutions for lowering the impact of a hazard. Flood is a natural environmental hazard.
Indeed, Haraguchi and Lall (2013) investigated the case of Thailand’s 2011 flood and found
that although the whole Thailand economy was destroyed badly by the flood, the level of
damages of each company belonged to their cognition and preparation for this recurrent
hazard. For example, Nissan factory in Samut Prakan Province only needed 29 days to
recover its production activities while Honda factory in Rojana Industrial Park needed 179
days to return to its usual production procedure. Because of the importance of avoiding flood,
literature have many related research about this topic.
After the Hurricane Floyd passed North Carolina, United States of America with huge
rainfalls in 1999, Bin et al. (2004) applied the hedonic price function to capture for the
12
variation of 8,375 residential houses’ value which is located around the floodplains from
1992 to 2002 in Pitt County, North Carolina. The dataset is formed from the houses’ sale
price, the location of properties in and out of floodplain map and the Pitt County GIS data.
By using least squares analysis regression with the dependent variable is natural logarithm of
the sale price of properties, the independent variables of house attributes and the dummy
variable of houses’ location in compared with floodplain map, the authors proved that the
price of house that located inside the floodplain is lower than the price of house that located
outside the floodplain with the difference of 5.7 percent on average. To correct for the
implicit heteroskedasticity, those authors used White’s test. After that, the regression result is
used to calculate for marginal effect of flood risk by multiplying the coefficient of flood risk
and the mean value of sale price. With the coefficient -0.057, the flood risk coming from the
location of house inside the floodplain made the sale price of houses decrease 7,463.14$.
To consolidate their 2004’s result, Bin and Polasky (2008) re-applied hedonic price
function to the data of sale price of coastal residential properties in Carteret County, North
Carolina from 2000 to 2004 with the combination of the sale price of house from the Carteret
County Tax Office, digital flood risk map of this area from the North Carolina Floodplain
Mapping Program and some GIS data. Beside the housing characteristics likely to their
research in 2004, to avoid for bias caused by spatial dependence between houses in the same
area, the authors additionally designed a spatial weight matrix with the value “1” if the
distance between two properties is under 325 feet, otherwise is zero. The result of Bin’s 2008
research is similar to the 2004 when found out the significantly negative relationship between
the flood risk hazards and the sale price of house. The price of house located out of the
border of floodplain was higher than the one located inside the floodplain with the
differential of 7.3 percent on average, or $11,598. Similarly, in paper “Flood and residential
property values: a hedonic price analysis for the Netherlands”,
Daniel et al. (2009) examined the fluctuation of transaction house price of Netherlands in
period 1990 – 2004 of 9,505 observations in the dataset of The Dutch Association of Real
Estate Brokers and Real Estate Experts which include 50 percent of single-family houses and
50 percent of apartments with the flood hazard caused by high tides of Meuse river – a main
river that flows through France, Belgium and Netherlands. The methodology of the research
is also the ordinary least squares with semi-log specification. The research has the same
expected sign in aspect of square meters (+), average income per habitant (+), distance
13
entrance to high way under 4500m (+), index of rurality (-), distance to river under 500
meters (-), distance to highway under 500 meters (-), flood anytime (-). The research verified
that the house price was really impacted by the flood hazard caused by high tides of Meuse
with the 9 percent decrease of house price. However, the flood also brings back some
significant effect on the house price with 3 percent increase for a house that is located under
500m from the river because of the amenities of the river. These authors concluded that the
synthetic effect of the flood hazard of Meuse river is – 6 percent which includes 9 percent of
negative effect plus 3 percent of positive effect.
Each research concludes with a different implicit price of flood risk so that another paper
of Daniel et al. (2009) applied the meta-regression to the result of 19 previous hedonic
research of United States’ flood to examines for the significant and momentous level of
implicit price of flood risk. The research revealed that “the marginal effect of an increase in
the probability of flood risk of 0.01 in a year amounts to a difference in transaction price of
an otherwise similar house of –0.6 percent”. Moreover, the meta-analysis of Daniel gives a
contrary conclusion to previous research when supposed the positive effect of house location
that is near the river may be an interference for negative effect of flood risk. As the result of
this, the synthesis effect of location of house that is near the river do need some further
research.
In the same way, Samarasinghe & Sharp (2010) applied hedonic price function in semilog functional form to the 2000 residential housing transactions in housing market of North
Shore City, New Zealand in 2006. Besides, these authors also tried to capture for the value of
public information about the risk of flood. The dependent variable is the residential sale price
with 2241 real transaction observations during 2006, the independent variables include
structural variable, environmental variable, flood variable, neighborhood variable and
locational variable. The research applied ordinary least square to examine the spatial
autocorrelation, and then, the Lagrange multiplier form was applied to test for the robustness
of model. In regression model, there is the presence of spatial weight matrix. The result
suggested that the value of flood risk in the perception of the house’s buyers comes from the
disadvantages of flood area which caused by the public information and buyers tend to add
this value of risk in to the house price if they have no insurance. As the result of this, when
the information about flood is announced public, the discount for houses locating in the
14
floodplain is reduced. Besides, likely to the previous research, the sale price of a house
locating inside the flood area is significant lower that the one locating outside.
In sum, the flood risk is believed to give negative effect to the house value through
previous research results. In this paper, the author tries to verify this hypothesis in the
scenario of Vietnam real estate market.
15
Chapter 3: Research methodology and data
1.
Methodology of hedonic price function
In literature, the hedonic price function is a popular methodology to measure the price of
real estates based on their physical location and spatial amenity characteristics. In 1961,
Griliches applied the hedonic price function for United States automobiles market by
“deriving implicit specification prices” and using these prices to pricing the quality changes
in specifications of some automobiles. Sketched out in more details by Rosen (1974), this
hedonic price model was widened in capturing the market values of different characteristics
of disparate products which implies the viewpoint that when properties are looked into by a
set of their specialties, the market price will reflect the comparative basing on those attributes
as well.
Since then, there are substantial number of research in literature that applied the hedonic
price function to examine the effect of both the amenities and dis-amenities of environment
determinants on the land prices. People tend to discomfort about the environmental risk and
willing to pay for avoiding this bother (Fisher et al, 1991) so that the hypothesis of disamenities environment is that it would give a negative effect on the properties’ price while
amenities environment can make the price of land increase. Farber (1998) examined the
effect of undesirable land uses in many states of America and recognized significantly that
these dis-amenities really reduced the value of surrounding properties.
Similarly, Deaton (2002) tried to observed the house prices surround hazardous waste
sites in the industrial zone of Lansing City, MI with the same hypothesis of dis-amenities
environment. However, the insignificant result between hazardous waste in high activity
industries and the surrounding house prices gave a new point that the bad effect of these
hazards might be overstated because the industries had cleaned-up the waste.
Looking in the other side, Kong et al (2007) used hedonic price function to estimate the
effect of urban green space in Jinan City (China) on the properties’ prices. The result is quite
compatible to the hypothesis because it proved that the urban green space has a positive
effect with the surrounding house prices. Within 300-meter radius around the urban green
space, the house prices tend to be higher with 2.1% adding value relative to one percentage
point of more green space.
In the same way, Tapsuwan et al. (2009) researched about the value of urban wetland in
Australia and found out another satisfactory result that the nearer distance from the properties
16
to the wetlands are, the higher sale prices that properties have. Differing from the rest,
Schlafer et al. (2008) examined the variation in rental price of Switzerland with the presence
of amenities and dis-amenities existing surround the properties. The result is quite similar to
other research when those authors figured out that the amenities give positive effects on the
rental price while the presence of dis-amenities is negatively correlated to the change of
rental price. Following to this research, this paper will observe the relationship between the
flood risk of Ho Chi Minh city and the properties’ rental price.
To capture the effect of flood risk in Ho Chi Minh city, the hedonic property price
function with the ordinary least square regression (OLS) is applied as below:
Ln(Rental-Pricei) = + j Sji + k Lki + l Fli + I
(1)
Rental-Price i is the monthly price for renting a house i in Ho Chi Minh City. This rental
price is recorded in millions of Viet Nam Dong in the Quarter 1 of 2017 and is extracted
from the data of leasing contracts of some Vietnam commercial banks located in Ho Chi
Minh City. This variable is designed in natural log form to fix the implicit heteroskedasticity.
Sji is the structural variable of the houses which includes total rental area in square meters,
the size of façade in meters and the kind of properties - a dummy variable with “1” if the
rental area is located in a building and “0” if the rental area is normal resident house.
Lki is the locational attribute of the properties which includes the distance from the properties
to the center of Ho Chi Minh City, the distance from the properties to the center of each
districts and the elevation of properties over the sea level. These distances are calculated in
kilometer while meter unit is applied to the elevation. The Independence Palace – the most
famous historical site in Center of districts 1 – is chosen as the Center of Ho Chi Minh City
while the center of each districts are chosen as the center of the streets where the land sale
prices are highest according to the annual announcement of Government.
Fli is the flood risk attributes of area that the house is located which includes the number of
flood hotspots in radius of 0.5 km surrounding the properties and the dummy variable of
flood risk existence around properties. I is the error term. The detail about the variables and
their hypotheses are summarized in Table 1 and Table 2. To test for the normality of the
model, the Shapiro Wilk test is applied. Besides, to make the OLS regression to be BLUE,
the White’s test is also executed.
17
Table 1: The description of variables
Variable
Unit
Description and hypothesis
Dependent variable
Rental Price
Million
VND per
total area
The rental price of houses recorded in millions of
Viet Nam Dong in the Quarter 1 of 2017.
Independent variables
Structural attributes
Rental Area
Square
meter
Total useable area of a house in square meters
calculating by multiplication the length and width
and the number of floors of the house.
Façade size
Meter
The width of the frontage of the house calculating in
meter unit.
n/a
The dummy variable of housing condition (“1” if the
rental area is located on the buildings with high-class
infrastructure, “0” if the rental area is located on the
resident houses with normal-class infrastructure.
Kind of properties
Locational attributes
Distance-To-Palace
The distance in kilometer from each house to the
Kilometer Independence Palace – a famous historical site in the
Center of districts 1.
Distance-To-Center of
Districts
The distance in kilometer from each house to the
Center of Districts. The center of each districts are
Kilometer chosen as the center of the streets where the land sale
prices are highest according to the annual
announcement of Government.
Elevation
Meter
The elevation of properties in compare with the sea
level in meters.
Flood risk attributes
The number of flood
hotspots surround.
Flood risk existence
Hotspot
n/a
The number of flood hotspot in radius of 0.5 km
surround the properties.
The nearest distance of properties to the flood
hotspots implies the flood risk existence. It is in
dummy kind with “1” if the nearest distance from
house to any flood hotspots is lower than 1 kilometer
and with “0” if otherwise.
18
Table 2: The expected effects on rental prices.
Variable
Hypothesis
Structural attributes
The house rental price will increase if it have a larger
Rental Area
useable area than the others.
Expected
sign (*)
+
Façade size
The larger the house façade has, the higher rental price of
that house is.
+
Kind of properties
The rental area located in buildings will have higher rental
price than the resident houses.
+
Locational attributes
Distance-To-Palace
The further the distance between real estate and Palace is,
the cheaper rental price is offered.
-
Distance-To-Center The further the distance between real estate to Center of
of Districts
district is, the cheaper rental price is offered.
-
A house with a higher elevation above the sea level will
have less risk for being flooded so that it is expected to
have the higher house rental price.
+
Elevation
Flood risk attributes
The number of
When the house is surrounded by many of flood hotspots,
flood hotspots
it will have the bigger risk of getting flooded so that it is
surround.
expected to have cheaper house rental price.
Flood risk
When there are flood risk existence, the rent will be
existence
decreased.
-
-
(*) The sign +/- describes the expected positive or negative effect of attributes of real estate on the
rental price.
19
2.
Data.
The data for this research has 218 observations and includes 4 parts: the rental price, the
structural data, the locational data and the flood risk data.
Firstly, the rental price of branches of banks is collected from January to March of 2017
in Ho Chi Minh City, Viet Nam. Banks that contributed their house rental price in this data
are Vietnam International Commercial Joint Stock Bank – VIB, Vietnam Technological and
Commercial Joint Stock Bank – TECHCOMBANK and National Citizen Commercial Joint
Stock Bank – NCB. The reason for choosing the rental price of banks is firstly the stability of
the long-term leasing contract because when a bank chooses a real estate to set up a branch,
majority of their contract duration is at least five years to ensure their high investment will be
depreciated and compensated by the profit. Comparing with other short-term rent activities
such as resident need, small companies, stores…, the long-term leasing contract of banks
have outstanding advantages when the owners of banks have to consider carefully every
aspect of a real estate before deciding to invest capital. Secondary, the rental price of banks is
commercial rental price so that it tends to be considered to absorb the flood risk better than
resident purposes which is expressed quickly through rental price because of the expected
succeed of investment project. As the result of this, the commercial rental price of bank is
more suitable for examining the effect of flood risk instead of the traditional resident price.
Second, the structural data of house includes the total rental area, the size of facade and
the kind of properties. The size of façade is the dimension in meter of the frontage of a
property. This parameter is available in the data of those banks. The total rental area is
calculated by multiple the size of façade and the length of the house and the number of
floors. To classify the kind of properties, the address of rent area is used to verify on Google
Map at first. After that, the result of classification is checked practically on site to have the
accuracy.
Thirdly, the locational data includes three parameters of Distance to Palace, Distance to
Center of Districts and Elevation. The main methodology of this calculation is the usage of
Google Map incorporate with the address of each property. The Google Map is a free 2dimension map provided by Google Inc. Every point in this map has a geographical
coordinate of which includes the latitude and longitude of this point. Basing on the spherical
law of cosines, the distance between two points can be calculated by the formula:
20
Distance c = accos(cosa * cosb + sina * sinb * cosC)
(2)
= accos(cos*cos+sin*sin*cosC)*6371 (3)
In this formula, a, b and c is the length of each sides,
representatively, while C is the angle between two
longitude lines which go across points A and B. Because
the radius of our Earth is 6371 kilometers, the unit of
distance c is kilometer as well. All the addresses of houses
Figure 2. Description of
and buildings in the data is marked onto one Google map
spherical law of cosines
that is linked to private account of author to take the
geographical coordinates of each site. After that,
the Independence Palace – the most well-known historical site of Ho Chi Minh City in
majority of citizens’ recognition – is selected as a nominal site in the heart of the city and
marked onto the same Google map to calculate the distance each branch of banks. The link of
this map is available at the references. It is named as House – Flood risk map as shown in
Figure 3. From the coordinates of 218 points of banks’ transactions and Independence
Palace, the author applied formula (3) to calculate for the distance from each points to the
Independence Palace. The result of this mathematical work is the Distance to Palace
variable.
Similarly, The Distance to Center of Districts are also calculated as above
methodology. The choice of center area of each district of Ho Chi Minh city bases on the
average sale price of land in the most crowded street of each district. Annually, the
authorities - People Committees of Ho Chi Minh City – usually announce the Decision of
sale price of land in each route of districts. The routes that have highest sale price of land as
government announcement are considered as the center routes of districts. Totally, 19 center
areas of 19 districts are chosen as the middle point of the center routes. In this research, the
Decision of Ho Chi Minh City ‘s Government for land price in 2015 is used. The centers of
districts are marked onto the House – Flood risk map as well to take the geographic
coordinates of each center. From the coordinates of 218 banks’ transactions and 19 centers of
districts, the author applied formula (3) to calculate for the distance from each points in each
district to the middle location of that district. The result of this mathematical work is the
Distance to Center of Districts variable.
21
The last variable in group Locational data is the Elevation. To measure the
approximate elevation of each property over the sea level, the author has the help of free tool
of Topographic website. With this website, the height of every point in the world can expose
as long as we have its coordinate. Using the position of houses in House - Flood risk map
incorporates with the Topographic website, the author collected the elevation of houses,
Palace and centers of districts as well. By clicking on the Topographic map, the elevation is
appeared. The result of Topographic map is in “feet” unit so that the coefficient “0.304” is
multiplied to convert the elevation to “meter” unit. This useful link is presented in the
Appendix.
Figure 3. House – Flood risk map (self-drawing by author).
Notes: Square shape: branches of bank 1;
Oval shape: branches of bank 2;
Circle shape: branches of banks 3;
Swimming icon: Flood hotspots.
Finally, the very important contribution of this research is the data for flood risk
attributes which include The Number of Flood Hotspots Surround and the Flood Risk
22
Existence. It is very hard to collect all the flood hotspots in this city and make people to be
persuaded about the accuracy of data. Fortunately, there is a statistical and interactive
historical flood map of Ho Chi Minh City in 2016 which is collected and announced by one
of the mainstream media channel of Viet Nam’s government - Viet Nam Express Newspaper
– so that this map is worth to be trusted. There are total 59 flood hotspots area with 88
inundated routes in Ho Chi Minh City up to October 2016. The rest is simple and similar to
the locational data. From this interactive map, we can get the approximate location of flood
hotspots and continually put them on the House – Flood risk map. After that, we calculated
the distance from each house to every flood hotspot. If the nearest distance from a house to a
hotspot is lower than 1 kilometer, it is considered there is a Flood Risk Existence surround
that house. These two links are presented at the references as well. To count for the number
of flood hotspots in the radius of 0.5km surrounding the properties, we sorted out the
distances that have value under 0.5 km from calculating table. All the data of 218
observations is gather in Appendix 2. In the next chapter, the regression result is reported and
discussed.
23
Chapter 4: Results on value of urban flooding
1. Overview of the urban flooding problem in Ho Chi Minh city
Urban flooding condition has become the serious problem in Ho Chi Minh City. The
reason for flooding is considered to come from three main sources. Firstly, the old drainage
system which was designed for a city with 500,000 citizens is now served for approximately
10 million citizens and always in overload status. Secondly, this city usually inundates after
the high intensity rainfalls in annual rainy season from June to November. The old drainage
system can only afford to the rain water level of 86 millimeters while intensity of rainfall
increases in recent years (over 100 millimeters of water level). The third one is that Ho Chi
Minh City locates in the delta area of the Sai Gon River and Dong Nai River so that it also
has to suffer high tide cycles from September to December annually. The climate change
makes the ice from the Poles melt which increase the sea level. When these two natural
phenomena of high tide with high sea level and heavy rainfall incorporate incidentally, Ho
Chi Minh city has no methodology to avoid the terrible flooding condition because the high
tide has blocked the run off of urban water to the sea. Additionally, the draining water
activities from Dau Tieng reservoir and Tri An reservoir are considered to contribute to the
misery flooding condition of Ho Chi Minh City.
To resolve the flooding problem, from 2008, the government of Ho Chi Minh City has
expensed 29,000 trillion Viet Nam Dong for building the drain system for controlling the
tides; dredging and renovating the 5 big canals of Nhieu Loc Thi Nghe Canal, Tau Hu Ben
Nghe Canal, Doi Te Canal, Tan Hoa Lo Gom Canal and Tham Luong Ben Cat Canal; buil
up and renovating the drainage system; building 12 water treatment plants; renting the high
capacity water pump to withdraw the water quickly… but the result is not acceptable. In
2008, there was 126 flooding hotspots in all the city. Up to 2011, the number of flooding
hotspots were reduced to 58 sites. In 2015, there was a big progress in Urban Flood Control
Program when the number of flooding hotspot was only 23 sites. However, under the
urbanization and the booming development of real estate projects in all the city, the number
of flooding hotspots in Ho Chi Minh city increased to 59 sites in 2016. Many streets become
“river” although their conditions are non-flood before Urban Flood Control Program. In this
situation, in May 2016, The People Committee of Ho Chi Minh City approved for the Flood
Risk Management Project in Ho Chi Minh City which is sponsored by the World Bank with
24
the total investment 436.97 million dollars. The Project is believed to solve the flooding
condition and upgrade the ability of water retention and drainage of Tham Luong Ben Cat
Canal which can affect to 2 million citizens in 8 districts of Ho Chi Minh City. Initially, this
project is divided into 2 periods: Preparation period (2013 -2017) and Execution period
(2017 – 2021). However, in June 2017, the Government of Ho Chi Minh City and
representative of World Bank in Viet Nam concurred to stop the project because of the
disagreement in policy of compensation for clearance the plan. After this event, the citizens
might wait for another possible project to escape from the flooding condition.
2. Descriptive statistics
The descriptive statistics of 218 observations are expressed in Table 3. The mean value
of rental price is 80.2 million Viet Nam Dong. The average rental area is 320 square meters
while the average size of Façade of banks is 9.115 meter. In that way, the mean value of all
variables is presented in Table 3.
To detect for the multi-collinearity of the variables in the model, a correlation matrix is
designed as in Table 4. All the coefficients in the matrix are lower than +/- 0.8 which means
the correlation between independent variables is weak. This result shows that there is low
multi- collinearity in this data and model. The highest correlation coefficient is + 0.465
appears in the correlation between Flood Risk Existence and the Number of Flood Hotspot
Surround. This may be caused by the same calculating methodology basing on the element of
distance from real estates to banks’ office. The Flood Risk Existence is dummy variable and
assigned as”1” if there is under-1-kilometer-nearest-distance of properties to the flood
hotspots while The Number of Flood Hotspot Surround is calculated by counting number of
branches that have the distance from properties to flood hotspots lower than 0.5 km.
Similarly, the lowest correlation coefficient (– 0.295) is the relationship between the Distance
To Palace and Kind of Real Estate. This correlation is quite true because buildings are
usually located in District 1 and some other central districts. Low correlation coefficients do
not remove the risk of multi-collinearity but the effect is considered to give very little impact.
25