Returns to education in vietnam a clustered data approach
Bạn đang xem bản rút gọn của tài liệu. Xem và tải ngay bản đầy đủ của tài liệu tại đây (1.44 MB, 55 trang )
UNIVERSITY OF ECONOMICS
HO CHI MINH CITY
VIETNAM
INSTITUTE OF SOCIAL STUDIES
THE HAGUE
THE NETHERLANDS
VIETNAM - NETHERLANDS
PROGRAMME FOR M.A. IN DEVELOPMENT ECONOMICS
RETURNS TO EDUCATION IN VIETNAM:
A CLUSTERED DATA APPROACH
BY:
NGUYEN THI NGOC THANH
MASTER OF ARTS IN DEVELOPMENT ECONOMICS
HOCHIMINH CITY, DECEMBER 2012
UNIVERSITY OF ECONOMICS
HO CHI MINH CITY
VIETNAM
INSTITUTE OF SOCIAL STUDIES
THE HAGUE
THE NETHERLANDS
VIETNAM - NETHERLANDS
PROGRAMME FOR M.A. IN DEVELOPMENT ECONOMICS
RETURNS TO EDUCATION IN VIETNAM:
A CLUSTERED DATA APPROACH
A thesis submitted in partial fulfilment of the requirements for the degree of
MASTER OF ARTS IN DEVELOPMENT ECONOMICS
By:
NGUYEN THI NGOC THANH
Academic Supervisor(s):
Assoc. Prof. Dr. NGUYEN TRONG HOAI
Dr. PHAM KHANH NAM
HOCHIMINH CITY, DECEMBER 2012
ACKNOWLEDGEMENT
First of all, I would like to express my sincere thank to the Vietnam –
Netherlands Programme (VNP) for such a challenging but interesting programme,
whereby I enjoyed unforgettable time beside my classmates and broadened my
networking via class.
I am much grateful to famous whole-hearted professors at home and abroad for
advanced knowledge and updated information they gave us in class and beyond the
class-time. Specially, I would like to deeply thank two supervisors: Assoc. Prof. Dr.
Nguyen Trong Hoai and Dr. Pham Khanh Nam for their helpful and valuable advices
on the last but utmost duty, this thesis, that helps me fulfill my study career.
From the bottom of my heart, I always feel thankful to my Family for their daily
care, daily worries, daily happiness with every failure or achievement I get in life. I
keep looking for chances to bring them happiness.
To my C16 Classmates, I can say that two-year was a great memory when I am
with you all. Thank you for your kindness, sharing and support. Especially, I cannot
forget the enthusiastic disinterested help from Mr. Le Anh Khang – our class “Hero”
before every final exam. He has inspired and motivated me a lot. I would like to take
this opportunity to say thanks to him formally.
...Life is still ahead of us, let’s just stop a moment to celebrate our achievement
today and keep going forward afterward. I wish you all good health, happiness and
success for the coming New Year 2013. Cheers !
ABSTRACT
Moock et al. (2003) did an attempt to analyze the returns to education in Vietnam
by using Mincer earnings function based on the 1992–93 Vietnam Living Standards
Survey (VLSS) data. In this paper, I replicate the job of Moock et al. (2003) to reestimate the returns to education by using the 2008 Vietnam Household Living
Standard Survey (VHLSS) and Mincerian earnings functions, but with a different
regression method, called clustered data at household level using panel commands.
The study reveals that (1) an additional year of schooling associates with 8.95%
increasing in the average rate of return to education, comparing with only 5% in
1992/1993. In terms of gender gap, females experience higher returns to school than
males (11.47% vs. 8.33%). This pattern is unchanged when referring to result in
1992/1993 (6.8% vs. 3.4%); (2) workers in public sector get higher rates of return to
education than those in private sector (9.95% vs. 5.59%). However, foreign sector is
the one has the highest rates of return among the three, 11.9%; (3) university is the best
option for schooling investment with the rate of return of 19% higher than upper
secondary level while this number was 11% in 1992/1993. Primary level brings back
16% rate of return vs. no level (13% in 1992). The rates are 10% for vocational vs.
primary (4% in 1992); 8% for upper secondary vs. lower secondary; while only 2% for
lower secondary vs. primary.
Key Words: return to schooling, education, Vietnam, Human Capital,
Mincer earnings function, clustered data, random effect model.
1
TABLE OF CONTENTS
CHAPTER 1. INTRODUCTION ........................................................................................ 6
1.1 Problem Statement ...................................................................................................... 6
1.2 Research Objectives .................................................................................................... 7
1.3 Research Questions ..................................................................................................... 8
1.4 Research Methodology ............................................................................................... 8
1.5 Structure of the Thesis ................................................................................................ 8
CHAPTER 2. LITERATURE REVIEW ............................................................................. 9
2.1 Definition .................................................................................................................... 9
2.2 A Standard Model of Human-Capital Investment .................................................... 10
2.3 Empirical Studies on Estimating Returns to Education ............................................ 12
2.3.1 Selective Empirical Studies in the World ....................................................... 12
2.3.2 Empirical Studies in Vietnam ......................................................................... 15
2.4 Analytical Framework .............................................................................................. 19
2.5 Chapter Remarks ....................................................................................................... 19
CHAPTER 3. RESEARCH METHODOLOGY ............................................................... 21
3.1 Data ........................................................................................................................... 21
3.2 Research Methodology ............................................................................................. 23
3.3 New Approach - CLUSTERED DATA APPROACH in Estimating the Returns
to Education .............................................................................................................. 24
3.4 Empirical Models of the Returns to Education ......................................................... 27
3.5 Variable Coding ........................................................................................................ 29
CHAPTER 4. RESEARCH FINDINGS AND DISCUSSION ......................................... 32
4.1 Descriptive Statistics ................................................................................................. 32
4.1.1 Distribution of the Dependent and Explanatory Variables ............................. 32
4.1.2 Descriptive Statistics of the Dataset ............................................................... 37
2
4.2 Regression Results .................................................................................................... 38
4.3 Chapter Remarks ....................................................................................................... 43
CHAPTER 5. CONCLUSION AND POLICY RECOMMENDATION .......................... 45
5.1 Conclusion of the Study ............................................................................................ 45
5.2 Policy Recommendation ........................................................................................... 46
5.3 Limitations of the Study............................................................................................ 47
5.4 Suggestion for further Studies .................................................................................. 48
REFERENCE
3
LIST OF TABLES
Table 2.1: Empirical studies in Vietnam utilizing Mincer earnings function over the
period 1992-2008 .......................................................................................................... 17
Table 3.1: Sample of cross-sectional data ...................................................................... 26
Table 3.2: Sample of clustered data ............................................................................... 27
Table 3.3: Description of the Variables and Variable Coding ....................................... 30
Table 4.1: Descriptive statistics ..................................................................................... 38
Table 4.2: Earnings function by years of schooling....................................................... 39
Table 4.3: Earnings function by sector of employment ................................................. 40
Table 4.4: Earnings function with schooling levels (for all, males, and females) ......... 41
Table 4.5: Private rates of return to schooling by level of education (%) ..................... 42
LIST OF FIGURES
Figure 4.1: Histograms of log of earnings (by gender) .................................................. 32
Figure 4.2: Histograms of log of earnings (by sector) ................................................... 33
Figure 4.3: Histograms of years of schooling and log of hours worked/week .............. 34
Figure 4.4: Scatterplots of monthly earnings and years of schooling ............................ 35
Figure 4.5: Scatterplots of monthly earnings and education levels ............................... 36
Figure 4.6: Scatterplots of monthly earnings and years of experience .......................... 36
4
LIST OF ABBREVIATIONS
ADB
: Asian Development Bank
GSO
: General Statistics Office
IV
: Instrument Variable
RE
: Random Effect
OLS
: Ordinary Least Squares
VHLSS
: Vietnam Household Living Standard Survey
VLSS
: Vietnam Living Standard Survey
5
CHAPTER 1. INTRODUCTION
This chapter explains the context of the thesis, its objectives and research
questions. In addition, a brief of methodology is also mentioned in this part. Finally,
the structure of the thesis is presented.
1.1 PROBLEM STATEMENT
Education plays an important role in modern labor markets. Hundreds of studies
in many different countries and time periods have confirmed that better educated
individuals earn higher wage than the less-educated ones 1. A variety of studies have
been started with the seminal work by Mincer (1974) who was the first to derive an
empirical formulation of earning over the lifecycle. In his basic formulation, the
logarithm of earnings can be interpreted as years of schooling, years of experience and
squared years of experience.
In Vietnam, since the Vietnam Living Standards Survey (VLSS) firstly conducted
in 1992–93 till present, many studies have employed the VLSS data and the Mincerian
earnings function to examine rates of return to education in Vietnam, such as: Glewwe
& Patrinos, 1998; Gallup, 2002; Moock et al., 2003; Liu, 2006; Nguyen Xuan Thanh,
2006; Vu Trong Anh, 2008; Vu Thanh Liem, 2009; Doan & Gibson, 2010; etc. The
results are also diverse.
The most cite study is from Moock et al. (2003), in which the authors attempt to
analyze the returns to education in Vietnam by using Mincerian earnings function
based on the data of VLSS 1992–93. The authors find that the estimated rates of return
are quite low (4.8%). In particular, on average, the rates of return to primary and
1
Psacharopoulos and Patrinos (2002) contains rate of return estimates for 98 countries spanning more than 30
years; Trostel, Walker and Woodley (2002) contains estimates for 28 countries; Polachek (2007) contains
estimates for 42 countries; etc.
6
university education are 13% and 11%. But these rates are just 4% and 5% at
secondary and vocational levels. For higher education (colleges, universities or above),
the returns are higher for females (12%) than for males (10%).
Now, 20 years have passed, I return to the issue and question for now, what are
the returns to education in Vietnam? How have the returns changed? Especially, in
term of gender gap, between males and females who receive higher returns to
education? In term of sectoral gap, among public, private, and foreign sectors, any
discrepancies among these three? The findings are important implications for policy
makers in directing the wage and educational policies.
I would like to replicate the job of Moock et al. (2003) to answer these questions
by using the Vietnam Household Living Standard Survey (VHLSS), conducted by
General Statistic Office (GSO), in 2008 and Mincerian earnings function, but with a
different regression method which is first time applied in this kind of estimation, called
Clustered data at household level using panel commands 2, instead of using a simple
standard cross-sectional OLS estimator. From the results, I would like to suggest some
policy implications.
1.2 RESEARCH OBJECTIVES
There are 03 main objectives in this study:
(1) To estimate private returns to education by years of schooling and by levels of
schooling for both sexes, for males and females; and in private, public and foreign
sectors recently;
(2) To assess the variation in returns to education by comparing with the findings
from Moock et al. (2003);
2
Please refer to the chapter on methodology (Chapter 3) for more details.
7
(3) To propose some policy options.
1.3 RESEARCH QUESTIONS
The research questions are proposed:
(1) What are the rates of return to education by years of schooling, by levels of
education for both sexes, for males and females; and in private, public, and foreign
sectors recently?
(2) How are the rates of return to schooling different comparing with 15 years
ago? Should the rates increase or decrease?
(3) What are policy recommendations?
1.4
RESEARCH METHODOLOGY
In the study, I use the VHLSS conducted by GSO in 2008 and the Human Capital
Model developed by Mincer (1974), with the regression method so-called Clustered
data at household level using panel commands, instead of using a simple standard
cross-sectional OLS estimator.
1.5 STRUCTURE OF THE THESIS
The paper is structured as follows: Chapter 2 provides the literature review and
empirical studies over the world and in Vietnam. Chapter 3 describes the data samples
and specifies the research methodology. The results based on descriptive statistics and
econometric models are presented in Chapter 4. The last chapter comes up with
conclusion, policy recommendation, limitations of the study, and suggestion for further
studies.
8
CHAPTER 2. LITERATURE REVIEW
The first part of this chapter gives preliminary definition of main terms used in the
context. The next part comes to provide theoretical foundation for empirical research.
A standard model of human-capital investment by Mincer (1974) is introduced to
briefly explain how to form up the standard Mincerian earnings function. Some of
selective empirical studies on returns to education in the world and in Vietnam are
then recalled to summarize the empirical results found by different researchers. This
chapter also is going to build up analytical framework for the study.
2.1 DEFINITION
Human Capital
Human capital is "...the skills, knowledge, and experience possessed by an individual
or population, viewed in terms of their value or cost to an organization or country " (Oxford
Dictionaries. April 2010. Oxford University Press).
Rate of Return
Rate of return is "...the gain or loss on an investment over a specified period,
expressed as a percentage increase over the initial investment cost. Gains on
investments are considered to be any income received from the security plus realized
capital gains" (Retrieved from />accessed on Dec. 25, 2012).
Return to Education (Schooling)
The return to education is captured only indirectly by different methods
depending on which level the study is examined at. Specifically, at society level, the
return to education is presented as the investment in education relative to national
wealth; At enterprise level, it is the investment in training in effect with enterprise
9
performance; In term of individual, the return to education is described as years of
schooling relative to life income.
At individual level, the "individual return to education" is also termed as "private
return to education" to distinguish with "social return to education" at society level.
This study covers at individual level.
2.2 A STANDARD MODEL OF HUMAN-CAPITAL INVESTMENT
Mincer (1974) proposed the standard Human Capital model in which the log of
observed earnings of an individual is interpreted by years of schooling, experience in
labor market and squared of experience. The theoretical foundations behind this
standard model are briefly presented as follows:
Mincer contends that potential earning at time t depend on investment in human
capital made at time t-1. Let Et be potential earnings at time t. Assuming that an
individual uses kt as a share of his/her potential earnings with rt as a return in each
period t to invest in human capital. Then the potential earning at time t+1 is as follows:
E t 1 E t (1 rt k t )
(2.1)
After a number of repeated substitutions, we have:
t 1
ln E t ln E 0 ln(1 r j k j )
(2.2)
j 0
By assuming that schooling is the number of years, s, spent in full-time
investment (k0=…=ks-1=1), which is assumed to arise at the beginning of life and to
produce a rate of return rs which is constant over all years of schooling (r0=…=rs-1=β)
and the return to post-schooling investment is constant over time (r s=…=rt-1=λ), we can
rewrite equation (2.2) as follows:
10
t 1
t 1
j s
js
ln E t ln E 0 s ln(1 ) ln(1 k j ) ln E 0 s k j
(2.3)
Where, the last approach is for small value of β, λ, and k.
To link between potential earnings and experience z from labor market, the postschooling investment is assumed to be linearly decreased over time.
z
k s z (1 )
T
(2.4)
Where T is the last year of working life; z=t-s ≥0; and (0,1).
Replacing (2.4) into (2.3), we got:
2
ln E t ln E 0 s
z
z
2T 2T
(2.5)
By subtracting (2.4) from (2.5), we got an equation for net potential earnings:
z
2
ln E t 1 ln E 0 s
z
z
2T T 2T
T
(2.6)
Let denote,
z
and
ln npet ln Et 1 ; ln E 0 ;
2T T
2T
T
Equation (2.6) can be rewritten as follows:
ln npe t s z z 2
(2.7)
With final assumption that, at any time t, the observed earnings are equal to net
potential earning, we have: ln Yt ln npe t
(2.8)
Replacing (2.8) into (2.7), we got the standard Mincerian earnings equation:
ln Yt s z z 2
(2.9)
11
2.3 EMPIRICAL STUDIES ON ESTIMATING RETURNS TO EDUCATION
2.3.1 Selective Empirical Studies in the World
There are a huge number of studies in the world relying on the Mincerian earnings
function in estimating returns to education. In spite of sample selection bias as serious
limitation, OLS regression are worldwide applied. Numerous supplementary variables
are often fitted in the estimation, such as: gender, regional dummy variables, ethnicity,
race, marital status, union membership, etc. These variables serve as exogenous
“control variables” which may shift the earnings function upward or downward
depending on their signs.
Johnson and Chow (1997) estimate rates of return to schooling in China by
using OLS regression and data from a survey of Chinese individuals in 1988. The study
also includes gender, race and Communist Party affiliation as control variables. The
authors find that the rates of return to education in China is 4.02% in the rural and that
3.29% in the urban. In the urban areas, females’ rate of return is significantly higher
than that for males (4.46% vs. 2.78%). Additionally, members of Communist Party in
urban areas have significantly lower returns to schooling than those of non-members
(2.42% vs. 3.68%).
Onphanhdala and Suruga (2007) assess the returns to education in Lao by using
Lao Expenditure and Consumption Survey in 2002/2003 (LECS 3). Dummy variables
for gender, area, ethnicity, type of business and region are included in the regression.
Interpreting the OLS estimator, the authors present that the returns to schooling in Lao
are still very low, but have increased significantly with the economic transition (from
3.2% in 1997-1998 to 5.2% in 2002-2003). Specially, young workers obtain higher
returns (7.0%) than older workers (3.9%), indicating that returns to education will
continue to rise when the market reforms have full effect. Although workers with high
levels of education are paid large earnings premiums, but primary level still indicate it
12
as the most profitable investment in education. Furthermore, wage differentials are
found significant between public sector (2.2%) and private one (5.2%).
To correct the sample selection bias caused by nonrandom data, Heckman (1979)
introduces a two-step simultaneous model which has become a popular technique in
many fields of study. Siphambe (2008) applies this model in his study when estimating
the educational returns in Botswana in 2002-2003.
Siphambe (2008) uses the Household Income and Expenditure Survey data
(HIES) in 2002-2003 to examine the returns to education in Botswana. The author
includes such variables as age, education, and marital status in probit equation to create
the selection variable, the Inverse Mill Ratio, which is then inserted into the earnings
function. The author then re-estimates the equation. The results show that the average
rates of return to education in the 2002-2003 period is 15%, representing 1% decline
compared with the 1993-1994 period (16%). In term of schooling levels, details are
reported that the biggest fall is for upper secondary at 28% points (8% in the later
period vs. 36% previously). The university education, however, has the rates of return
rise at more than 50% (24% vs. 11%). Except the upper secondary, the pattern of rates
of return to education keeps similar to the findings in Siphambe (2000). In term of
wage differentials, the results show that the females and males enjoy the same rates of
returns on education (around 15%) in 2002-2003, which is much different from
Siphambe (2000), where the average rates were higher for females than for males.
Another critical problem when studying educational returns is the endogeneity.
To deal with unobserved heterogeneity, in his review works, Card (1999) summarizes
three broad approaches: (i) using instrumental variables based on institutional features
of the education system (typically, Angrist and Krueger, 1991); (ii) using family
background as instrument for schooling (Ashenfelter and Rouse, 1998; Nakamuro and
13
Inui, 20123); (iii) estimating based on the schooling and earnings of twins (Ashenfelter
and Krueger, 1994). These works generally focus on the estimation of the average
impact of education on earnings, by means of both OLS and IV techniques.
Angrist and Krueger (1991) reason that because of school start age policy and
compulsory school attendance laws, individuals born in the beginning of the year
usually start school at an older age, and can therefore drop out after completing less
schooling than individuals born near the end of the year.
The estimation draws on a variety of data sets constructed from the Public Use
Census Data in 1970 and 1980. The samples focus on males of 16 years old born in the
US to specify the 1920-1929 corhort (in 1970 Census); and 1930-1939 corhort and
1940-1949 corhort (in 1980 Census).
Using the interaction between quarter-of-birth and year-of-birth as instrument for
education, the athors evaluate the effect of compulsory schooling laws on education
across cohorts. After controlling for age in quadratic, race, marital status and urban
residence, the difference-in-difference approach suggests that the returns to an
additional year of schooling is 10% for men born in 1920-1929, 6% for 1930-1939 men,
7.8% for 1940-1949 men.
Ashenfelter and Krueger (1994) use primary data collected at the Annual Twins
Days Festival in Twinsburg (Ohio) in 1991 to state that the workers’ ability (or other
characteristics) and schooling are uncorrelated, hence cause no direct effect on
earnings. The final sample contains 298 pairs of identical twins 4 who are assumed to
have the same ability but for some random reason vary in the amount of school they
3
This empirical study is not included in the review of Card (1999) but in line with the work of Ashenfelter and
Rouse (1998), so I add in.
4
Identical twins (or Monozygotic twins) who come from the same egg and sperm and are genetically identical,
hence are hypothesized to share the same innate ability; vs. Dizygotic twins (or fraternal twins) who come from
two eggs and two sperm and are not genetically identical, hence are more likely to be affected by omitted ability
bias.
14
obtain. By using each sibling’s report on his/her sibling’s education level as an
instrumental variable for his/her sibling’s education level, the authors find out that an
additional year of schooling raises wages by 12-16%.
Ashenfelter and Rouse (1998) utilize the data conducted at the Annual Twins
Days Festival in Twinsburg (Ohio) (the so-called Princeton Twins Survey) for 3 years
1991-1993, including 340 twin pairs (680 twins) of identical twins. The authors control
for age (rather than experience as in traditional Mincerian equation) and use the
difference between twin 2's report of twin 1's education and twin 2's report of his/her
own education as instrumental variable. The results are fitted by fixed-effect estimator
estimating that the annual returns to schooling attained for identical twins is about 9%
on average.
In the very recent study, Nakamuro and Inui (2012), following Ashenfelter and
Rouse (1998), measure the causal effect of education on earnings by using sample of
twins in Japan. The final results regressed on the data of 2,257 identical twin pairs
collected through a web-based survey. After correcting the measurement errors by the
IV method, the authors obtain 9.3% as the average returns to education in Japan.
2.3.2 Empirical Studies in Vietnam
In Vietnam, there are a few articles written on the Mincerian function. Most of the
studies use OLS regression (one round or two rounds) (Glewwe & Patrinos, 1998;
Gallup, 2002; Moock et al., 2003; Vu Trong Anh, 2008; Vu Thanh Liem, 2009; some
use Heckman two-stage approach to correct the sample selection bias (Liu, 2006);
some use Heckman one single step model (Doan & Gibson, 2010); some use the
difference-in-difference approach (Nguyen Xuan Thanh, 2006).
Glewwe & Patrinos (1998) use the VLSS 1992–93 to examine the nature of
attending private schools in Vietnam. As a result, some important conclusions are
15
made: (1) among public, private and semi-public schools, better-off households tend to
send their children to private schools rather than to semi-public ones; (2) of the same
school attainment, individuals attending private schools get higher wages than ones
from public schools; (3) the return to schooling in Vietnam is 1.6% in 1992–93.
Gallup (2002), while calculating wage inequality among such controlled
variables as different sectors, regions, or genders in Vietnam in 1993 and 1998, finds
that although the rate of return to schooling in Vietnam increases from 2.9% in 1993 to
5.0% in 1998, it is still very low coefficient. The results are retrieved from the VLSS
1992–93 and 1998 data, and two-round OLS regression.
Moock et al. (2003), in their attempt to analyze the returns to education in
Vietnam by Mincerian function based on the VLSS 1992–93, find that the estimated
rates of return are quite low (4.8%). Specifically, on average, the rates of return to
primary and university education are 13% and 11% respectively. However, these
rates are just 4% and 5% at secondary and vocational levels. For higher education
(colleges, universities or above), the returns are higher for females (12%) than for
males (10%).
Nguyen Xuan Thanh (2006) is the pioneer in applying the difference-indifference approach to investigate the rate of return to schooling in Vietnam. The result
is derived from the VLSS 2002. He documents that an additional year of schooling is
associated with 7.32% increase in wage in 2002.
Liu (2006) exploits the data of VLSS 1992–93 with Heckman two-stage approach
and the VLSS 1998 with OLS regression. He reports a higher coefficient on schooling
for males (5.9%) than females (4.2%) for year 1992–93, but a contrast results are seen
for year 1998 when males are rewarded with 3.5% for each additional year of
education, while females are rewarded with 4.8%.
16
Vu Trong Anh (2008) uses the data of VHLSS 2004 to point out that the rate of
return to schooling in Vietnam is 7.4% in 2004. For the same objective but with a
different data set - VHLSS 2006, Vu Thanh Liem (2009) shows the return to be
7.63% in 2006.
Different from other authors who just suggest the returns for a specific year,
Doan & Gibson (2010) utilizing VLSS 1998, 2002, 2004, 2006 and 2008 examine the
trend in the rate of return to schooling in Vietnam over 10 years 1998-2008, by using
OLS and Heckman selection estimator (Maximum Likelihood approach). The returns
are found 2.9% for year 1998, 7.6% for 2002, 8.6% for 2004, 8.8% for 2006, and 9.5%
for 2008, showing a clear rising trend over the mentioned period and reach their peak
around 2004-2008.
The Table 2.1 below summarize the above-mentioned empirical studies in a more
visual way (The research for 2009-2010 has not been found out till this study is done,
therefore, not included in the study).
Table 2.1: Empirical studies in Vietnam utilizing Mincerian earnings function
over the period 1992-2008 5
Authors
Glewwe &
Patrinos
(1998)
Gallup (2002)
Year
Results
1992-93
1.6%
1992-93
2.9%
1998
5.0%
1992-93
1.9%
1998
3.5%
Methods
5
Other controlled variables
OLS
Experience, experience
squared, gender, types of
school, region
OLS
Experience, experience
squared
OLS
Experience, experience
squared, gender, minority,
Chinese, non-agricultural
The comparision may be inappropriate due to different methodology apllied and diverse control variables
incorporated.
17
employment, private,
employer, HCMC, Hanoi
Moock et al.
(2003)
Nguyen Xuan
Thanh (2006)
1992-93
4.8%
OLS
Experience, experience
squared, log weekly hours
worked
7.3%
OLS
Experience, experience
squared
2002
Experience, experience
squared, gender, geography,
in-difference
agricultural/non-agricultural
approach
job, sectoral ownership
Difference-
11.4%
Male: 2.9%
Heckman
two-stage
approach
1998
Female:
4.8%
OLS
Experience, experience
squared, married, migrant,
urban, regions, majority,
state employees, SOEs
employees, industries
Vu Trong Anh
(2008)
2004
7.4%
OLS
N/A
Vu Thanh
Liem (2009)
2006
7.6%
OLS
N/A
1998
2.9%
2002
7.6%
2004
8.6%
OLS
2006
8.8%
Experience, experience
squared, gender
2008
9.5%
1998
3.5%
2002
7.8%
2004
9.6%
2006
9.5%
2008
10.3%
1992
Liu (2006)
Doan &
Gibson (2010)
Female:
5.0%
Male: 3.5%
Heckman
one single
step model
18
Experience, experience
squared, gender, household
size, non-wage income
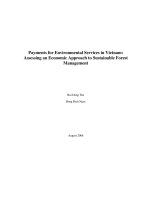
2.4 ANALYTICAL FRAMEWORK
Clustered data: VHLSS 2008
Independent variables:
(1) Schooling: divided by years of schooling
and levels of schooling including primary,
secondary, vocational education, bachelor
and above.
(2) Years of experience
(3) Squared years of experience
(4) The logarithm of hours work per week.
Dependent variable:
The logarithm of monthly
earnings
Models are fitted for all, male, and female;
private, public, and foreign sectors
Random Effects model,
clustered on household
Private returns to
education for all, male,
female; private, public,
foreign sectors
Figure 2.1 Analytical Framework
2.5 CHAPTER REMARKS
The study employed the standard Human Capital model developed by Mincer
(1974) to build up its conceptual framework. Under the framework, the logarithm of
observed monthly earnings of an individual is explained by years of schooling, years of
19
experience in labor market, squared years of experience, and the logarithm of hours
work per week.
In order to examine the returns to education in Vietnam, most of the existing
studies use OLS regression as their first or final modeling. However, this method does
face problems of underestimating standard errors within the same household and
ignoring the mean variation between different households.
Specifically, individuals/employees in the same household are likely to share the
same unobservable household characteristics such as culture, specific genetics that may
affect their earnings ability. Therefore, the error terms for individuals from the same
household will be correlated through a common household-level component, and if
ignored this may lead to substantially underestimated standard errors (Glick and Sahn,
2000, p.69-70).
Moreover, OLS estimator ignores the mean variation between households. For
instance, OLS results a common intercept at state level, say, all individuals have a
common intercept, regardless of households. It is unlikely to be true in reality as
individuals from different households may hold different intercepts.
By addressing the above issue, instead of using a simple standard cross-sectional
OLS estimator along with cluster-robust standard errors, I transfer cross-sectional
data to clustered data at household level, and then fitted by random-effect
estimator. By doing so, I allow for such correlation, as mentioned above, in the model
through a random effect for the residuals.
20
CHAPTER 3.
RESEARCH METHODOLOGY
This chapter describes the source of data used, the way to collect and extract to
final results. The methodology applied to analyze the data sample is presented in the
next part, followed by empirical models. The introduction of new approach CLUSTERED DATA APPROACH is the highlight of this chapter. Variable coding is
the final part to show how I code the dependent and independent variables from the
data set.
3.1 DATA
The data for this study is the Vietnam Household Living Standard Survey
(VHLSS) conducted in 2008 by the General Statistical Office (GSO) of Vietnam. The
surveys contain detailed information of 9,189 households from 3,063 communes.
Samples were weighted basing on the statistics of Vietnam Population Census in 1999
with approximately 70% of Vietnamese households lived in rural areas. The communes
were randomly selected from a total of proximately 10,000 communes in 646 districts,
and 64 provinces and cities in Vietnam, and then an average of 3 households were
randomly selected for interview in each commune.
In this research, I am going to estimate returns to education for only individuals
who are employed for salary6. Only individuals in ages from 15 to 60 for male and 15
to 55 for female are considered. Earnings are calculated by monthly earnings in labor
market Earnings/month (1,000 VND). Individuals who work for their household are
dropped out of the sample.
6
VHLSS separates employment into wage employment, farm self-employment, and non-farm self-employment.
In this study, I consider only wage earners. Earnings are proxied only by salary/wages received, including
payment in kind, from the work being done (refer to Table 3.3 “Description of the Variables and Variable
Coding” for more details).
21
Years of schooling are collected from general education system 7 . This is the
highest class that he/she has been completed. For example, a person who is in grade 10,
only recorded grade 9 is the highest grade completed. Another man was in grade 9 and
dropped out of school, write the grade 8 is the highest class finished. For individuals
who are at College level, years of schooling equal 15 years; 17 years for Bachelor; 19
years for Master; and 22 years for PhD level (Le Thi Nhat Phuong, 2008; Le Anh
Khang, 2012).
While data on schooling attainments for each individual is obtainable, information
on post-school investment is not available in VHLSS. Therefore, following Mincerian
earning function, difference in quantities of post-school investment among employees
are measured by differences in years of experience which is proxied by age of
employee (in years) minus years of schooling.
Hours of work per week are affixed as a compensatory instrument (Moock et al.,
2003, p.504). Mincer (1974, part 1, p.22) states that the annual earnings profile is
affected when hours of work vary over the life cycle. For instance, in the circumstance
of certainty where individual wealth is considered as fixed the cost of time increases
with experience until reaching the peak of earning capacity. If so, the ascent and
descent of earning capacity is likely to trigger a corresponding pattern of working
hours provided for market. Thus, it seems to be overestimated of investment in human
capital or the rates of return if we use the observed annual earnings as dependent
variable. Hours worked per week are then added as a compensatory factor for the
above overestimated matter.
After consolidated to remove errors and inconsistencies, the sample data remains
6,956 individuals/employees, living in 4,335 households.
7
VHLSS divides education into general education and vocational education.
22