Determinants of income diversification and its effects on household income in rural vietnam
Bạn đang xem bản rút gọn của tài liệu. Xem và tải ngay bản đầy đủ của tài liệu tại đây (664.11 KB, 60 trang )
UNIVERSITY OF ECONOMICS
HO CHI MINH CITY
VIETNAM
INSTITUTE OF SOCIAL STUDIES
THE HAGUE
THE NETHERLANDS
VIETNAM - NETHERLANDS
PROGRAMME FOR M.A IN DEVELOPMENT ECONOMICS
DETERMINANTS OF INCOME DIVERSIFICATION
AND ITS EFFECTS ON HOUSEHOLD INCOME IN
RURAL VIETNAM
BY
HO THI NGOC DIEP
MASTER OF ARTS IN DEVELOPMENT ECONOMICS
HO CHI MINH CITY, JANUARY 2013
UNIVERSITY OF ECONOMICS
HO CHI MINH CITY
VIETNAM
INSTITUTE OF SOCIAL STUDIES
THE HAGUE
THE NETHERLANDS
VIETNAM - NETHERLANDS
PROGRAMME FOR M.A IN DEVELOPMENT ECONOMICS
DETERMINANTS OF INCOME DIVERSIFICATION
AND ITS EFFECTS ON HOUSEHOLD INCOME IN
RURAL VIETNAM
A thesis submitted in partial fulfilment of the requirements for the degree of
MASTER OF ARTS IN DEVELOPMENT ECONOMICS
By
HO THI NGOC DIEP
Academic Supervisor:
Dr. HA THUC VIEN
HO CHI MINH CITY, JANUARY 2013
ACKNOWLEDGEMENTS
With these words, I would like to express my sincere thank to all who have
supported me during my journey to complete the Master program in general and
this thesis in particular.
First of all, I would like to thank the Board of Faculties of the University of
Economics of Ho Chi Minh City and International Institute of Social Studies
(ISS) for providing me with all fruitful and precious academic knowledge
during the master program.
The Thesis could not have been designed and completed without the support
from my Professors in the University of Economics and ISS. I would like to
show my deepest gratitude to Dr. Ha Thuc Vien and Dr. Tran Tien Khai for all
their invaluable comments and fruitful guidance from the very beginning of the
formatting of the topic. My special thanks go to Dr. Ha Thuc Vien for his
academic supervision, inspiration through the progress of my thesis writing. In
addition, I would like to express my sincere thank to Dr. Pham Khanh Nam,
Mr Nguyen Van Dung for their guidance on technical issues used for the
analysis of the thesis.
Last but not least, I am deeply indebted to my family members: my parents, my
parents – in law, my sisters for all their understanding and supports during my
study. I would like to express my special thanks to my mother and my motherin-law, who have helped me to take care of my little baby so that I can
concentrate on my thesis. Finally, I would like to thank my husband who is
always besides me, encouraging and helping me with daily life, so that I can
spend most of my time on completing the thesis.
2
TABLES OF CONTENTS
Acknowledgements
List of tables, figures
Abstracts
CHAPTER 1 INTRODUCTION
1.1 Problem Statement.......................................................................................... 1
1.2 Research objectives ........................................................................................ 2
1.3 Research questions ......................................................................................... 2
CHAPTER 2 LITERATURE ........................................................................... 4
2.1 Concepts and measures of income diversification ......................................... 4
2.2 Theoretical framework ................................................................................... 6
2.3 Determinants of income diversification ........................................................ 8
2.4 Previous studies on income diversification in Vietnam ............................... 10
CHAPTER 3 DATA AND RESEARCH METHODOLOGY ...................... 12
3.1 Data............................................................................................................... 12
3.2 Research methodology ................................................................................. 12
3.2.1 Classification and calculation of income sources ..................................... 12
3.2.2 Indicators of income diversity ................................................................... 13
3.2.3 The method of analysis .............................................................................. 15
3.3 Chapter remarks............................................................................................ 16
CHAPTER 4 FINDINGS AND DISCUSSION .............................................. 17
4.1 Patterns and trends in income diversification............................................... 17
4.1.1 Diversity of income sources ...................................................................... 17
4.1.2 Diversification as a shift to non-farm activities ........................................ 21
4.1.3 Diversification as commercialization production ..................................... 24
4.2 Econometric results and discussion .............................................................. 29
4.2.1 Expected sign of determinants of income diversification ......................... 31
4.2.2 Determinants of income diversification (number of income sources) ...... 33
4.2.3 Determinants of income diversification (Simpson index of diversity) ..... 35
3
4.2.4 Determinants of income diversification (share of non-farm income in total
income) ............................................................................................................... 38
4.2.5 Impact of income diversification on total income of household ............... 42
4.3 Chapter remarks ........................................................................................... 45
CHAPTER 5 CONCLUSIONS AND RECOMMENDATIONS ................. 46
4
LISTS OF TABLES AND FIGURES
TABLES
Table 4. 1 Measures of diversity in income sources and Simpson index of
diversity in rural areas by regions across years ..........................................18
Table 4. 2 Measures of diversity in number of income sources and Simpson
index of diversity in rural areas by income quintile across years ...............20
Table 4. 3 Share of non-farm income in total income by income quintile across
years ............................................................................................................23
Table 4. 4 Measure of commercialization by regions and year .........................26
Table 4. 5 Measure of commercialization by income quintile and year ............28
Table 4. 6 Descriptive statistics for the dependent and independent variables ..29
Table 4.7 Hypotheses regarding impact of independent variables on measures
of income diversification ............................................................................31
Table 4. 8 Determinants of income diversification (NIS) ..................................36
Table 4. 9 Determinants of income diversification (SID) and (NFS) ................37
Table 4. 10 Summary of results on determinants of income diversification .....41
Table 4. 11 Impacts of income diversification on total income of household ...44
FIGURES
2.2
The Sustainable Livelihood Framework………………………………...7
4. 1
Trends in income composition of rural households……………………22
4. 2
Share of nonfarm income in total income of rural households……… 23
4. 3
Share of output sold or bartered by region and year………………… 25
5
ABSTRACT
Income diversification has been a special attention of researchers, especially in
developing countries. It is a means to increase household’s income and reduce
risks of income volatility of each income source. However, the patterns and
trends of income diversification vary from country to country and from region
to region. This research aims at examining the determinants of income
diversification among rural households in Vietnam and the impact of
diversification on household’s total income in order to decide appropriate
policy responses. Based on Vietnam Household Living standard surveys in
2002, 2004, 2006, 2008 and 2010, the descriptive analysis on a variety of
concepts of diversification shows that the diversification in rural areas is very
common and tends to increase over time. For instance, a number of income
sources among rural households goes up to from 4.08 in 2002 to 4.28 in 2010.
The analysis also indicates the growing importance of non-farm activities.
Nevertheless, the extent of diversification is not the same between the rich and
the poor. The poorer tend to have more income sources than the richer while the
richer is much more diversified in terms of share of income from non-farm
activities than the poorer. The econometric analysis uses methods of Poisson
regression in the model of number of income sources and Tobit regression in
the model of SID and NFS. The regression results show that socio-economic
status and access to formal financial market both have positive impact on the
number of income sources pursued by households and the Simpson index of
diversification. Interestingly, it is found that the access to financial markets has
negative effect on the share of non-farm income. The accessibility of
infrastructure is also an important determinant of income diversification. The
evaluation of reverse impact of diversification on household’s total income
confirms that all of the three indicators of income diversification: a number of
income source, share of non-farm income and Simpson index of diversity have
positive impact on household’s total income. It implies that households try to
6
increase their income by pursuing multiple income strategy, expanding their
income generating out of agricultural activities and maintaining the balance
among different income activities.
7
CHAPTER 1
INTRODUCTION
1.1 Problem Statement
Income diversification among rural household in developing countries has
called for substantial attention of scholars in development economics. It is
referred to the allocation of resources among different income generating
activities, both on-farm and off-farm, according to Abdulai and Crolerees
(2001). There are several motives for households to diversify their income
sources. Households tend to carry out the income diversification because of the
need to manage risks, to secure a smooth flow of income, to allocate the surplus
labor or to respond to different kinds of market failures such as insurance and
credit market imperfection (Ellis, 1998).
Given the potential role of income diversification in stabilizing income and
alleviating rural poverty, governments in several developing countries are
increasingly interested in promoting diversification. And Vietnam with more
than 70% of the population lives in rural areas is not an exception. Since 1986,
the Government has implemented various policies with an aim to developing
multi-sector economy, renovating the economic structure and stabilizing the
social economic environment including improving people’s living standards
and opening the country’s economy to the rest of the world. For rural
development, some specific objectives raised are to create more jobs, to raise
agricultural and rural industry-related income, and to develop services and offfarm activities. In other words, these policies are designed to directly or
indirectly stimulate the process of income diversification in Vietnam in general
and in rural areas in particular. With the nation-wide renovation, Vietnam has
gained some remarkable achievements in economic development and poverty
reduction, with the annual economic growth rate of 6-8 percent since the early
1990 and the poverty rate falling from 58% in 1993, 29% in 2002, 15.5% in
1
2006 to 14.5% in 2008 and 14.23% in 2010 (GSO). Part of income growth and
poverty reduction is undoubtedly due to diversification among households both
into higher value crops and into non-crop activities such as livestock raising,
and non-farm activities.
Though income diversification plays such an important role in the early stage of
rural transformation, the patterns of rural income diversification may vary
across countries and regions (Ellis, 1998). Hence, it is necessary to identify the
determinants of income diversification of specific countries and regions as it
helps government have appropriate policy response to support the rural areas.
While there are very few empirical studies about the income diversification
issue in Vietnam, the research on the impact of diversification on household
income is even rarer. Based on the empirical studies and data from Vietnam
Household Living Standards Survey 2008 (VHLSS 2008), this paper is aimed at
determining the factors that affect the ability to carry out income diversification
among households in rural Vietnam and to measure the impacts of
diversification on household incomes.
1.2 Research objectives
The paper is to investigate determinants of income diversification among
households in rural areas of Vietnam, and measure the difference in the level of
impact of these factors among economic and geographical regions. This paper
also aims at examining the reverse effects of income diversification on the
household income.
1.3 Research questions
Specifically, the paper tries to address the following questions:
- What are the determinants of income diversification in rural Vietnam at
household level?
-
How does the level of income diversification differ among rural regions
within Vietnam?
2
-
What are the impacts of diversification on household income?
The thesis is organized into 5 chapters . After the introductory Chapter, Chapter
2 is literature review, including the review of theoretical framework and the
previous studies of income diversification in developing countries. Chapter 3
describes the data source and methodologies used to analyze the data.
Determinants and impacts of income diversification are analyzed economically
in Chapter 4. Chapter 5 summarizes the results found, draws some conclusion
related and discusses some policy recommendations.
3
CHAPTER 2
LITERATURE REVIEW
2.1 Concepts and measures of income diversification
Income diversification has been employed by households as one of the
strategies to minimize the income variability and ensure a minimum level of
income. Empirical studies commonly based on five different indicators of
income diversification for their analysis, each of which is discussed in details as
bellows:
The first definition is possibly the simplest one that diversification is referred to
the increase in the number of income sources of households (Minot et al. 2006).
Accordingly, households with more income sources are considered to be more
diversified and the more number of sources a household has over time, the
greater the increase in diversification that household pursue over that time
period. This indicator is simple to measure and understand. However, it only
focuses on the number of sources with equal treatment among every income
source but not taking into the consideration its importance to the total income of
household.
The second approach is introduced to overcome the weakness of the previous
measure. This indicator takes into account not only the number of income
sources but also the contribution of each source to total household income.
With this concept, income diversification is referred to the process that
households try to increase the number of sources and also gain a greater balance
among the income sources in their portfolio (Ellis 2000, Minot et al. 2006).
Following this concept, Schawarze and Zeller (2005) used the Shannon
equitability index, which increases with the number of income sources and their
evenness to analyze the income diversification among household in Indonesia.
4
Similarly, the inverse Herfindahl index is employed by Babatunde and Qaim
(2009) in examining the patterns of income diversification in Nigeria.
The third measure is related to nonfarm employment. It is defined as a process
in which rural households increase their income from the non-farm sector
(Barrett and Reardon 2001, Barrett et al. 2001). This concept is most commonly
used in the form of the percentage of income from non-farm activities in total
households’ income by a number of authors including Ellis (2000), Abdulai and
CroleRees (2001) and Minot et al. (2006).
The fourth definition is referred to the switch of subsistence production to
commercialization production. The three basic measures often used to define
this
type
of
diversification
are
crop
diversification,
agricultural
commercialization and income commercialization. Crop diversification refers to
the proportion of crop production that is sold or bartered. The agricultural
commercialization is defined as the share of agricultural output that is sold or
bartered. The income commercialization is measured by the proportion of gross
income from the cash income.
Finally, income diversification is defined by Minot et al. (2006) as “the process
of switching from low-value crop production to high-value crops, livestock, and
non-farm activities”. Some measures of this type of diversification are: the
share of high value crops, the proportion of income from non-crop activities
and the share of income from non-farm activities.
Within the scope of this study, we employ the first four concepts in the analysis
of income diversification, which are discussed in details in the descriptive
analysis. In the econometric analysis part, we only take into consideration three
indicators of diversification: number of income sources, Simpson index of
diversity, and the share of non-farm income in total household’s income.
5
2.2 Theoretical framework
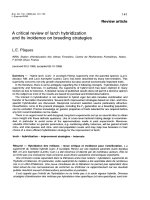
This study bases on the concept of Sustainable Livelihood Framework.
According to Ian Scoones (1998), the concept ‘Sustainable Rural Livelihood’
has become increasingly important in the debates about rural development and
poverty reduction. This term relates to a wide range of issues and its definition
has been proposed and modified several times since 1992 when it was first
introduced by Brundtland Commission on Environment and Development.
Among these definitions, IDS’s definition is somewhat a modified one of
Sustainable Livelihood as follows:
“A livelihood comprises the capabilities, assets (including both material
and social resources) and activities required for a means of living. A
livelihood is sustainable when it can cope with and recover from stresses
and shocks, maintain or enhance its capabilities and assets, while not
undermining the natural resource base.”
Under the Sustainable Livelihood Framework, people are put at the centre of a
variety of factors with inter-relationship that influence them to create
livelihoods. Among these factors, the livelihood assets that they can access to
and use play a very important role. These assets include natural capital, physical
capital, human capital, social capital and financial capital. However, the extent
to which they can access these assets is strongly impacted by their contexts in
the form of trends (for instance, economic, political) or shocks (for example,
natural
disasters).
Moreover,
other
social, institutional
and political
environments all have certain effects on the ways people use their assets to
achieve their goals, which are known as livelihood strategies. Livelihood
diversification is one of the strategies that enable households to increase their
income, minimize the income fluctuations, hence improve their livelihood.
6
Context
Livelihood
Institutional
Livelihood
Sustainable
Conditions
Resources
Procedures and
Strategies
Livelihood
and trends
Organizational
Outcomes
Structures
POLICY
History
Politics
MacroEconomics
Conditions
Terms of trade
Climate
Agro-ecology
Demography
Social differentiation
Contextual analysis of
conditions and trends,
and
assessment of policy
setting
LIVELIHOOD
Natural capital
Agricultural
Human capital
intensifications-
Institutions
and
organizations
Physical capital
Financial capital
extensifications
Livelihood
diversification
Social capital
Migration
Analysis of
livelihood
resources: trade-offs,
combinations,
sequences,
trends
1. Increased number of working
days created
2. Poverty reduced
3. Well-being and Capabilities
improved
Analysis of
institutional/organizational
influences
on access to livelihood resources
and composition of livelihood
strategy portfolio
Analysis of livelihood
strategy
portfolio and pathways
Sustainability
4. Livelihood
adaptation, vulnerability
and resilience enhanced.
5. Natural resource base
sustainability ensured
Analysis of
outcomes and
trade-off
Figure1: The Sustainable Livelihood Framework (Scoones 1998:4)
7
2.3 Determinants of income diversification
Researchers have identified several reasons why households try to diversify
their income sources. These reasons are categorized as “demand-pull” factors
versus “push-distress” factors (Barrett et al. 2001, Davis 2003, Davis and
Bezemer 2003, Ellis 2000). “Pull” factors are ones that facilitate households to
gain the wealth accumulation thanks to competitive advantages of superior
technologies, skills and endowments. “Push” factors refer to difficult
circumstances that face a specific household, a group of households or
households within a region such as weather conditions, policy changes and
failure of credit or insurance markets. These factors lead the households to
diversify their income sources into non-farm activities for income smoothening
by pursuing “risk management strategies” or “risk coping strategies” (Reardon
et al. 2007). Reardon et all (2007) also argue that the literature on income
diversification which defines its determinants in terms of pull and push factors
tend not to place sufficient importance to the incentives underlying
diversification as well as not enough attention to household capacity variables.
They introduce another approach, focusing on the household capacity variables,
defined as capital assets. According to this approach, the extent of participation
in diversification strategy is affected by a number of variables capturing
household available capacity and incentives to undertake that activity.
In line with the sustainable livelihoods literature, the ability of households to
diversify income highly depends on their access to the different types of capital.
It explains why households do not have the same opportunities to participate in
non-farm activities, and hence get less diversified income (Abdulai, et all.,
2001). The capitals as mentioned refer to a variety of assets that allow
households to take part in farm as well as non-farm activities, which are
commonly categorized as human, physical, financial, and social capital.
Capital within Reardon et al (2007) framework in particular and the sustainable
livelihoods theory in general, mention not only household’s private assets but
8
also its accessibility to public assets. In other words, the capacity variables
which are proposed to determine income diversification may be measured at
household/individual or regional or village level. At household and individual
level, the demographic characteristics may affect the decision and ability to
carry out the income diversification. At the regional or village level, the
physical and institutional infrastructure plays an important role in driving the
income diversification among households. Better access to infrastructure such
as communication, roads may help to reduce the cost of acquiring information,
lower transport and transaction costs, as well as to enhance the households’
opportunities of participation in non-farm activities (Barrett and Reardon, 2001;
Davis, 2003; Ellis, 2000; Reardon, et al. 2007).
The impacts of the above types of assets on household income diversification
have been reflected in empirical studies in different countries. Barrett, Reardon
and Webb (2001) point out in most of the research papers on income
diversification that better education has important effects on non-farm earnings.
In studies of Tanzania, Lanjouw et al. (2001) finds that a better physical access
to markets increases non-farm earnings. Abdulai and Crolerees (2001) finds in
their study about the determinants of income diversification among rural
households in Southern Mali that poorer households have fewer opportunities in
cash – crop production as well as non crop activities, leading to their less
diversified incomes in which lack of capital is the major reason. Studies in other
developing economies also prove for the significance of these factors. For
instance, access to public assets such as roads, electricity, water and private
assets such as education and access to credit are also pointed out as factors that
affect the households’ ability and their extent to participate into income
diversification (Escobal 2001; Babatunde and Qaim 2009).
Regarding to the influence of diversification on household livelihoods, the
positive relationship between income diversification and household welfare has
been found by a variety of researches. Babatunde and Qaim (2009) point out in
9
a study in Nigeria that income diversification has positive and significant
impact on total income of households regardless of the diversification measures
used. In Zimbabwe, Ersado (2003) employs the number of income sources, the
share of nonfarm income, and the Simpson index as measures of income
diversification to study the relationship between diversification and household
welfare. The author finds that in rural areas, richer households are more
diversified in income sources, while the result is in the opposite way in urban
areas. Ersado (2003) also finds in rural areas with high variability in rainfall,
households tend to have more number of income sources, which is in line with
the literature that considers multiple income strategy as a risk management
strategy.
2.4 Previous studies on income diversification in Vietnam
Since 1986, the Vietnam Government launched a policy called “Doi Moi”
(renovation) and has gained some remarkable achievements in economic
development and poverty reduction. While there have been several researches
and empirical studies conducted on the poverty issues in Vietnam (Glewwe et
al. 2004, Minot et al. 2003, UNDP 2004), only a very few studies focus on the
income diversification issues. The available studies only concentrate on specific
regions of Vietnam. For instance, Minot et al. 2006 places most of their
research content on the Northern Uplands of Vietnam while Nghiem (2010)
focuses on the Mekong Delta River.
This study follows some part of the procedures in Minot et al. (2006) to identify
the factors that affect the participation in income diversification of households
in rural Vietnam. This study is different from previous studies in three aspects.
First, the scope of study covers households in rural areas of the whole country
taken from the national Vietnam Household Living Standard Surveys. Second,
the survey years used in this study are 2002; 2004; 2006; 2008 and 2010. Third,
this study addresses not only determinants of income diversification but also
10
identify the reverse effect of income diversification on total income of
households.
11
CHAPTER 3
DATA AND RESEARCH METHODOLOGY
3.1 Data
The data used in this paper is derived from a set of national household surveys,
including five Vietnam Household Living Standards Surveys (VHLSS) carried
out in 2002, 2004, 2004, 2008 and 2010 with an aim to examine the changes in
income sources and the contribution of each income source to households’ total
income. The sample size of the dataset of VHLSS 2002, 2004, 2006 and 2010
that is employed in this study is 22,621; 6,938; 6,882 and 6,753 rural
households respectively. In order to identify the factors influencing the income
diversification of households and study the relationship between income
diversification and the total income of households, the paper uses the cross –
sectional data set of the VHLSS 2008. It was conducted nation-wide with a
sample size of 45,945 households (36,756 households in the income survey and
9,189 households surveyed on both income and expenditure) (GSO, VSLSS).
As the paper is to examine the income diversification in rural Vietnam, only
households in rural areas are included in the research comprising 6,837
households.
3.2 Research methodology
3.2.1 Classification and calculation of income sources
According to VHLSS, the income of household can be obtained from two types
of employment, through transfer and other income. The two types of
employment are wage employment and self - employment. Wage employment
is divided into farm wage employment and non-farm wage employment. Self employment includes activities such as crop, livestock, fishery, forestry which
are grouped as farm self employment and two kinds of private business, that is
12
agricultural private business and non - farm one. Based on the classification of
VHLSS and within the scope of this study, household income is categorized
into eight sources: wage (both farm and non-farm one), crop income, livestock
income, fishery income, forestry income, enterprise income (including the
income from both forms of private business), transfer, and other income.
It is relatively easy and clear to compute the income from wage employment,
which is the sum of annual earnings of household members in wage as well as
bonuses from all the jobs these members take. The income from activities such
as crop, livestock, fishery, forestry, enterprise is the net revenue from each
activity, which is balance of the total value of production and the costs of
production.
Transfer includes not only private transfers such as gifts and remittances
received by household members during the past twelve months but also public
transfers, which are the payments from different kinds of governmental
programs like social subsidy, poverty reduction… Other income includes
pensions, lottery winnings, interest of savings and loans, rental income. One-off
amount of money such as sale of buildings, vehicles, gold, etc… is not
considered as household income according to VHLSS.
3.2.2 Indicators of income diversity
As discussed above, there are different ways to measure income diversification.
In this study, the income-based approach is deployed, focusing on three aspects
of income diversification: diversification as multiple income sources,
diversification as the increased importance of non-farm income to household
total income and diversification as the production commercialization.
Regarding to the diversification as multiple sources of income, two indicators
are employed for the analysis, including the number of income sources (NIS)
and the Simpson index of diversity. NIS, which has been used by Minot et al.
(2006) and Ibrahim et al. (2009) is easy to measure. However, it is criticized for
13
its arbitrariness with the argument that if other things being equal, households
with more active adults are likely to have more income sources (Babatunde and
Qaim, 2009). For this reason, indicator is not used separately but in
combination with the other measure, which is the Simpson index of diversity
(SID). By taking into account not only the number of income sources but also
the proportion of each source to the total income, the SID allows to measure the
overall diversification of household income. The SID is employed by Minot et
al. (2006) and Joshi et al. (2003) to study diversification degree and is
calculated as follows:
SID = 1 -
(P )
i
2
where Pi refers to the income share of the income
i
generating from activity i in total income of household. If household has only
one source of income, SID is equal to zero, indicating the perfect specialization.
If the income of household is coming from many sources, the share of each
source in total income decreases and so does the sum squared shares, hence SID
will approach the value of 1, indicating that the household is highly diversified
in income.
To identify the contribution of income generating from non-farm activities
(including the non-farm wage income and the non-farm enterprise), the
indicator of non-farm income share (NFS) is employed. The larger the NFS, the
more diversified the household is. This indicator reflects the degree households
switch from farm to non-farm activities.
This paper also uses another concept to examine the income diversification
among households in which diversification is defined as the process of
switching from subsistence production to commercial production. Under this
concept, two measures of diversification will be considered, which are the crop
commercialization – the share of the value of crop production that is sold or
bartered and the agricultural commercialization – the proportion of the value of
14
agricultural products (including crop, livestock, fishery, forestry) that is sold or
bartered.
3.2.3 The method of analysis
In this research a variety of methods used to analyze the data, including the
descriptive statistics and the econometric method, which are discussed in details
in Chapter 4. The descriptive part is used to portrait the income diversification
patterns over time as well as its patterns across different types of households
and geographical regions by comparing the measures of diversification from the
surveys of different years.
The econometric part will follow to identify the determinants of income
diversification among households and examine its effects on household’s total
income based on the data of the 2008 VHLSS. For the analysis of determinants,
we apply the regression of three measures of diversification, including NIS,
SID, NFS on a set of independent variables representing for household’s capital
asset. As the dependent variable is in form of count data in the NIS model, the
Poisson regression is used. For SID and NFS measures, the data is censored
between zero and one, hence we employ the Tobit regression, which are
similarly employed by Escobal (2001) to examine the determinants of income
diversification in rural Peru. Schwarze and Zeller (2005) is another example to use
the Tobit model in similar settings.
In order to analyze the impacts of income diversification on household’s total
income, the three models are used, in which the household’s total income is the
dependent variable, and the diversification measures are added to the set of
explanatory variables. In order to avoid the problem of endogeneity, we use the
Instrumental Variables (IV) method - two stage least squares (2SLS) in the
analysis of the impact of income diversification on household’s total income.
Babatunde and Qaim (2009) use this technique in the similar context in the
analysis in Nigeria.
15
3.3 Chapter remarks
In short, this study employs the descriptive and econometric methods to portrait
the tendency of diversification and identify factors that influence income
diversification among households in rural Vietnam based on data from VHLSS
of 2002, 2004, 2006, 2008 and 2010. The analysis is carried out on three
indicators of diversification: number of income sources, Simpson index of
diversity and share of income from non-farm activities with Poisson regression
for NIS model and Tobit model for SID and NFS models. In examining the
impacts of diversification on household income, the instrument variable (IV) –
two stage Least square regression is used in order to avoid the endogeneity
problem.
16
CHAPTER 4
FINDINGS AND DISCUSSIONS
4.1 Patterns and trends in income diversification
4.1.1 Diversity of income sources
In income source diversity analysis, following the division of income sources in
VHLSS, household income is divided in 8 groups: wage, crop, livestock,
fishery, forestry, enterprise, transfer and other income. The Table 4.1 below
shows the trends in income diversity among rural household of the whole
country as well as those of the specific regions by two measures: number of
income sources and the Simpson index of diversity. Households in rural area
tend to obtain their income from a variety of sources. On average, each
household has 4.08; 4.35; 4.12; 3.50; 4.28 income sources according to VHLSS
2002, 2004, 2006, 2008 and 2010 respectively. These figures reflect a modest
increase in the number of income sources in 2004 compared to 2002 before a
gradual decline in the next two periods in 2006 and 2008. The level of diversity
increases again, with the average number of income sources goes up from 3.50
in 2008 to 4.28 in 2010. This trend happens to all geographical and economic
regions.
Considering not only the number of income sources, but also the balance
among them, the Simpson index of diversity shows the similar result in
portraying the tendency of income diversification among rural households in
Vietnam as well as most of its different regions. According to VHLSS 2002,
2004, 2006, 2008 and 2010, the value of this index is 0.488; 0.501; 0.484;
0.414; 0.442 respectively.
17