The determinants of economic growth a case study of six southeast asian countries
Bạn đang xem bản rút gọn của tài liệu. Xem và tải ngay bản đầy đủ của tài liệu tại đây (1.96 MB, 111 trang )
UNIVERSITY OF ECONOMICS
HO CHI MINH CITY
VIETNAM
ISS-INSTITUTE OF SOCIAL STUDIES
THE HAGUE
THE NETHERLANDS
VIETNAM-NETHERLANDS PROGRAMME FOR MASTER’S DEGREE
IN DEVELOPMENT ECONOMICS
THE DETERMINANTS OF ECONOMIC GROWTH: A CASE
STUDY OF SIX SOUTHEAST ASIAN COUNTRIES
SUPERVISOR
:
PRESENTED BY :
DR. NGUYỄN MINH ĐỨC
NGUYỄN KIỀU GIANG
MDE-K16
HO CHI MINH CITY, DECEMBER 2012
ACKNOWLEDGMENT
I’ve experienced the great time in this course with acquire academic knowledge,
open-mind to approach new things, and be straightforward to express ideas. I’ve
guided by open-mind lecturers who always encourage us to express our opinions and
discuss it. This is really quality and extensive course. We’re encouraged to be
ourselves and be self-confident to discuss ideas, it’s really meaningful thing.
Sincerely, I would like to take this opportunity to express my honest thanks to the
Vietnam-Netherlands Master Program for Economics of Development for the
interesting and extensive curriculum, as well as sincere thanks to all of people who
engage in this course such as management board of this program, lecturers, tutors.
To fulfill this course, I’ve received the help and support from many people such as
director and vice director of this program, lecturers, tutors, my supervisor,
classmates, friends, course administrators, librarians of MDE & Fulbright, and other
people who give me the instructions, comments, advices, supports, sympathies, and
encouragement during the course process. Without these things, I could not fulfill
the Thesis and finish the course.
First of all, I would like to express my gratitude to my supervisor – Dr. Nguyen
Minh Duc, who always remind me to finish the Thesis timely and make me
determine to finish the Thesis with high effort, very patient and sympathy with me
for delaying the time of submitting Thesis, spent his valuable time to help me, give
comments and correct the Thesis mistake by mistake. From bottom of my heart, I
sincerely thank him for all.
I would like to express my special thank to Dr Nguyen Trong Hoai - Director of the
Program, Vice Principal of UEH. He fosters us to study and finish the course
actively and efficiently, take care of us step by step. And special thanks to Dr Pham
Khanh Nam steps with us to overcome obstacles in thesis process honestly, give us
the valuable advices and encouragement to finish the thesis.
i
Thanks to TRD board defense give me valuable comments and advices to continue
this topic. Thanks to Dr Phan Minh Ngoc supplies me materials at my TRD time.
Thanks to Dr Le Dinh Truc gives me valuable comments and advice on panel
technique in Eview. And thanks to tutor Phung Thanh Binh for helping us honestly
in the course.
Thanks to all classmates in MDE-K16, all of you support me unconditionally with
discussions, talks, shared materials, team working playing, and other. Thanks to
friends Thu Huyen and Thanh Tien, your sharing materials are very useful for me.
Hope all of you fulfill this course and get success in your life.
Lastly, I would like to thank to my dear family, warm friends that supports and
sympathies with me for spending most time on studying this course.
Thanks all for all, hope you will be happy and successful in life.
I pledge to take full responsibilities for mistakes, errors, omissions and
shortcomings of the study.
ii
ABTRACT
This study based on the neoclassical growth theory, an extended version of this
model. As common trend, Cobb-Douglas production function is used to evaluate the
robustness of determinants of economic growth in a dataset of six Southeast Asian
countries from 1993 to 2009. The fixed effect model (FEM) is used to estimate this
model. The results indicate that the most important source of economic growth of
these countries is capital accumulation and labor.
Keywords: Economic growth, determinants, Capital, Labor, Population growth,
Government expenditure, Southeast Asian countries, Neoclassical Model, CobbDouglas production function, FEM.
iii
TABLE OF CONTENT
CHAPTER 1: INTRODUCTION .......................................................................... 1
1.1 Problem statement
1.2 Research structure
CHAPTER 2: RESEARCH OBJECTIVES & RESEARCH QUESTIONS ........ 5
2.1 Research objectives
2.2 Research questions
2.3 Research scope
2.4 Research contribution
CHAPTER 3: LITERATURE REVIEW ................................................................ 7
3.1 General Overview ................................................................................... 7
3.1.1 Concept and Definitions................................................................ 7
3.1.2 Traditional methods of examine determinants of economic growth 13
3.1.3 Measurement indicator group of development and growth .......... 14
3.1.4 Overview of economic development theory ................................ 15
3.1.4.1 Classify theories by time .............................................. 15
Classical theory
Neoclassical model
Endogenous Theory
3.1.4.2 Classify theory by four main classes ............................. 21
Linear stages of growth theory
Structural change theory
International dependence theory
Neoclassical counter revolution theory
3.2 Theoretical Framework ......................................................................... 26
3.2.1 Production function Cobb-Douglas ............................................. 26
3.2.2 Harrod-Domar Growth Model..................................................... 28
3.2.3 Neoclassical model-Solow model .............................................. 29
3.2.4 Capital Fundamentalism ............................................................. 30
iv
3.3 Empirical Review ................................................................................... 30
3.3.1 Development and growth of Vietnam and Southeast Asia ........... 30
3.3.2 Review the empirical studies ....................................................... 33
CHAPTER 4: RESEARCH METHODOLOGY .................................................. 39
4.1 Analyzed Framework ............................................................................. 39
4.1.1 Model 1- Traditional neoclassical model ..................................... 39
4.1.2 Model 2- Extend neoclassical model ........................................... 40
4.1.3 FEM is selection for estimation ................................................... 40
4.2 Variables ................................................................................................ 44
4.2.1 Dependent variable: GDP per capita ........................................... 44
4.2.2 Independent variables ................................................................. 44
4.3 Data Description - Data collection – Data analysis ................................. 50
CHAPTER 5: DATA ANALYSIS AND DISCUSSION ....................................... 52
5.1 Descriptive Statistics Analysis ................................................................ 52
5.1.1 Descriptive Statistics.......................................................................
5.1.2 Correlation Matrix ...................................................................... 54
5.2 Econometric Analysis ............................................................................ 54
5.2.1 Whether FEM or REM is more suitable ...................................... 54
5.2.2 Model 1 – Traditional model ....................................................... 58
5.2.3 Model 2 - The Extened Neoclassical Model ................................ 59
5.3 The limitations of data, and modeling techniques ................................... 61
CHAPTER 6: CONCLUSION AND POLICY RECOMMENDATION ............. 63
6.1 Main findings ......................................................................................... 63
6.2 Managerial Implications and Policies ..................................................... 64
6.3 Limitations and future research .............................................................. 65
REFERENCE ........................................................................................................ 67
APPENDICES ................................................................................................. 71
v
APPENDICES
A: Data of GDP, Capital, Population growth, Labor, Government expenditure ... 70
B: Descriptive statistics of each country ................................................................ 77
C: Correlation Matrixes of each country................................................................ 79
D: Residual Graph .................................................................................................. 81
E: Regression Results ............................................................................................. 82
F: Main Empirical studies Summary .................................................................... 92
E: Regression results .............................................................................................. 81
vi
LIST OF TABLES
Table 3.1: Sources of Growth in East Asia, by Country and Period ..................... 37
Table 4.1 Estimated Capital-Output ratio some Asian Countries 1980 ................. 45
Table 4.2 Range forecast of COR for 6 countries .................................................. 46
Table 4.3 Summary of variable .............................................................................. 49
Table 5.1 Sample observations - Descriptive statistics - sample: 1993 2009 .... 54
Table 5.2 Correlation on the sample observations ................................................. 54
Table 5.3 Model 1 - A comparison of results with FEM ....................................... 55
Table 5.4 HAUSMAN TEST for MODEL 1 ......................................................... 55
Table 5.5 Model 2 - A comparison of results with FEM ....................................... 57
Table 5.6 HAUSMAN TEST for MODEL 1 ......................................................... 57
Table 5.7 Estimated results for FEM with tradition model (Model 1) .................. 58
Table 5.8 Estimated results for FEM with extended model (Model 2) ................. 60
vii
LIST OF FIGURES
Figure 3.1: Population of 1993 of countries ............................................................... 9
Figure 3.2: Population of 2009 of countries ............................................................... 9
Figure 3.3: GDP per capita of 1993 of countries ...................................................... 10
Figure 3.4: GDP per capita of 2009 of countries ...................................................... 10
Figure 4.1: Conceptual Framework of the study....................................................... 39
Figure 5.1: GDP per capita of 6 countries for the period of 1993-2009 ................... 52
Figure 5.2: Capital per capita GDP per capita for the period of 1993-2009 ............. 53
Figure 6.1: An overview of determinants of economic growth of countries ............ 64
viii
ABBREVIATIONS
COR
: Capital output ratio
DCs
: Developed (high-income) countries
FEM
: The fixed effects method
GCF
: Gross Capital Formation
GFCF
: Gross fixed assets formation
GDP
: Gross Domestic Product
ICOR
: Incremental capital output ratio
LDCs
: Less developing countries
LICs
: Low-income countries
LSDV
: The least-squares dummy variable
OLS
: Ordinary Least Square
PCI
: Province Competitiveness Index
REM
: Random Effect Model
ix
CHAPTER 1: INTRODUCTION
1.1 Problem statement
The human kind history experienced a very long period of changing and developing
process. During a rapid development process since the century of 19th, with an
increasing growth in income and standard living, people’s welfare is improved
considerably. In second haft of the 20th century, most countries have doubled their
real income per capita when hand over from this generation to the next one. In
particular, the rise of East Asian economies so called “Miracle” opens up important
turning-point and attracts attentions of policies makers and researchers.
However, there are a lot of emerged questions such as:
(a) Why are some countries rich, and other poor? How some countries develop
very quickly and stably with their citizens enjoying rapid increases in their
average incomes, meanwhile others development are very slow or not at all?
Commented [m1]: So ambitious to solve in this study; should
delete
(b) What are the determinants of economic growth and the characteristics that
distinguish fast-growing from slower-growing countries?
And as can be seen, after thousands years of very slow economic growth, the world
economy suddenly experienced an enormous change explosion, but why it did not
occur earlier; and why it occurred where it did, this country instead of that country.
Normally, developed and developing countries focus on how to foster economy in
balance between fast growth and sustainable development. As a matter of fact, it’s
very challenging question and not easy to find out the unique solution. As there’s no
a general answer for growth problems of developing countries, economists suggest
some approaches to impulse the growth process. Firstly, that is applying open
commodities markets but isolating from international capital market in order to
stabilize and increase economic independence. Secondly, developing countries can
choose industrialization way by their own policies such as indirect subsidization.
Thirdly, they can combine these policies above depending on specific conditions of
1
Commented [m2]: Rewrite into one paragraph
each nation. However, the issue here that is developing countries need to consider
which best solutions they should choose to benefit economic most.
Since 1975, when being reunified, Vietnam had applied a central planning economic
system following Soviet model program named “Doi moi”
(1)
1986 to open out the
world and built a market-based economy. It began to step in a new page of history
onwards. As the result, Vietnam has achieved a high rate of economic growth to get
out the list of least developed nations. During the economic reform and growth,
capital accumulation and labor played main roles in a finding by Ngoc (2008) found
out. That contribution from other factors such as human capital and technological
progress are likely to be still limited. This statement is the same for other countries
in Southeast Asia. In order to achieve sustainable growth in coming years, some
researches (Ngoc, 2008) suggest that Vietnam should enforce their growth based on
a working productivity improvement.
Obviously, sustainable development and growth are very important for developing
countries, in particular Southeast Asia. The annual higher economic growth is
usually a good sign; however it’s not always mean this development is sustainable or
at good statement, vice versa it can be a bubble or overheating development.
However, the economic growth seems to be an important indicator for evaluating a
health of an economy. Because of importance of economic growth of a nation, my
study would like to experiment on the contribution of determinants such as capital,
labor, etc… to economic growth of Vietnam and other Southeast Asian countries
including Indonesia, Malaysia, the Philippine, Singapore, and Thailand through the
period 1993-2009. And I hope this paper can disclose a part of development picture
of Vietnam as well as Southeast Asia nations. Consequently, the suggestion for
_________________________
(1)
Doi moi is the name of policy change from a central planning economic system to market economy in
Vietnam in 1986.
2
implication policies can be made base on this research result. In particular, through
it, Vietnam can get the lessons for suggestions on the trend that Vietnam should
pursue for its long term stable development in coming years.
1.2 Research structure:
The content of this study is divided into 6 chapters:
Chapter I – Introduction
Chapter II – Research objectives and research questions
Chapter III – Literature review
Chapter IV – Research Methodology
Chapter V – Data analysis and discussion
Chapter VI – Conclusion and policy recommendation
The chapter I is introduction.
Chapter II determines the Research Objectives and Research Questions which this
study will carry out in next parts.
The very important content is Chapter III - Literature Review, reviews some
theoretical frameworks of economic development and growth. Throughout this
chapter will clarify the determinants for economic growth, especially capital and
labor. Moreover, this chapter review some related empirical studies which analysis
the relationship between factor accumulation, productivity growth and economic
growth.
Indispensably that is Part IV - the Research Methodology which, present the method
and procedure applied in this study to answer the Research Question.
The fifth part is Data Analysis and Discussion. It’s very important part, in which
analysis result will be presented through descriptive statistic analysis and
econometric analysis as well.
3
Continuously, chapter VI concerns conclusion, from these information to point out
suggestions that will help the economic growth of Southeast Asian generally and
Vietnam specifically achieve high and stability.
4
CHAPTER 2: RESEARCH OBJECTIVES AND RESEARCH
QUESTIONS
2.1 Research Objectives
The world experienced the fastest growth in the last half of the 20th century with the
“golden age” was 1950–73 when world economic growth per capita reached a
phenomenal 3 percent yearly. Specially, economic growth in developing countries
was much more rapid after World War II than ever before. This story of growth is
important as it helps determine whether societies can meet basic needs of food,
clothing, housing, health, literacy, and widen human’s choice to enable people to
control their environment, enjoy greater leisure, acquire learning, and use more
resources for aesthetics and humanistic endeavors. Therefore, as identified, the
general objective of this study has been conducted to figure out the contribution of
some main macro factors such as financial capital, labor, etc… to economic growth
of some Southeast Asian countries including Vietnam, Indonesia, Malaysia, the
Philippine, Singapore and Thailand through the period 1993-2009. It’s expected
to disclose the trend and the real situation of Vietnam’s economic growth as well as
some other Southeast Asian countries. Since then Vietnam can get lessons from
other countries’ development origin in this region; and suggest the trend that
Vietnam should pursue for the fast and sustainable development in the future.
2.2 Research Questions:
As the identified objective above, this study would like to discuss the following
important questions as follows:
[1] To what extent have capital, labor, population growth rate, and government
expenditure contributed to economic growth of Southeast Asian countries?
5
[2] In specific case, how growth factors such as capital, labor, population growth
rate, and government expenditure to industries contributed to economic growth
of Vietnam relative to some other countries in Southeast Asia?
[3] To recommend general policies for sustainable development in term of
economy and society of six Southeast Asian countries.
2.3 Research Scope:
This study is not ambitious for figuring out the detailed richness origin of Southeast
Asian countries. It just would like to present a general views for the trend of
economic growth of Southeast Asian territories, and examines determinants of
economic growth of few of these. Though out it, this study will propose implications
for achieving fast and sustainable economic growth for Vietnam as well as other
developing countries in this region.
2.4 Research Contribution:
There are many working papers research determinants of economic growth of
countries through out the world, but just few papers research on Vietnam case as
well as Southeast Asia. Most countries in this area are developing countries such as
Vietnam, Indonesia, Malaysia, and they always want to develop their own economy
in order to catch up developed ones in this area as well as the world. Thus, it’s
necessary to determine the robust factors that contribute to economic growth of
developing countries. Through it will support to decision makers to be aware of the
determinants of economic growth, then they can build appropriate plan to foster
country economy efficiently.
As mentioned above, because of non ambitious for pointing out the detailed origin
of richness, this study just hope to contribute partly in order to examine and
determine the main determinants of economic growth of some nations in Southeast
Asia including Vietnam.
6
CHAPTER 3: LITERATURE REVIEW
3.1 GENERAL THEORY
3.1.1 Definitions
a) Economic growth – Economic development – Sustainable development.
Economic growth is the growth rate in gross product or income per capita
(Nafziger, 2006), an increase in a country’s output per capita. Similarly, economic
growth happens if output increases faster than population. It should be understood as
changing process that creates higher real output per capita. Furthermore, this process
makes changes in quantity and quality of production and expenditure structure.
In order to measure economic growth, economists usually use data on GDP, which
measures the total income of everyone in the economy. It often refers to real GDP
growth of a region, or industry sector’s real income increases. At the country level,
economic growth is often measured by the growth rate of a country’s annual GDP.
One of other important economic term is economic development. It references to
economic growth accompanied by changes in output distribution as well as
economic structure. It is economic growth leading to an improvement in the
economic welfare of the poorest segment of the population or changes in educational
level,
output
distribution,
and
economic
structural
change.
It
includes
comprehensive changes in politics, culture, society, and institution.
Another popular economic term is sustainable development that was coined in the
1987 at UN Commission on Environment and Development, it refers to the progress
meets the needs of the present without compromising the ability of next generations
to meet their own needs. Till the conference in Rio de Janerio 1992, economists
define sustainable development is development to meet present need but don’t make
a bad effect to next generations. In addition, sustainability means not only the
survival of the human species but also maintaining the productivity of natural,
7
produced, and human resources from generation to generation (E. Wayne Nafziger,
2006).
b) Government Expenditure
Barro (1996) specified the government expenditure can be applied in the model by
the ratio of government expenditure (exclusive of spending on education and
defense) to GDP, and this particular measure of government spending is intended to
approximate the outlays that do not enhance productivity. The common conclusion
for this independent variable is a greater volume of nonproductive government
spending, reduce the growth rate for given starting value of GDP. In this sense, a big
government is bad for growth.
c) Output
GDP is a general indicator reflecting the final results (output) of production and
business activities of the economy in a given period. The measure of aggregate
output in the nation is GDP.
When we conduct a research for across countries, we should use output per capita
instead of total output. There’re two reasons for looking at the numbers for output
per capita rather than for total output. The first, the evolution of the living standard
is giving by the evolution of output per capita, not a country’s total output.
Secondly, when comparing countries with different populations, output numbers
must be adjusted to take into account these differences in population size of
countries. Therefore, this is exactly what output per capita does (Blanchard, 2009).
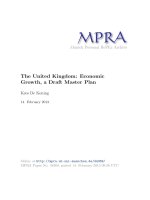
Here’s the population of 6 Southeast Asian countries in 1993 and 2009. Through it,
Indonesia has the biggest population, has 186.7 mil people in 1993 and reach up
229.9 mil people in 2009, in creased by 23%. Next, in descending order of
population size, the Philippines increased by 37%, Vietnam 25%, Thailand 15%,
Malaysia 40%, and Singapore 45%.
8
\
3.1
3.2
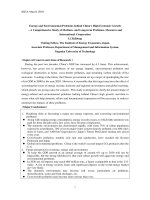
While the level of GDP per capital at constant price 2005 of each countries seem
vices versa the population size. Singapore is the top of highest, it leaves a big gap to
the next one is Malaysia. The lowest GDP per capita in these times is Vietnam.
Surprisingly, the order or these countries doesn’t change from 1993 to 2009.
9
3.3
3.4
d) Population and population growth rate
Population of a country is simple the number of citizens of this country in a
considered time. And population growth rate is increasing or declining percent of
population of a country in a year compare with root year, with expected sign is
negative. It’s because that a higher rate of population growth have a negative
effective on GDP per capita. Moreover, a higher population rate means that
increased resources must be devoted to childrearing rather than to production of
10
goods (Barro, 1996). Similarly, another research of Mankiw et al. (1992) found that
higher population growth lowers measured total factor productivity.
Increased urbanization and congestion, rapid labor force growth, growing
unemployment, and high dependency burdens are some major costs of high fertility
rates and rapid population growth. Contemporary LDC population growth has been
faster than that of the DCs during their early transitional period because of a sharper
drop in mortality rates in LDCs. Today’s developing countries were able to take
advantage of advances in food production, new pesticides, improvements in
transport and communication, improved nutrition, better personal hygiene, medical
innovations, and immunization in a short time – many of which were not available to
DCs during their early demographic transition
Fertility decreases with economic development, urbanization, industrialization,
mobility, literacy, female labor force participation, reduced income inequality, and
greater family-planning efforts. But, these efforts are not likely to be successful
unless socioeconomic development and improved income distribution make birth
control seem advantageous.
e) Labor
In this study, Labor force or so-called economically active population, it refers to
people have age from 15 and above of a country annually, and includes employed
and unemployed people:
+ Employment force refers to people who have job or business but are absent in
temporary because of illness, accident or other reasons.
+ Unemployment force mentions to people who don’t have a job or work or never
have a job but are available for work and looking for job.
f) Capital stock
At any moment, the capital stock is a key determinant of an economy’s output, in
particular developing countries. It can change over time and these changes can effect
11
on economic growth obviously. Two factors influence capital stock are investment
and depreciation. The investment refers to the expenditure on new plant, building
and equipment, and it causes rise of physical capital. Meanwhile, the depreciation
refers to the wear of old capital and it causes the fall of the physical capital
(Mankiw, 2009). According to Nafziger (2006), capital stock is total of previous
gross capital investments minus physical capital consumption (depreciation), natural
capital depletion, and environmental capital damage. T.T Dat (2004) explained that
physical capital includes inventories and fixed capital. With the inventories comprise
raw materials, tools, finished goods and semi-finished. And fixed capital includes
plant, buildings and other constructions; land improvement, plantation and orchard,
transport vehicles; machinery and equipment, breeding stock, animals, dairy cattle.
In general, physical capital is investment accumulation after taking account of
depreciation. Further more, it needs to distinguish Gross Capital Formation (GCF)
from capital stock. According to GSO 2009:
GCF = gross fixed assets formation (GFCF) + change in inventory.
Many researches indicate that capital deepening explains more than half of the
growth rate of output per worker in a majority of countries such as Charles R.
Hulten et al (2007) researched over 100 countries through out the world.
g) Human Capital
The set of skills of the workers in the economy what economists call is human
capital. Obviously, an economy with many highly skilled is like to be much more
productive than an economy in which most workers cannot read or write. The
increase in human capital has been as large as the increase in physical capital in
recent decades.
Human capital is investment expenditures in the education, training, research, and
health of people that increase their income or productive capacity” (Nafziger, 2006).
It refers to anything that can push on higher productivity, including education and
training, physical fitness and healthiness (Jacobsen, 1998). Regarding to education
12
and training, a higher educational attainment indicates higher quality of workers.
Thus, one respect of human capital is generally measured through average years of
schooling of the working population, the rate between the numbers of professional
secondary school/college/university students and total labor force. Respect of people
health can be measured by life expectancy, etc.
h) Technological Progress
The efficiency of labor is meant to reflect society’s knowledge about production
methods: as the available technology improvements, the efficiency of labor rises
(Mankiw, 2009). According to the Solow model, only technological progress can
explain persistently rising living standards.
Blanchard (2009) defined technological progress has many dimensions such as it
may mean larger quantities of output for given quantities of capital and labor, better
products, new products, or a larger of variety of products. Most technological
progress in modern economies is the result of the outcome of research &
development (R&D) activities. The level of R&D spending depends not only on the
fertility of the research process but also on the appropriability of research results. If
a firm cannot appropriate the profit from development of new products, they will not
engage in R&D and technological progress will be slow
3.1.2 Traditional methods of examine determinants of economic growth
There have been various research measuring the determinants of economic growth
regarding to physical capital, labor, human capital, TFP, fertility rate, government
consumption, the-rule-of-law-index, term of trade, ratio of investment to output,
R&D, … (Barro, 1996). Besides, there are many models are applied to estimate
determinants such as Neoclassical in particular Solow’s model, Endogenous models
of Romer 1986 and Lucas 1988, Harrod-Domar Model, … with estimation of times
series, cross section or panel data. In addition, production function Cobb-Douglas
usually is used to modify and apply in such researches.
13
Moreover, when we conduct a research for across countries, we should use output
per capita instead of total output. There’re two reasons for looking at the numbers
for output per capita rather than for total output. The first, the evolution of the living
standard is giving by the evolution of output per capita, not a country’s total output.
Secondly, when comparing countries with different populations, output numbers
must be adjusted to take into account these differences in population size of
countries. Therefore, this is exactly what output per capita does (Blanchard,
2009:204). In other words, countries clearly differ in population size, thus a natural
starting point is to normalize country output by scaling by population or number of
workers (King and Revine, 1994). This point is very important for this study bases
on.
In order to measure fairly most respects of economic growth, a research should
measure respects of economics, society, and environment. Furthermore, in each
these respects, all main factors should not omit. Regarding economic respect, some
common variable are measured such as GDP or GDP per capita, physical capital or
physical capital per capita... Social aspect comprises of labor, fertility rate,
unemployment rate, human development index, gender development Index … There
are also some variables of environmental issues such as CO2 emissions per capita, or
environmental sustainability index (ESI)…
3.1.3 Measurement indicator group of development and growth
Economists researched to build up indicators which measure growth and
development. There are many way to category indicators. Commonest way is be
divided into three groups: economic group, social group, and environmental group.
Firstly, regarding economic indicator group, economists and researcher usually use
some indicators to measure growth and development such as growth-evaluation
indicators (GDP, GNP, and economic growth rate), competition capacity-evaluation
of import-export goods and GDP, density of total value of import-export services
and GDP, density of direct investment and GDP, etc).
14
Secondly, that is social indicators with labor and employment measurement (labor,
unemployment rate, employment rate, etc), indicators for poverty and inequality
(poverty gap index, squared poverty gap index, poverty mapping, poverty and
richness ranking, ect), or indicators for human development (HDI-Human
development Index, GDI-Gender development Index).
The third is environmental indicator group with environmental quality evaluation
index following millennium development goals (MDGs) or environmental
sustainability index (ESI).
Generally, these three indicator groups quantize result of growth and development of
a nation or territory on all three respects: economic, society, and environment.
Economists and policy makers use these indicators to analyze and evaluate the
development status of country, since then propose appropriate development policies.
As a matter of fact, it’s available a lot of indicators and many ways to classify
indicator by group, mentioned above are just very common indicators, does not
include all.
3.1.4 Overview of economic development theory
3.1.4.1 Classify theories by time
The developing process of development theories by time is a process to look for the
answer for the origin of richness of countries. Adam Smith is a person who go along
with the development history of economic theories, we can divide it into three
periods are classical, neoclassical, and endogenous theory (growth theory). The first
period that is classical theory with analysis based on the works of late of 18 th and
19th century, British economists such as Adam Smith, David Ricardo, and Thomas
Malthus who believed in natural law, government non-interference (laissez faire),
and diminishing returns from population growth. The next is neoclassical theory of
growth with Robert Solow is typical. Solow’s theory of growth stressed the
importance of savings, capital formation for economic development, and for
empirical measures of the sources of growth. The last, new growth theory is a theory
15