Industrial Ecology: An Introduction
Bạn đang xem bản rút gọn của tài liệu. Xem và tải ngay bản đầy đủ của tài liệu tại đây (228.1 KB, 32 trang )
Pollution Prevention
and Industrial Ecology
NATIONAL POLLUTION PREVENTION CENTER FOR HIGHER EDUCATION
Industrial Ecology:
An Introduction
By Andy Garner, NPPC Research Assistant; and
Gregory A. Keoleian, Ph.D., Assistant Research Scientist,
University of Michigan School of Natural Resources and
Environment, and NPPC Research Manager
Background ................................................................. 2
Industrial Ecology: Toward a Definition ................... 3
Historical Development......................................... 3
Defining Industrial Ecology ................................... 4
Teaching Industrial Ecology .................................. 4
Industrial Ecology as a Field of Ecology .............. 5
Goals of Industrial Ecology ........................................ 5
Sustainable Use of Resources ............................. 6
Ecological and Human Health .............................. 6
Environmental Equity............................................ 6
Key Concepts of Industrial Ecology ......................... 6
Systems Analysis .................................................. 6
Material & Energy Flows & Transformations ........ 6
Multidisciplinary Approach .................................. 10
Analogies to Natural Systems ............................ 10
Open- vs. Closed-Loop Systems ........................ 11
Strategies for Environmental Impact Reduction:
Industrial Ecology as a Potential Umbrella
for Sustainable Development Strategies ................. 12
System Tools to Support Industrial Ecology .......... 12
Life Cycle Assessment ....................................... 12
Components ........................................................ 13
Methodology ........................................................ 13
Applications ......................................................... 20
Difficulties ............................................................ 20
Life Cycle Design & Design for Environment ....... 21
Needs Analysis .................................................... 21
Design Requirements ......................................... 21
Design Strategies ............................................... 24
Design Evaluation ............................................... 25
Future Needs ............................................................. 26
Further Information .................................................. 26
Endnotes .................................................................... 27
Appendix A: Industrial Symbiosis at Kalundborg .. 28
Appendix B: Selected Definitions ........................... 31
List of Tables
Table 1: Organizational Hierarchies ................................. 2
Table 2: Worldwide Atmospheric Emissions of
Trace Metals (Thousand Tons/Year) ................... 9
Table 3: Global Flows of Selected Materials .................... 9
Table 4: Resources Used in Automaking ........................ 10
Table 5: General Difficulties and Limitations of
the LCA Methodology ....................................... 20
Table 7: Issues to Consider When Developing
Environmental Requirements ........................... 23
Table 8: Strategies for Meeting Environmental
Requirements ................................................... 24
Table 9: Definitions of Accounting and Capital
Budgeting Terms Relevant to LCD ................... 25
List of Figures
Figure 1: The Kalundborg Park ....................................... 3
Figure 2: World Extraction, Use, and Disposal
of Lead, 1990 (thousand tons) ......................... 7
Figure 3: Flow of Platinum Through Various Product
Systems ........................................................... 8
Figure 4: Arsenic Pathways in U.S., 1975. ...................... 8
Figure 5: System Types ................................................ 11
Figure 6: Technical Framework for LCA ........................ 13
Figure 7: The Product Life Cycle System ...................... 14
Figure 9: Flow Diagram Template ................................. 15
Figure 8: Process Flow Diagram ................................... 15
Figure 10: Checklist of Criteria With Worksheet ............. 16
Figure 11: Detailed System Flow Diagram for Bar Soap .. 18
Figure 12: Impact Assessment Conceptual Framework .. 19
Figure 13: Life Cycle Design ........................................... 22
Figure 14: Requirements Matrices .................................. 23
National Pollution Prevention Center for Higher Education • University of Michigan
Dana Building, 430 East University, Ann Arbor MI 48109-1115
734.764.1412 • fax 734.647.5841 • • www.umich.edu/~nppcpub
May be reproduced
freely for non-commercial
educational purposes.
Introduction • 1
November 1995
This portion of the industrial ecology compendium
provides an overview of the subject and offers guidance
on how one may teach it. Other educational resources
are also emerging. Industrial Ecology (Thomas Graedel
and Braden Allenby; New York: Prentice Hall, 1994),
the first university textbook on the topic, provides a
well-organized introduction and overview to industrial
ecology as a field of study. Another good textbook is
Pollution Prevention: Homework and Design Problems for
Engineering Curricula (David T. Allen, N. Bakshani, and
Kirsten Sinclair Rosselot; Los Angeles: American Institute of Chemical Engineers, American Insttute for Pollution Prevention, and the Center for Waste Reduction
Technologies, 1993). Both serve as excellent sources of
both qualitative and quantitative problems that could
be used to enhance the teaching of industrial ecology
concepts. Other sources of information are noted elsewhere in this introduction and in the accompanying
“Industrial Ecology Resource List.”
Background
The development of industrial ecology is an attempt to
provide a new conceptual framework for understanding
the impacts of industrial systems on the environment
(see the “Overview of Environmental Problems” section
of this compendium). This new framework serves to
identify and then implement strategies to reduce the
environmental impacts of products and processes
associated with industrial systems, with an ultimate
goal of sustainable development.
Industrial ecology is the study of the physical, chemical,
and biological interactions and interrelationships both
within and between industrial and ecological systems.
Additionally, some researchers feel that industrial ecology involves identifying and implementing strategies
for industrial systems to more closely emulate harmonious, sustainable, ecological ecosystems. 1
Environmental problems are systemic and thus require
a systems approach so that the connections between industrial practices/human activities and environmental/
ecological processes can be more readily recognized.
A systems approach provides a holistic view of environmental problems, making them easier to identify
and solve; it can highlight the need for and advantages
of achieving sustainability. Table 1 depicts hierarchies
of political, social, industrial, and ecological systems.
Industrial ecology studies the interaction between different industrial systems as well as between industrial
systems and ecological systems. The focus of study
can be at different system levels.
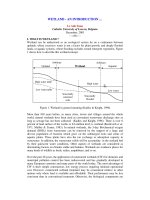
One goal of industrial ecology is to change the linear
nature of our industrial system, where raw materials
are used and products, by-products, and wastes are
produced, to a cyclical system where the wastes are
reused as energy or raw materials for another product
or process. The Kalundborg, Denmark, eco-industrial
park represents an attempt to create a highly integrated
industrial system that optimizes the use of byproducts
and minimizes the waste that that leaves the system.
Figure 1 shows the symbiotic nature of the Kalundborg
park (see Appendix A for a more complete description).
Fundamental to industrial ecology is identifying and
tracing flows of energy and materials through various
systems. This concept, sometimes referred to as industrial metabolism, can be utilized to follow material and
energy flows, transformations, and dissipation in the
industrial system as well as into natural systems.2
The mass balancing of these flows and transformations
can help to identify their negative impacts on natural
ecosystems. By quantifying resource inputs and the
generation of residuals and their fate, industry and
other stakeholders can attempt to minimize the environmental burdens and optimize the resource efficiency of
material and energy use within the industrial system.
TABLE 1: ORGANIZATIONAL HIERARCHIES
Political
Entities
UNEP
U.S. (EPA, DOE)
State of Michigan
(Michigan DEQ)
Washtenaw County
City of Ann Arbor
Individual Voter
Social
Organizations
Industrial
Organizations
World population
Cultures
Communities
Product systems
Households
Individuals/
Consumbers
ISO
Trade associations
Corporations
Divisions
Product development teams
Individuals
Industrial
Systems
Global human material
and energy flows
Sectors (e.g., transportation or health care)
Corporations/institutions
Product systems
Life cycle stages/unit steps
Ecological
Systems
Ecosphere
Biosphere
Biogeographical
region
Biome landscape
Ecosystem
Organism
Source: Keoleian et al., Life Cycle Design Framework and Demonstration Projects (Cincinnati: U.S. EPA Risk Reduction Engineering Lab, 1995), 17.
2 • Introduction
November 1995
FIGURE 1: THE KALUNDBORG PARK
Industrial ecology is an emerging field. There is much
discussion and debate over its definition as well as its
practicality. Questions remain concerning how it overlaps with and differs from other more established fields
of study. It is still uncertain whether industrial ecology
warrants being considered its own field or should be
incorporated into other disciplines. This mirrors the
challenge in teaching it. Industrial ecology can be taught
as a separate, semester-long course or incorporated into
existing courses. It is foreseeable that more colleges
and universities will begin to initiate educational and
research programs in industrial ecology.
Industrial Ecology: Toward a Definition
Historical Development
Industrial ecology is rooted in systems analysis and
is a higher level systems approach to framing the interaction between industrial systems and natural systems.
This systems approach methodology can be traced to
the work of Jay Forrester at MIT in the early 1960s and
70s; he was one of the first to look at the world as a
series of interwoven systems (Principles of Systems,
1968, and World Dynamics, 1971; Cambridge, WrightAllen Press). Donella and Dennis Meadows and others
furthered this work in their seminal book Limits to
Growth (New York: Signet, 1972). Using systems
analysis, they simulated the trends of environmental
degradation in the world, highlighting the unsustainable
course of the then-current industrial system.
In 1989, Robert Ayres developed the concept of
industrial metabolism: the use of materials and energy
by industry and the way these materials flow through
industrial systems and are transformed and then
dissipated as wastes.3 By tracing material and energy
flows and performing mass balances, one could identify
inefficient products and processes that result in industrial waste and pollution, as well as determine steps to
reduce them. Robert Frosch and Nicholas Gallopoulos,
in their important article “Strategies for Manufacturing”
(Scientific American 261; September 1989, 144–152),
developed the concept of industrial ecosystems, which
led to the term industrial ecology. Their ideal industrial
ecosystem would function as “an analogue” of its biological counterparts. This metaphor between industrial
and natural ecosystems is fundamental to industrial
ecology. In an industrial ecosystem, the waste produced
by one company would be used as resources by another.
No waste would leave the industrial system or negatively impact natural systems.
Introduction • 3
November 1995
In 1991, the National Academy of Science’s Colloqium
on Industrial Ecology constituted a watershed in the
development of industrial ecology as a field of study.
Since the Colloqium, members of industry, academia
and government have sought to further characterize
and apply it. In early 1994, The National Academy of
Engineering published The Greening of Industrial Ecosystems (Braden Allenby and Deanna Richards, eds.).
The book brings together many earlier initiatives and
efforts to use systems analysis to solve environmental
problems. It identifies tools of industrial ecology, such
as design for the environment, life cycle design, and
environmental accounting. It also discusses the interactions between industrial ecology and other disciplines
such as law, economics, and public policy.
Industrial ecology is being researched in the U.S. EPA’s
Futures Division and has been embraced by the AT&T
Corporation. The National Pollution Prevention Center
for Higher Education (NPPC) promotes the systems
approach in developing pollution prevention (P2) educational materials. The NPPC’s research on industrial
ecology is a natural outgrowth of our work in P2.
Defining Industrial Ecology
There is still no single definition of industrial ecology
that is generally accepted. However, most definitions
comprise similar attributes with different emphases.
These attributes include the following:
• a systems view of the interactions between
industrial and ecological systems
• the study of material and energy flows and
transformations
• a multidisciplinary approach
• an orientation toward the future
• a change from linear (open) processes to
cyclical (closed) processes, so the waste from
one industry is used as an input for another
• an effort to reduce the industrial systems’
environmental impacts on ecological systems
• an emphasis on harmoniously integrating
industrial activity into ecological systems
• the idea of making industrial systems emulate
more efficient and sustainable natural systems
• the identification and comparison of industrial and
natural systems hierarchies, which indicate areas of
potential study and action (see Table 1).
4 • Introduction
November 1995
There is substantial activity directed at the product
level using such tools as life cycle assessment and life
cycle design and utilizing strategies such as pollution
prevention. Activities at other levels include tracing
the flow of heavy metals through the ecosphere.
A cross-section of definitions of industrial ecology is
provided in Appendix B. Further work needs to be
done in developing a unified definition. Issues to
address include the following.
• Is an industrial system a natural system?
Some argue that everything is ultimately natural.
• Is industrial ecology focusing on integrating industrial systems into natural systems, or is it primarily
attempting to emulate ecological systems? Or both?
• Current definitions rely heavily on technical, engineered solutions to environmental problems. Some
authors believe that changing industrial systems will
also require changes in human behavior and social
patterns. What balance between behavioral changes
and technological changes is appropriate?
• Is systems analysis and material and energy
accounting the core of industrial ecology?
Teaching Industrial Ecology
Industrial ecology can be taught as a separate course
or incorporated into existing courses in schools of engineering, business, public health and natural resources.
Due to the multidisciplinary nature of environmental
problems, the course can also be a multidisciplinary offering; the sample syllabi offered in this compendium
illustrate this idea. Degrees in industrial ecology
might be awarded by universities in the future.4
Chauncey Starr has written of the need for schools of
engineering to lead the way in integrating an interdisciplinary approach to environmental problems in the
future. This would entail educating engineers so that
they could incorporate social, political, environmental
and economic factors into their decisions about the uses
of technology. 5 Current research in environmental
education attempts to integrate pollution prevention,
sustainable development, and other concepts and
strategies into the curriculum. Examples include
environmental accounting, strategic environmental
management, and environmental law.
Industrial Ecology as a Field of Ecology
The term “Industrial Ecology” implies a relationship to
the field(s) of ecology. A basic understanding of ecology
is useful in understanding and promoting industrial
ecology, which draws on many ecological concepts.
Ecology has been defined by the Ecological Society of
America (1993) as:
The scientific discipline that is concerned
with the relationships between organisms and
their past, present, and future environments.
These relationships include physiological responses of individuals, structure and dynamics
of populations, interactions among species,
organization of biological communities, and
processing of energy and matter in ecosystems.
Further, Eugene Odum has written that:
... the word ecology is derived from the
Greek oikos, meaning “household,” combined
with the root logy, meaning “the study of.”
Thus, ecology is, literally the study of households including the plants, animals, microbes,
and people that live together as interdependent
beings on Spaceship Earth. As already, the
environmental house within which we place
our human-made structures and operate our
machines provides most of our vital biological
necessities; hence we can think of ecology as
the study of the earth’s life-support systems.6
In industrial ecology, one focus (or object) of study is
the interrelationships among firms, as well as among
their products and processes, at the local, regional,
national, and global system levels (see Table 1). These
layers of overlapping connections resemble the food
web that characterizes the interrelatedness of organisms
in natural ecological systems.
Industrial ecology perhaps has the closest relationship
with applied ecology and social ecology. According to
the Journal of Applied Ecology, applied ecology is:
. . . application of ecological ideas, theories
and methods to the use of biological resources
in the widest sense. It is concerned with the
ecological principles underlying the management, control, and development of biological
resources for agriculture, forestry, aquaculture,
nature conservation, wildlife and game management, leisure activities, and the ecological effects
of biotechnology.
The Institute of Social Ecology’s definition of social
ecology states that:
Social ecology integrates the study of human
and natural ecosystems through understanding
the interrelationships of culture and nature. It
advances a critical, holistic world view and suggests that creative human enterprise can construct
an alternative future, reharmonizing people’s relationship to the natural world by reharmonizing
their relationship with each other.7
Ecology can be broadly defined as the study of the interactions between the abiotic and the biotic components of a system. Industrial ecology is the study of the
interactions between industrial and ecological systems;
consequently, it addresses the environmental effects on
both the abiotic and biotic components of the ecosphere.
Additional work needs to be done to designate industrial ecology’s place in the field of ecology. This will
occur concurrently with efforts to better define the
discipline and its terminology.
There are many textbooks that introduce ecological
concepts and principles. Examples include Robert
Ricklefs’ Fundamentals of Ecology (3rd edition; New York:
W. H. Freeman and Company, 1990), Eugene Odum’s
Ecology and Our Endangered Life-Support Systems, and
Ecology: Individuals, Populations and Communities by
Michael Begens, John Harper, and Colin Townsend
(London: Blackwell Press, 1991).
Goals of Industrial Ecology
The primary goal of industrial ecology is to promote
sustainable development at the global, regional, and
local levels. 8 Sustainable development has been
defined by the United Nations World Commission on
Environment and Development as “meeting the needs
of the present generation without sacrificing the needs
of future generations.”9 Key principles inherent to
sustainable development include: the sustainable use
of resources, preserving ecological and human health
(e.g. the maintenance of the structure and function
of ecosystems), and the promotion of environmental
equity (both intergenerational and intersocietal).10
Introduction • 5
November 1995
Sustainable Use of Resources
Industrial ecology should promote the sustainable
use of renewable resources and minimal use of nonrenewable ones. Industrial activity is dependent on a
steady supply of resources and thus should operate as
efficiently as possible. Although in the past mankind
has found alternatives to diminished raw materials,
it can not be assumed that substitutes will continue to
be found as supplies of certain raw materials decrease
or are degraded. 11 Besides solar energy, the supply of
resources is finite. Thus, depletion of nonrenewables
and degradation of renewables must be minimized in
order for industrial activity to be sustainable in the
long term.
Ecological and Human Health
Human beings are only one component in a complex
web of ecological interactions: their activities cannot
be separated from the functioning of the entire system.
Because human health is dependent on the health of
the other components of the ecosystem, ecosystem
structure and function should be a focus of industrial
ecology. It is important that industrial activities do not
cause catastrophic disruptions to ecosystems or slowly
degrade their structure and function, jeopardizing the
planet’s life support system.
Environmental Equity
A primary challenge of sustainable development is
achieving intergenerational as well as intersocietal
equity. Depleting natural resources and degrading
ecological health in order to meet short-term objectives
can endanger the ability of future generations to meet
their needs. Intersocietal inequities also exist, as evidenced by the large imbalance of resource use between
developing and developed countries. Developed
countries currently use a disproportionate amount of
resources in comparison with developing countries.
Inequities also exist between social and economic
groups within the U.S.A. Several studies have shown
that low income and ethnic communities in the U.S.,
for instance, are often subject to much higher levels
of human health risk associated with certain toxic
pollutants. 12
6 • Introduction
November 1995
Key Concepts of Industrial Ecology
Systems Analysis
Critical to industrial ecology is the systems view of
the relationship between human activities and environmental problems. As stated earlier, industrial ecology
is a higher order systems approach to framing the
interaction between industrial and ecological systems.
There are various system levels that may be chosen as
the focus of study (see Table 1). For example, when
focusing at the product system level, it is important to
examine relationships to higher-level corporate or institutional systems as well as at lower levels, such as the
individual product life cycle stages. One could also
look at how the product system affects various ecological
systems ranging from entire ecosystems to individual
organisms. A systems view enables manufacturers to
develop products in a sustainable fashion. Central to
the systems approach is an inherent recognition of the
interrelationships between industrial and natural systems.
In using systems analysis, one must be careful to avoid
the pitfall that Kenneth Boulding has described:
seeking to establish a single, self-contained
‘general theory of practically everything’ which
will replace all the special theories of particular
disciplines. Such a theory would be almost
without content, for we always pay for generality by sacrificing content, and all we can say
about practically everything is almost nothing. 13
The same is true for industrial ecology. If the scope of
a study is too broad the results become less meaningful;
when too narrow they may be less useful. Refer to
Boulding’s World as a Complete System (London: Sage,
1985) for more about systems theory; see Meadows et
al.’s Limits to Growth (New York: Signet, 1972) and
Beyond the Limits (Post Mills, VT: Chelsea Green, 1992)
for good examples of how systems theory can be used
to analyze environmental problems on a global scale.
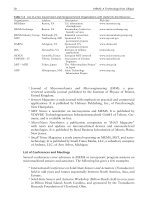
Material and Energy Flows
and Transformations
A primary concept of industrial ecology is the study
of material and energy flows and their transformation
into products, byproducts, and wastes throughout
industrial systems. The consumption of resources is
inventoried along with environmental releases to air,
water, land, and biota. Figures 2, 3, and 4 are examples
of such material flow diagrams.
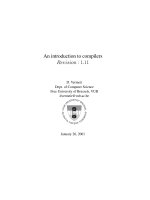
One strategy of industrial ecology is to lessen the
amount of waste material and waste energy that is
produced and that leaves the industrial system, subsequently impacting ecological systems adversely. For
instance, in Figure 3, which shows the flow of platinum
through various products, 88% of the material in automotive catalytic converters leaves this product system
as scrap. Recycling efforts could be intensified or other
uses found for the scrap to decrease this waste. Efforts
to utilize waste as a material input or energy source for
some other entity within the industrial system can potentially improve the overall efficiency of the industrial
system and reduce negative environmental impacts.
The challenge of industrial ecology is to reduce the
overall environmental burden of an industrial system
that provides some service to society.
RECYCLED
2600
BATTERIES
3700
TOTAL
ANNUAL
CONSUMPTION
5800
REFINED
LEAD
3300
WASTE and
DISCARDED BATTERIES
1300 ± 200
Solder and Miscellaneous 400
Cable Sheathing 300
Rolled and Extruded Products 500
Shot and Ammo 150
PIGMENTS 750
Lead in Gasoline ~ 100
Refining Waste ~ 50
Mining Waste ?
FIGURE 2: WORLD EXTRACTION, USE, AND DISPOSAL OF LEAD, 1990 (THOUSAND TONS)
R. Socolow, C. Andews, F. Berkhout, and V. Thomas, eds., Industrial Ecology and Global Change (New York: Cambridge University Press, 1994).
Reprinted with permission from the publisher. Data from International Lead and Zinc Study Group, 1992.
Introduction • 7
November 1995
Ore,
20 Billion
Tons
100%
➝
Metal
➝ Fabrication
60%
Metal
Products
100%
of Plant
Waste
100%
➝
Mining and
Refining
Platinum
Group
Metals,
143 tons
Waste
40%
Chemical
Conversion for
➝ Catalysis and
Other Uses
85%
➝
Automotive
Catalyst
Manufacture
➝
Automotive
Catalytic
Converters
4%
11%
Chemical
Catalysts and
Chemicals
85%
➝
88%
Petroleum
Catalysts
12%
Recycled
97%
FIGURE 3: FLOW OF PLATINUM THROUGH VARIOUS PRODUCT SYSTEMS
Source: R. A. Frosch and N. E. Gallopoulos, “Strategies for Manufacturing” Scientific American 261 (September 1989), p. 150.
From Air
ATMOSPHERE
Vulcanism
LAND
Ores
9,750
INDUSTRIAL ECONOMY
9,300
Copper
Mining
Copper
Smelting
Leach Liquor Flue Dust 10,600
9,700
Slag 3,700
43,000
In Soil
OCEAN
Airborne
100
Pesticides 2,500
Other 1,200
Fossil Fuel
Combustion
Pesticides
Herbicides
Fertilizers
etc.
Fly Ash
2,000
Pesticides 11,600
Other 5,400
Coal and
Oil
Extraction
Waterborne
Wastes 100
Detergents 120
Other 40
Weathering of Rock 2,000
BIOSHPERE
Land Vegetation
Land Animals
Marine Vegatation
Marine Animals
SEDIMENTS
FIGURE 4: SIMPLIFIED REPRESENTATION OF ARSENIC PATHWAYS IN THE U.S. (METRIC TONS), 1975.
Source: Ayres et al. (1988).
8 • Introduction
November 1995
TABLE 2: WORLDWIDE ATMOSPHERIC EMISSIONS OF TRACE METALS (THOUSAND TONNES/YEAR)
Element
Energy
production
Smelting,
refining,
and mining
1.3
2.2
0.8
12.7
8.0
12.7
12.1
2.3
42.0
3.9
1.1
3.3
84.0
16.8
1.5
12.4
5.4
–
23.6
49.1
3.2
0.1
4.8
2.3
–
1.1
0.1
72.5
Antimony
Arsenic
Cadmium
Chromium
Copper
Lead
Manganese
Mercury
Nickel
Selenium
Thallium
Tin
Vanadium
Zinc
Commercial uses,
Total
Manufacturing
incineration,
anthropogenic
processes
and transit
contributions
–
2.0
0.6
17.0
2.0
15.7
14.7
–
4.5
–
4.0
–
0.7
33.4
0.7
2.3
0.8
0.8
1.6
254.9
8.3
1.2
0.4
0.1
–
0.8
1.2
9.2
3.5
19.0
7.6
31.0
35.0
332.0
38.0
3.6
52.0
6.3
5.1
5.1
86.0
132.0
Total
contributions by
natural activities
2.6
12.0
1.4
43.0
28.0
12.0
317.0
2.5
29.0
10.0
–
–
28.0
45.0
Source: J.O. Nriagu, “Global Metal Pollution: Poisoning the Biosphere?” Nature 338 (1989): 47–49. Reproduced with permission of Haldref Publications.
TABLE 3: GLOBAL FLOWS OF SELECTED MATERIALS*
Material
Minerals
Phosphate
Salt
Mica
Cement
Metals
Al
Cu
Pb
Ni
Sn
Zn
Steel
Fossil Fuels
Coal
Lignite
Oil
Gas
Water
Flow
Per-capita flow**
(Million metric tons/yr)
1.2 ***
120
190
280
890
0.3
097.0
8.5
3.4
0.8
0.2
7.0
780
1.6
3,200
1,200
2,800
920
41,000,000
* Data sources include UN Statistical Yearbooks
(various years), Minerals Yearbooks (U.S. Department of the Interior, 1985), and World Resources
1990–1991 (World Resources Institute, 1990).
** Per-capita figures are based on a population of
five billion people and include materials in addition
to those highlighted in this table.
*** Does not include the amount of overburden
and mine waste involved in mineral production;
neglects sand, gravel, and similar material
but includes cement.
Source: Thomas E. Graedel and Braden Allenby,
Industrial Ecology. Chapter III: Table III.2.1 (New
York: Prentice Hall, 1993; pre-publication copy).
8,200.0
Introduction • 9
November 1995
TABLE 4: RESOURCES USED IN AUTOMOBILE MANUFACTURING
Plastics Used in Cars, Vans, and Small Trucks—
Millions of Pounds (1989)
Material
U.S. Auto All U.S. Percent of Total
Nylon
141
595
23.7
Polyacetal
25
141
17.7
ABS
197
1,243
15.8
Polyurethane
509
3,245
15.7
Unsat PE
192
1,325
14.5
Polycarbonate
50
622
8.0
Acrylic
31
739
4.2
Polypropylene
298
7,246
4.1
PVC
187
8,307
2.3
TP PE
46
2,101
2.2
Polyethylene
130
18,751
0.7
Phenolic
19
3,162
0.6
Other Resources—as percentage of
total U.S. consumption (1988)
Material
Percent of Total
Lead
67.3
Alloy Steel
10.7
Stainless Steel
12.3
Total Steel
12.2
Aluminum
18.3
Copper and Copper Alloys
10.2
Malleable Iron
63.8
Platinum
39.1
Natural Rubber
76.6
Synthetic Rubber
50.1
Zinc
23.0
Source: Draft Report, Design and the Environment—The U.S. Automobile.
The authors obtained this information from the Motor Vehicle Manufacturers Association 1990 Annual Data Book.
To identify areas to target for reduction, one must
understand the dissipation of materials and energy
(in the form of pollutants) — how these flows intersect,
interact, and affect natural systems. Distinguishing
between natural material and energy flows and anthropogenic flows can be useful in identifying the scope of
human-induced impacts and changes. As is apparent
in Table 2, the anthropogenic sources of some materials
in natural ecosystems are much greater than natural
sources. Tables 3 and 4 provide a good example of
how various materials flow through one product
system, that of the automobile.
Industrial ecology seeks to transform industrial activities
into a more closed system by decreasing the dissipation
or dispersal of materials from anthropogenic sources,
in the form of pollutants or wastes, into natural systems.
In the automobile example, it is useful to further trace
what happens to these materials at the end of the
products’ lives in order to mitigate possible adverse
environmental impacts.
Some educational courses may wish to concentrate on
developing skills to do mass balances and to trace the
flows of certain energy or material forms in processes
and products. Refer to Chapters 3 and 4 in Graedel
and Allenby’s Industrial Ecology for exercises in this
subject area.
10 • Introduction
November 1995
Multidisciplinary Approach
Since industrial ecology is based on a holistic, systems
view, it needs input and participation from many
different disciplines. Furthermore, the complexity of
most environmental problems requires expertise from
a variety of fields — law, economics, business, public
health, natural resources, ecology, engineering — to
contribute to the development of industrial ecology
and the resolution of environmental problems caused
by industry. Along with the design and implementation of appropriate technologies, changes in public
policy and law, as well as in individual behavior, will
be necessary in order to rectify environmental impacts.
Current definitions of industrial ecology rely heavily
on engineered, technological solutions to environmental
problems. How industrial ecology should balance the
need for technological change with changes in consumer
behavior is still subject to debate. Some see it as having
a narrow focused on industrial activity; to others, it is a
way to view the entire global economic system.
Analogies to Natural Systems
There are several useful analogies between industrial
and natural ecosystems.14 The natural system has
evolved over many millions of years from a linear (open)
system to a cyclical (closed) system in which there is a
dynamic equilibrium between organisms, plants, and
the various biological, physical, and chemical processes
in nature. Virtually nothing leaves the system, because
wastes are used as substrates for other organisms. This
natural system is characterized by high degrees of integration and interconnectedness. There is a food web
by which all organisms feed and pass on waste or are
eaten as a food source by other members of the web.
In nature, there is a complex system of feedback mechanisms that induce reactions should certain limits be
reached. (See Odum or Ricklefs for a more complete
description of ecological principles.)
Industrial ecology draws the analogy between industrial and natural systems and suggests that a goal is to
stimulate the evolution of the industrial system so that
it shares the same characteristics as described above
concerning natural systems. A goal of industrial ecology
would be to reach this dynamic
equilibrium and high degree of
interconnectedness and integration that exists in nature.
Both natural and industrial
system have cycles of energy
and nutrients or materials. The
carbon, hydrogen, and nitrogen
cycles are integral to the functioning and equilibrium of the
entire natural system; material
and energy flows through various products and processes are
integral to the functioning of the
industrial system. These flows
can affect the global environment.
For example, the accumulation of
greenhouse gases could induce
global climate change.
There is a well-known ecoindustrial park in Kalundborg,
Denmark. It represents an
attempt to model an industrial
park after an ecological system.
The companies in the park are
highly integrated and utilize the
waste products from one firm as
an energy or raw material source
for another. (This park is illustrated in Figure 1 and described
in Appendix A.)
Linear (Open) Versus
Cyclical (Closed) Loop Systems
The evolution of the industrial system from a linear
system, where resources are consumed and damaging
wastes are dissipated into the environment, to a more
closed system, like that of ecological systems, is a central concept to industrial ecology. Braden Allenby has
described this change as the evolution from a Type I to
a Type III system, as shown in Figure 5.
A Type I system is depicted as a linear process in which
materials and energy enter one part of the system and
then leave either as products or by-products/wastes.
Because wastes and by-products are not recycled or
reused, this system relies on a large, constant supply
of raw materials. Unless the supply of materials and
Type I System
Type II System
Type III System
FIGURE 5: SYSTEM TYPES
Source: Braden R. Allenby, “Industrial Ecology: The Materials Scientist in an Environmentally
Constrained World,” MRS Bulletin 17, no. 3 (March 1992): 46–51. Reprinted with the permission
of the Materials Research Society.
Introduction • 11
November 1995
energy is infinite, this system is unsustainable; further,
the ability for natural systems to assimilate wastes
(known as “sinks”) is also finite. In a Type II system,
which characterizes much of our present-day industrial
system, some wastes are recycled or reused within the
system while others still leave it.
A Type III system represents the dynamic equilibrium
of ecological systems, where energy and wastes are
constantly recycled and reused by other organisms and
processes within the system. This is a highly integrated,
closed system. In a totally closed industrial system,
only solar energy would come from outside, while all
byproducts would be constantly reused and recycled
within. A Type III system represents a sustainable
state and is an ideal goal of industrial ecology.
Strategies for Environmental Impact
Reduction: Industrial Ecology as
a Potential Umbrella for Sustainable
Development Strategies
Various strategies are used by individuals, firms, and
governments to reduce the environmental impacts of
industry. Each activity takes place at a specific systems
level. Some feel that industrial ecology could serve as
an umbrella for such strategies, while others are wary
of placing well-established strategies under the rubris
of a new idea like industrial ecology. Strategies related
to industrial ecology are briefly noted below.
Pollution prevention is defined by the U.S. EPA as
“the use of materials, processes, or practices that reduce or eliminate the creation of pollutants at the
source.” Pollution prevention refers to specific actions
by individual firms, rather than the collective activities
of the industrial system (or the collective reduction of
environmental impacts) as a whole. 15 The document
in this compendium entitled “Pollution Prevention
Concepts and Principles” provides a detailed examination of this topic with definitions and examples.
Waste minimization is defined by the U.S. EPA as “the
reduction, to the extent feasible, of hazardous waste
that is generated or subsequently treated, sorted, or
disposed of.” 16 Source reduction is any practice that
reduces the amount of any hazardous substance,
pollutant or contaminant entering any waste stream
or otherwise released into the environmental prior to
recycling, treatment or disposal. 17
12 • Introduction
November 1995
Total quality environmental management (TQEM) is used
to monitor, control, and improve a firm’s environmental
performance within individual firms. Based on wellestablished principles from Total Quality Management,
TQEM integrates environmental considerations into
all aspects of a firm’s decision-making, processes, operations, and products. All employees are responsible
for implementing TQEM principles. It is a holistic
approach, albeit at level of the individual firm.
Many additional terms address strategies for sustainable development. Cleaner production, a term coined by
UNEP in 1989, is widely used in Europe. Its meaning
is similar to pollution prevention. In Clean Production
Strategies, Tim Jackson writes that clean production is
. . . an operational approach to the development
of the system of production and consumption,
which incorporates a preventive approach to
environmental protection. It is characterized by
three principles: precaution, prevention, and
integration. 18
These strategies represent approaches that individual
firms can take to reduce the environmental impacts
of their activities. Along with environmental impact
reduction, motivations can include cost savings, regulatory or consumer pressure, and health and safety
concerns. What industrial ecology potentially offers is
an organizing umbrella that can relate these individual
activities to the industrial system as a whole. Whereas
strategies such as pollution prevention, TQEM, and
cleaner production concentrate on firms’ individual
actions to reduce individual environmental impacts,
industrial ecology is concerned about the activities of
all entities within the industrial system.
The goal of industrial ecology is to reduce the overall,
collective environmental impacts caused by the totality
of elements within the industrial system.
System Tools to Support Industrial Ecology
Life Cycle Assessment (LCA)
Life cycle assessment (LCA), along with “ecobalances”
and resource environmental profile analysis, is a
method of evaluating the environmental consequences
of a product or process “from cradle to grave.”19 20 21
The Society for Environmental Toxicology & Chemistry
(SETAC) defines LCA as “a process used to evaluate
the environmental burdens associated with a product,
process, or activity.”22 The U.S. EPA has stated that an
LCA “is a tool to evaluate the environmental consequences of a product or activity holistically, across its
entire life.” 23 In the United States, SETAC, the U.S. EPA
and consulting firms are active in developing LCAs.
COMPONENTS OF AN LCA
LCA methodology is still evolving. However, the three
distinct components defined by SETAC and the U.S.
EPA (see Figure 6) are the most widely recognized:
1. inventory analysis — identification and quantification
of energy and resource use and environmental
releases to air, water, and land
2. impact analysis — technical qualitative and quantitative
characterization and assessment of the consequences
on the environment
Impact Assessment
- Ecological Health
- Human Health
- Resource Depletion
Goal
Definition
and
Scoping
3. improvement analysis — evaluation and implementation of opportunities to reduce environmental burden
Some life cycle assessment practitioners have defined a
fourth component, the scoping and goal definition or
initiation step, which serves to tailor the analysis to its
intended use. 24 Other efforts have also focused on developing streamlined tools that are not as rigorous as
LCA (e.g., Canadian Standards Association.)
METHODOLOGY
A Life Cycle Assessment focuses on the product life
cycle system as shown in Figure 7. Most research efforts have been focused on the inventory stage. For an
inventory analysis, a process flow diagram is constructed
and material and energy inputs and outputs for the
product system are identified and quantified as depicted
in Figure 8. A template for constructing a detailed
flow diagram for each subsystem is shown in Figure 9.
Improvement
Assessment
Inventory Analysis
- Materials and Energy Acquisition
- Manufacturing
- Use
- Waste Management
FIGURE 6: TECHNICAL FRAMEWORK FOR LIFE-CYCLE ASSESSMENT
Reprinted with permission from Guidelines for Life-Cycle Assessment: A “Code of Practice,” F. Consoli et al., eds. Proceedings from the
SETAC Workshop held in Sesimbra, Portugal, 31 March–3 April 1993. Copyright 1993 Society of Environmental Toxicology and Chemistry,
Pensacola, Florida, and Brussels, Belgium.
Introduction • 13
November 1995
Checklists such as those in Figure 10 may then be used
in order to further define the study, set the system
boundaries, and gather the appropriate information
concerning inputs and outputs. Figure 11 shows the
many stages involved in the life cycle of a bar of soap,
illustrating how, even for a relatively simple product,
the inventory stage can quickly become complicated,
especially as products increase in number of components and in complexity.
Remanufacturing
Recycling
Closed-loop
recycling
Manufacture
& Assembly
Engineered &
Speciality
Materials
Use &
Service
Reuse
Retirement
Bulk
Processing
Open-loop
recycling
Material downcycling
into another product
system
Raw Material
Acquisition
Treatment
Disposal
The Earth and Biosphere
Fugitive and untreated residuals
Airborne, waterborne, and solid residuals
Material, energy, and labor inputs for Process and Management
Transfer of materials between stages for Product; includes
transportation and packaging (Distribution)
Source: Gregory A. Keoleian and Dan Menerey, Life Cycle Design Guidance Manual (Cincinnati: U.S. EPA Risk Reduction Engineering Lab, 1993), 14.
FIGURE 7: THE PRODUCT LIFE CYCLE SYSTEM
14 • Introduction
November 1995
Source: B. W. Vigon et al., “Life Cycle Assessment: Inventory Guidelines and Principles” (Cincinnati:
U.S. Environmental Protection Agency, Risk Reduction Engineering Laboratory, 1993), 17.
FIGURE 8: PROCESS FLOW DIAGRAM
Source: Franklin Associates, cited in B. W. Vigon et al., “Life Cycle Assessment: Inventory Guidelines and Principles”
(Cincinnati: U.S. Environmental Protection Agency, Risk Reduction Engineering Laboratory, 1993), 41.
FIGURE 9: FLOW DIAGRAM TEMPLATE
Introduction • 15
November 1995
LIFE-CYCLE INVENTORY CHECKLIST PART I—SCOPE AND PROCEDURES
INVENTORY OF: __________________________________________________
Purpose of Inventory: (check all that apply)
Private Sector Use
Internal Evaluation and Decision-Making
Comparison of Materials, Products or Activities
Resource Use and Release Comparison With Other
Manufacturer’s Data
Personnel Training for Product and Process Design
Baseline Information for Full LCA
External Evaluation and Decision-Making
Provide Information on Resource Use and Releases
Substantiate Statements of Reductions in Resource
Use and Releases
Public Sector Use
Evaluation and Policy-Making
Support information for Policy and Regulatory Evalution
Information Gap Identification
Help Evaluate Statements of Reductions in Resource
Use and Releases
Public Education
Develop Support Materials for Public Education
Assist in Curriculum Design
Systems Analyzed
List the prodoct/process systems analyzed in this inventory: __________________________________________________________
__________________________________________________________________________________________________________
Key Assumptions: (list and describe)
__________________________________________________________________________________________________________
__________________________________________________________________________________________________________
__________________________________________________________________________________________________________
Define the Boundaries
For each system analyzed, define the boundaries by life-cycle stage, geographic scope, primary processes, and ancillary inputs
included in the system boundaries.
Postconsumer Solid Waste Management Options: Mark and describe the options analyzed for each system.
Landfill ___________________________________
Open-loop Recycling ______________________________________
Combustion _______________________________
Closed-loop Recycling _____________________________________
Composting _______________________________
Other __________________________________________________
Basis for Comparison
This is not a comparative study.
This is a comparative study.
State basis for comparison between systems: (Example: 1,000 units, 1,000 uses) ___________________________________________
____________________________________________________________________________________________________________
If products or processes are not normally used on a one-to-one basis, state how equivalent function was established.
____________________________________________________________________________________________________________
Computational Model Construction
System calculations are made using computer spreadsheets that relate each system component to the total system.
System calculations are made using another technique. Describe: __________________________________________________
____________________________________________________________________________________________________________
Describe how inputs to and outputs from postconsumer solid waste management are handled. _________________________________
____________________________________________________________________________________________________________
____________________________________________________________________________________________________________
Quality Assurance: (state specific activities and initials of reviewer)
Review performed on:
Data-Gathering Techniques ______________
Coproduct Allocation ____________________
Peer Review: (state specific activities and initials of reviewer)
Review performed on:
Scope and Boundary ____________________
Data-Gathering Techniques ______________
Coproduct Allocation ____________________
Results Presentation
Methodology is fully described
Individual pollutants are reported
Emissions are reported as aggregated totals only.
Explain why. ______________________________________
_________________________________________________
Report is sufficiently detailed for its defined purpose.
Input Data ________________________________
Model Calculations and Formulas ______________
Results and Reporting _______________________
Input Data ________________________________
Model Calculations and Formulas ______________
Results and Reporting _______________________
Report may need more detail for additional use beyond
defined purpose.
Sensitivity analyses are included in the report.
List: ________________________________________
Sensitivity analyses have been performed but are not
included in the report. List: ______________________
____________________________________________
FIGURE 10: TYPICAL CRITERIA CHECKLIST WITH WORKSHEET FOR PERFORMING LIFE-CYCLE INVENTORY
16 • Introduction
November 1995
LIFE-CYCLE INVENTORY CHECKLIST PART II—MODULE WORKSHEET
Inventory of: ____________________________________ Preparer: _______________________________
Life-Cycle Stage Description: ________________________________________________________________
Date: ___________________________ Quality Assurance Approval: _______________________________
MODULE DESCRIPTION: __________________________________________________________________
Data Value(a)
Type(b)
MODULE INPUTS
Data(c) Age/Scope
Quality Measures(d)
Materials
Process
Other(e)
Energy
Process
Precombustion
Water Usage
Process
Fuel-Related
MODULE OUTPUTS
Product
Coproducts(f)
Air Emissions
Process
Fuel-Related
Water Effluents
Process
Fuel-Related
Solid Waste
Process
Fuel-Related
Capital Repl.
Transportation
Personnel
(a) Include units.
(b) Indicate whether data are actual measurements, engineering estimates, or theoretical or published values and whether the numbers are
from a specific manufacturer or facility, or whether they represent industry-average values. List a specific source if pertinent, e.g.,
“obtained from Atlanta facility wastewater permit monitoring data.”
(c) Indicate whether emissions are all available, regulated only, or selected. Designate data as to geographic specificity, e.g., North
America, and indicate the period covered, e.g., average of monthly for 1991.
(d) List measures of data quality available for the data item, e.g., accuracy, precision, representativeness, consistency-checked, other, or none.
(e) Include nontraditional inputs, e.g., land use, when appropriate and necessary.
(f) If coproduct allocation method was applied, indicate basis in quality measures column, e.g. weight
Source: Vigon et al., “Life Cycle Assessment: Inventory Guidelines and Principles” (Cincinnati: U.S. EPA, Risk Reduction Engineering Lab, 1993), 24–25.
Introduction • 17
November 1995
FIGURE 11: DETAILED SYSTEM DIAGRAM FOR BAR SOAP
Source: Vigon et al., “Life Cycle Assessment: Inventory Guidelines and Principles” (Cincinnati: U.S. EPA Risk Reduction Engineering Laboratory), 42.
18 • Introduction
November 1995
FIGURE 12: IMPACT ASSESSMENT CONCEPTUAL FRAMEWORK
Source: Keoleian et al., Life Cycle Design Framework and Demonstration Projects (Cincinnati: U.S. EPA Risk Reduction Engineering Lab, 1995), 55.
Once the environmental burdens haven been identified
in the inventory analysis, the impacts must be characterized and assessed. The impact assessment stage seeks
to determine the severity of the impacts and rank them
as indicated by Figure 12. As the figure shows, the
impact assessment involves three stages: classification,
characterization, and valuation. In the classification
stage, impacts are placed in one of four categories:
resource depletion, ecological health, human health,
and social welfare. Assessment endpoints must then
be determined. Next, conversion models are used
to quantify the environmental burden. Finally, the
impacts are assigned a value and/or are ranked.
Efforts to develop methodologies for impact assessment
are relatively new and remain incomplete. It is difficult
to determine an endpoint. There are a range of conversion models, but many of them remain incomplete.
Furthermore, different conversion models for translating
inventory items into impacts are required for each
impact, and these models vary widely in complexity,
uncertainty, and sophistication. This stage also suffers
from a lack of sufficient data, model parameters and
conversion models.
The final stage of a LCA, the improvement analysis,
should respond to the results of the inventory and/or
impact assessment by designing strategies to reduce the
Introduction • 19
November 1995
identified environmental impacts. Proctor and Gamble
is one company that has used life cycle inventory studies
to guide environmental improvement for several products. 25 One of its case studies on hard surface cleaners
revealed that heating water for use with the product
resulted in a significant percentage of total energy use
and air emissions related to cleaning.26 Based on this
information, opportunities for reducing impacts were
identified, such as designing cold-water and no-rinse
formulas and educating consumers to use cold water.
APPLICATIONS OF LCA
Life cycle assessments can be used both internally
(within an organization) and externally (by the public
and private sectors).27 Internally, LCAs can be used to
establish a comprehensive baseline (i.e., requirements)
that product design teams should meet, identify the
major impacts of a product’s life cycle, and guide the
improvement of new product systems toward a net
reduction of resource requirements and emissions in
the industrial system as a whole. Externally, LCAs can
be used to compare the environmental profiles of alter-
native products, processes, materials, or activities and
to support marketing claims. LCA can also support
public policy and eco-labeling programs.
DIFFICULTIES WITH LCA
As shown in Table 5, many methodological problems
and difficulties inhibit use of LCAs, particularly for
smaller companies. For example, the amount of data
and the staff time required by LCAs can make them
very expensive, and it isn’t always easy to obtain all of
the necessary data. Further, it is hard to properly define
system boundaries and appropriately allocate inputs
and outputs between product systems and stages. It is
often very difficult to assess the data collected because
of the complexity of certain environmental impacts.
Conversion models for transforming inventory results
into environmental impacts remain inadequate. In
many cases there is a lack of fundamental understanding and knowledge about the actual cause of certain
environmental problems and the degree of threat that
they pose to ecological and human health.
TABLE 5: GENERAL DIFFICULTIES AND LIMITATIONS OF THE LCA METHODOLOGY
Source: Gregory A. Keoleian, “The Application of Life Cycle Assessment to Design,” Journal of Cleaner Production 1, no. 3–4 (1994): 143–149.
Goal Definition and Scoping
Costs to conduct an LCA may be prohibitive to small firms. Time required to conduct LCA
may exceed product development constraints, especially for short development cycles.
Temporal and spatial dimensions of a dynamic product system are difficult to address.
Definition of functional units for comparison of design alternatives can be problematic.
Allocation methods used in defining system boundaries have inherent weaknesses.
Complex products (e.g., automobiles) require tremendous resources to analyze.
Data Collection
Data availability and access can be limiting (e.g., proprietary data). Data quality concerns
such as bias, accuracy, precision, and completeness are often not well-addressed.
Data Evaluation
Sophisticated models and model parameters for evaluating resource depletion and human
and ecosystem health may not be available, or their ability to represent the product system
may be grossly inaccurate. Uncertainty analyses of the results are often not conducted.
Information Transfer
Design decisionmakers often lack knowledge about environmental effects. Aggregation
and simplification techniques may distort results. Synthesis of environmental effect
categories is limited because they are incommensurable.
20 • Introduction
November 1995
In the absence of an accepted methodology, results
of LCAs can differ. Order-of-magnitude differences
are not uncommon. Discrepancies can be attributed
to differences in assumptions and system boundaries.
Regardless of the current limitations, LCAs offer a
promising tool to identify and then implement strategies to reduce the environmental impacts of specific
products and processes as well as to compare the relative merits of product and process options. However,
much work needs to be done to develop, utilize, evaluate, and refine the LCA framework.
Life Cycle Design (LCD) and
Design For the Environment (DfE)
The design of products shapes the environmental performance of the goods and services that are produced
to satisfy our individual and societal needs.28 Environmental concerns need to be more effectively addressed
in the design process to reduce the environmental impacts associated with a product over its life cycle. Life
Cycle Design, Design for Environment, and other similar initiatives based on the product life cycle are being
developed to systematically incorporate these environmental concerns into the design process.
Life Cycle Design (LCD) is a systems-oriented approach
for designing more ecologically and economically sustainable product systems. Coupling the product development cycle used in business with a product’s physical
life cycle, LCD integrates environmental requirements
into each design stage so total impacts caused by the
product system can be reduced. 29
Design for Environment (DfE) is another design strategy
that can be used to design products with reduced environmental burden. DfE and LCD can be difficult to
distinguish. They have similar goals but evolved from
different sources. DfE evolved from the “Design for X”
approach, where X can represent manufacturability,
testability, reliability, or other “downstream” design
considerations. 30 Braden Allenby has developed a DfE
framework to address the entire product life cycle.
Like LCD, DfE uses a series of matrices in an attempt to
develop and then incorporate environmental requirements into the design process. DfE is based on the
product life cycle framework and focuses on integrating
environmental issues into products and process design.
Life cycle design seeks to minimize the environmental
consequences of each product system component:
product, process, distribution and management.31
Figure 13 indicates the complex set of issues and decisions required in LCD. When sustainable development
is the goal, the design process can be affected by both
internal and external factors.
Internal factors include corporate policies and the companies’ mission, product performance measures, and
product strategies as well as the resources available to
the company during the design process. For instance,
a company’s corporate environmental management
system, if it exists at all, greatly affects the designer’s
ability to utilize LCD principles.
External factors such as government policies and regulations, consumer demands and preferences, the state
of the economy, and competition also affect the design
process, as do current scientific understanding and
public perception of risks associated with the product.
THE NEEDS ANALYSIS
As shown in the figure, a typical design project begins
with a needs analysis. During this phase, the purpose
and scope of the project is defined, and customer needs
and market demand are clearly identified.32 The system
boundaries (the scope of the project) can cover the full
life cycle system, a partial system, or individual stages
of the life cycle. Understandably, the more comprehensive the system of study, the greater the number of
opportunities identified for reducing environmental
impact. Finally, benchmarking of competitors can identify opportunities to improve environmental performance. This involves comparing a company’s products
and activities with another company who is considered
to be a leader in the field or “best in class.”
DESIGN REQUIREMENTS
Once the projects needs have been established, they are
used in formulating design criteria. This step is often
considered to be the most important phase in the design
process. Incorporating key environmental requirements
into the design process as early as possible can prevent
the need for costly, time-consuming adjustments later.
A primary objective of LCD is to incorporate environmental requirements into the design criteria along with
the more traditional considerations of performance,
cost, cultural, and legal requirements.
Introduction • 21
November 1995
Life Cycle Goal
Sustainable Development
Life
Internal Factors
• Policy
• Performance Measures
• Strategy
• Resources
Cycle Design Management
Research & Development
• Multi-stakeholders
• Concurrent Design
• Team Coordination
Needs Analysis
• Significant needs
• Scope & purpose
• Baseline
External Factors
• Government policy
and regulations
• Market demand
• Infrastructure
State of Environment
Requirements
• Environmental
• Performance
• Cost
• Cultural
• Legal
Design
Strategies
Evaluation
• Analysis Tools
environmental
cost
• Tradeoff Analysis
Design
Solution
Implement
Continuous Improvement
• Production
• Use & service
• Retirement
Continuous Assessment
FIGURE 13: LIFE CYCLE DESIGN
Source: Keoleian and Menerey, Life Cycle Design Guidance Manual (Cincinnati: U.S. EPA Risk Reduction Engineering Laboratory, January 1993), 23.
22 • Introduction
November 1995
Design checklists comprised of a series of questions are
sometimes used to assist designers in systematically
addressing environmental issues. Care must be taken
to prevent checklists, such as the one in Table 7, from
being overly time-consuming or disruptive to the creative process. Another more comprehensive approach
is to use requirement matrices such as the one shown
in Figure 14.
TABLE 7: ISSUES TO CONSIDER WHEN DEVELOPING ENVIRONMENTAL REQUIREMENTS
Materials and Energy
Residuals
Ecological Health
Human Health and Safety
Amount & Type
• renewable
• nonrenewable
Type
• solid waste
• air emissions
• waterborne
Stressors
• physical
• biological
• chemical
Population at Risk
• workers
• users
• community
Characterization
• constituents
• amount
• concentration
• toxicity
• hazardous content
• radioactivity
Impact Categories
• diversity
• sustainability
• resilience
• system structure
• system function
Exposure Routes
• inhalation, contact, ingestion
• duration & frequency
Character
• virgin
• reused/recycled
• reusable/ recyclable
Resource Base
• location
• local vs. other
• availability
• quality
• management
• restoration practices
Impacts From
Extraction and Use
• material/energy use
• residuals
• ecosystem health
• human health
Environmental Fate
• containment
• bioaccumulation
• degradability
• mobility/transport
• ecologial impacts
• human health
impacts
Scale
• local
• regional
• global
Accidents
• type
• frequency)
Toxic Character
• acute effects
• chronic effects
• morbidity/mortality
Nuisance Effects
• noise
• odors
• visibility
Source: Keoleian et al., LIfe Cycle Design Framework and Demonstration Projects (Cincinnati: U.S. EPA Risk Reduction Engineering Lab, July 1995), 45.
Legal
Cultural
Cost
Performance
Engineered Assembly &
Raw
Bulk
Material
Processing Materials
Processing Manufacture
Acquisition
Use &
Service
Environmental
Retirement
Treatment
& Disposal
Product
• Inputs
• Outputs
Process
• Inputs
• Outputs
Distribution
• Inputs
• Outputs
Management
• Inputs
• Outputs
FIGURE 14: REQUIREMENTS MATRICES
Source: Keoleian and Menerey, Life Cycle Design Guidance Manual (Cincinnati: U.S. EPA Risk Reduction Engineering Lab, January 1993), 44.
Introduction • 23
November 1995
Matrices can be used by product development teams to
study interactions between life cycle requirements and
their associated environmental impacts. There are no
absolute rules for organizing matrices. Development
teams should choose a format that is appropriate for
their project. The requirements matrices shown are
strictly conceptual; in practice such matrices can be
simplified to address requirements more broadly during
the earliest stages of design, or each cell can be further
subdivided to focus on requirements in more depth.
Government policies, along with the criteria identified
in the needs analysis, also should be included. It is often
useful in the long term to set environmental requirements that exceed current regulatory requirements to
avoid costly design changes in the future.
Performance requirements relate to the functions needed
from a product. Cost corresponds to the need to deliver
the product to the marketplace at a competitive price.
LCD looks at the cost to stakeholders such as manufacturers, suppliers, users and end-of-life managers.
Cultural requirements include aesthetic needs such as
shape, form, color, texture, and image of the product as
well as specific societal norms such as convenience or
ease of use. 33 These requirements are ranked and
weighed given a chosen mode of classification.
DESIGN STRATEGIES
Once the criteria have been defined, the design team
can then use design strategies to meet these requirements. Multiple strategies often must be synthesized
in order to translate these requirements into solutions.
A wide range of strategies are available for satisfying
environmental requirements, including product system
life extension, material life extension, material selection, and
efficient distribution. A summary of these strategies are
shown in Table 8. Note that recycling is often overemphasized.
TABLE 8: STRATEGIES FOR MEETING ENVIRONMENTAL REQUIREMENTS
Product Life Extension
• extend useful life
• make appropriately durable
• ensure adaptability
• facilitate serviceability by simplifying
maintenance and allowing repair
• enable remanufacture
• accommodate reuse
Material Life Extension
• specify recycled materials
• use recyclable materials
Material Selection
• substitute materials
• reformulate products
Reduced Material Intensity
• conserve resources
Process Management
• use substitute processes
• increase energy efficiency
• process materials efficiently
• control processes
• improve process layout
• improve inventory control and
material handling processes
• plan efficient facilities
• consider treatment and disposal too
Efficient Distribution
• choose efficient transportation
• reduce packaging
• use low-impact or reusable packaging
Improved Management Practices
• use office materials and equipment efficiently
• phase out high-impact products
• choose environmentally responsible
suppliers or contractors
• label properly
• advertise demonstrable environmental
improvements
Source: Keoleian et al., LIfe Cycle Design Framework and Demonstration Projects (Cincinnati: U.S. EPA Risk Reduction Engineering Lab, July 1995), 51.
24 • Introduction
November 1995
DESIGN EVALUATION
Finally, it is critical that the design is evaluated and
analyzed throughout the design process. Tools for
design evaluation range from LCA to single-focus
environmental metrics. In each case, design solutions
are evaluated with respect to a full spectrum of criteria,
which includes cost and performance.
DfE methods developed by Allenby use a semiquantitative matrix approach for evaluating life cycle
environmental impacts.34 35 A graphic scoring system
weighs environmental effects according to available
quantitative information for each life cycle stage. In
addition to an environmental matrix and toxicology/
exposure matrix, manufacturing and social/political
matrices are used to address both technical and nontechnical aspects of design alternatives.
Although LCD is not yet widely practiced, it has been
used by companies like AT&T and AlliedSignal and
is recognized as an important approach for reducing
environmental burdens. To enhance the use of LCD,
appropriate government policies must be evaluated
and established. In addition, environmental accounting
methods must be further developed and utilized by
industry (these methods are often referred to as Life
Cycle Costing or Full Cost Accounting — see Table 9.)
TABLE 9: DEFINITIONS OF ACCOUNTING AND CAPITAL BUDGETING TERMS RELEVANT TO LCD
Accounting
Full Cost Accounting
A method of managerial cost accounting that allocates both direct and indirect
environmental costs to a product, product line, process, service, or activity. Not
everyone uses this term the same way. Some only include costs that affect the
firm’s bottom line; others include the full range of costs throughout the life cycle,
some of which do not have any indirect or direct effect on a firm’s bottom line.
Life Cycle Costing
In the environmental field, this has come to mean all costs associated with
a product system throughout its life cycle, from materials acquisition to disposal.
Where possible, social costs are quantified; if this is not possible, they are addressed qualitatively. Traditionally applied in military and engineering to mean
estimating costs from acquisition of a system to disposal. This does not usually
incorporate costs further upstream than purchase.
Capital Budgeting
Total Cost Assessment
Long-term, comprehensive financial analysis of the full range of internal (i.e.,
private) costs and savings of an investment. This tool evaluates potential investments in terms of private costs, excluding social considerations. It does include
contingent liability costs. Further, educational institutions must work to continue
the development and the dissemination of the LCD methodology and related
approaches. Key issues in environmental accounting that need to be addressed
include: measurement and estimation of environmental costs, allocation procedures, and the inclusion of appropriate externalities.
Source: Robert S. Kaplan, “Management Accounting for Advanced Technical Environments,” Science 245 (1989): 819–823; cited in
Keoleian et al., LIfe Cycle Design Framework and Demonstration Projects (Cincinnati: U.S. EPA Risk Reduction Engineering Lab, July 1995), 62.
Introduction • 25
November 1995