Determinants of capital structure of listed real estate companies in vietnam
Bạn đang xem bản rút gọn của tài liệu. Xem và tải ngay bản đầy đủ của tài liệu tại đây (994.15 KB, 69 trang )
UNIVERSITY OF ECONOMICS
HO CHI MINH CITY
VIETNAM
INSTITUTE OF SOCIAL STUDIES
THE HAGUE
THE NETHERLANDS
VIETNAM - NETHERLANDS
PROGRAMME FOR M.A IN DEVELOPMENT ECONOMICS
DETERMINANTS OF CAPITAL STRUCTURE
OF LISTED REAL ESTATE COMPANIES
IN VIETNAM
BY
DO QUANG THAI
MASTER OF ARTS IN DEVELOPMENT ECONOMICS
HO CHI MINH CITY, DECEMBER 2014
UNIVERSITY OF ECONOMICS
HO CHI MINH CITY
VIETNAM
INSTITUTE OF SOCIAL STUDIES
THE HAGUE
THE NETHERLANDS
VIETNAM - NETHERLANDS
PROGRAMME FOR M.A IN DEVELOPMENT ECONOMICS
DETERMINANTS OF CAPITAL STRUCTURE
OF LISTED REAL ESTATE COMPANIES
IN VIETNAM
A thesis submitted in partial fulfilment of the requirements for the degree of
MASTER OF ARTS IN DEVELOPMENT ECONOMICS
By
DO QUANG THAI
Academic Supervisor:
NGUYEN HOANG BAO
HO CHI MINH CITY, DECEMBER 2014
ABSTRACT
This research focuses on the impact of determinants to capital structure with
respect to 56 listed real estate companies in Vietnam from 2010 to 2013. Basing on two
theories of trade-off and pecking order, capital structure, which is defined by debt ratio,
is expected to provide the current prospect of Vietnamese real estate sector. The tradeoff theory mentioned about the establishment of optimal capital structure for
enterprises, while theory of pecking order implied the financing decisions by board of
managements.
For the methodology, Fixed Effect Model is used to test the results of regression
model. Non-random statistics of Fixed Effect Model would be more efficient and
consistent in order to reduce the level of bias. The data set will be arranged by panel
data, which combined both cross section and time series, helped to improve the
significant results of regression model.
Policy implications carefully mentioned about the limitation of both Pecking
order and Trade-off theories in Vietnam evidence. For Pecking order, board of
management prefers to use external financing budgets by issuing new bonds or stocks
rather than internal financing capital. The abuse of debt financing is also pointed out
the hard pressures on banking system, securities markets, and the corporate governance
structure of the listed firms. Besides that, Trade-off theory has limited its effect in
Vietnam due to centrally planned economy. The government needs to change its
administration in some listed real estate companies to create fair environment for the
whole market.
TABLE OF CONTENTS
CHAPTER I: PRESENTATION OF THESIS RESEARCH…………… 1
1.1 Problem Statement……………………………………………………. 1
1.2 Research Objectives………………………………………………...... 3
1.3 Research Questions…………………………………………………… 4
1.4 Scope of study………………………………………………………... 5
1.5 Structure of thesis research…………………………………………… 6
CHAPTER II: LITERATURE REVIEW………………………………... 7
2.1 Review of Empirical Studies…………………………………………. 7
2.2 Hypothesis of Variables…………………………………………….....11
2.2.1 Dependent Variable: Debt Ratio………………………………… 11
2.2.2 Independent Variables…………………………………………… 11
CHAPTER III: RESEARCH METHODOLOGY……………………...... 12
3.1 Analytical Framework………………………………………………... 12
3.2 Regression Model…………………………………………………….. 16
3.2.1 Assumptions of Regression Model……………………………… 16
3.2.2 Limitations of Regression Model………………………………... 17
3.2.3 Equation of Regression Model…………………………………... 17
3.2.4 Data……………………………………………………………… 18
3.2.5 Research Method………………………………………………… 19
CHAPTER IV: RESULTS AND EXPLANATIONS…………………….. 20
4.1 Overview of Real Estate Companies in Vietnam…………………….. 20
4.2 Impacts of Vietnamese Real Estate Market…………………………... 22
4.2.1 Inflow Capital to Real Estate Market……………………………. 22
4.2.2 Land and Property Law………………………………………….. 24
4.2.3 Urbanization in Vietnam………………………………………… 24
4.2.4 Economic growth rate (GDP’s Growth rate)……………………. 25
4.3 Descriptive Statistics…………………………………………………. 26
4.4 Leverage Testing……………………………………………………... 32
4.5 Results of Regression Model…………………………………………. 34
4.5.1 Multicollinearity Test by Correlation Matrix……………………. 35
4.5.2 Using Wald-Test to Adjust Core Regression Model…………….. 36
4.5.3 Regression Model………………………………………………... 36
4.5.4 Jarque-Bera Test for Normality (in Residuals)………………….. 37
4.6 Result Explanations…………………………………………………... 38
CHAPTER V: CONCLUSIONS………………………………………….. 40
5.1 Summary of Research Methodology…………………………………. 40
5.2 Major Findings……………………………………………………….. 41
5.3 Policy Implications…………………………………………………… 41
5.4 Limitations……………………………………………………………. 42
5.5 Further Researches…………………………………………………… 43
REFERENCES……………………………………………………………….44
APPENDIX………………………………………………………………….. 49
LIST OF TABLES
Table 2.1: Expected signs of five related determinants……………………... 14
Table 4.1: Correlation matrix of debt ratio and five related determinants….. 31
Table 4.2: T-statistic of debt ratio and each of determinants………………... 31
Table 4.3: Leverage test of debt ratios………………………………………. 32
Table 4.4: Results of regression model by FEM…………………………….. 34
Table 4.5: Regression model without DEBT_INTEREST………………….. 37
LIST OF FIGURES
Figure 2.1: The Trade-off Model……………………………………………. 8
Figure 2.2: The Pecking Order………………………………………………. 9
Figure 3.1: Analytical framework of capital structure’s determinants……… 12
Figure 4.1: VN Index and Real Estate Index from the period 2010-2013…... 21
Figure 4.2: FDI flows to Vietnam from 2006-2013………………………….23
Figure 4.3: Number of Urban Cities in Vietnam from 1985-2012………….. 24
Figure 4.4: Vietnam GDP’s Growth Rate from 2004-2013…………………. 25
Figure 4.5: Descriptive Statistic of debt interest and debt ratio……………... 26
Figure 4.6: Descriptive Statistic of depreciation ratio and debt ratio……….. 27
Figure 4.7: Descriptive Statistic of size and debt ratio……………………… 28
Figure 4.8: Descriptive Statistic of profitability and debt ratio……………... 29
Figure 4.9: Descriptive Statistic of volatility and debt ratio………………… 30
ABBREVATION
EBITDA
Earnings before interest, taxes, depreciation, and amortization
EV
Enterprise Value
FDI
Foreign Direct Investment
FEM
Fixed Effect Model
GDP
Gross Domestic Products
HNX
Hanoi Stock Exchange
HSX
Ho Chi Minh Stock Exchange
REM
Random Effect Model
SMEs
Small and Medium Enterprises
SSC
State Securities Commission of Vietnam
WTO
World Trade Organization
CHAPTER I: PRESENTATION OF THESIS RESEARCH
In 2014, the Vietnamese real estate market eventually has lighted up positive
signs of recovery, which followed the gains of the stock market, benefits of interest
rate cuts, and expansionary changes in land and property ownership laws,
stimulated the market’s liquidity. The first chapter involves in five parts to present
the overview of thesis research. They consist of problem statement, research
objectives, research questions, scope of study, and general structure of the study.
1.1 PROBLEM STATEMENT
The financial crisis from 2007 to 2009 in the United States were mentioned
the worst crash of economic system in Wall Street since the Great Depression
happened in 1930s by research of Lee, Rabanal and Sandri (January, 2010). This
trauma highly contributed to the failure of key businesses, reduced the living
standards, and also resulted in a slowdown of whole national production activities.
It initially started with the U.S mortgage market and spread out its impact over the
world as “domino effect”.
Vietnamese economy now is integrated its domestic market towards
worldwide. Therefore, the industrial real estate market in Vietnam could not avoid
to be influenced in this twisting curse. According to the study of Jehan and Luong
(2008), they provided the problems of Vietnam real estate market in front of global
financial crisis. Their priority is given by lack of capital resources which came from
credit agencies or financial institutions. The function of many credit markets
seriously stopped to function at all and impacted on other industries. Most of local
credit institutions admitted that the process took extreme constrains to provide
lending credits to Small and Medium Enterprises (SMEs). The problem is described
as a downside bottleneck effect in the credit system because the tight monetary
policies of governments. Basing on research paper of Pham et al. (August, 2013),
1
they clarified transparently the important contribution of SMEs to Vietnamese
economy. They also pointed out the policy implications to reduce the stress of bottle
neck effect which may help government to restore economic growth. In fact, the
industrial real estate in Vietnam has experienced with the hardest landing since the
last booming period of the housing marketing in 2001. Do, Zhang and Zheng (2014)
demonstrated his argument of frozen liquidity in Vietnam real estate market. Due to
low turnover, low disbursement, and sharp fall of housing prices, there is calculated
approximate $3.1 billion USD of inventories for listed real estate companies in
2012. Their statistics announced that 10,077 of local real estate enterprises had to
close their business due to low trading liquidity in 2013. Ho Chi Minh and Hanoi
are two largest areas which flooded in huge volume of inventories. In details, Hanoi
had inventories of over 6,580 apartments and Ho Chi Minh had inventories of 7,830
apartments, which were worth of 12,900 billion VND and 17,480 billion VND
respectively.
When the total demand unexpectedly dropped to a lower level, the
companies did not know how to settle down their current debts. Most of Vietnamese
enterprises still are vulnerable due to not only volatility of financial market but also
different economic scenarios. One more reason is that most of Vietnamese
enterprises are developing and limited experiences, so they may receive the
prospect of default when the crisis suddenly come into them (Jehan and Luong,
2008). The main specification of the real estate market is to require a huge amount
of capital to accomplish the housing projects.
To evaluate the effectiveness of capital structure in real estate sector, time
lags in different economic scenarios are the most struggling obstacles which
somehow lead to wrong final financial decisions. The market may be immediately
impacted by changes of the equity market, but it takes time to reflect on business
activities. Companies will fall deeper to the bottom if they do not resolve
immediately the current issues by adjusting their capital structure to lower level.
2
Vicol (2010) successfully demonstrated in his thesis research that real estate
companies in the crisis scenarios would face a lot of issues relating to their own
business activities such as financial cash flow, general operations, inventories, and
depreciation methodology affecting their adjustments of capital structure.
The author realizes that there is an abnormal phenomenon in Vietnamese
enterprises related to real estate sector. The high debt ratio in their financial
statement alerted the risk-on to business activities when the market crashed.
Although facing with high interest expenses and low level of market demand, most
of real estate enterprises are willing to borrow more short-term debts in order to
maintain their current business activities. This strange phenomenon will be
explained by hypotheses and assumptions in this study are basing on two primary
theories of corporate capital structure decisions which are ranked as theories of
trade-off and pecking order. However, not only all of the problems came from the
internal business operations, but also these potential externalities may impact on the
consequences, such as monetary policies and management levels.
By applying theories of the trade-off and pecking order, we expect to find
down the determinants which will make any significant effect on capital structure in
real estate corporations towards a specific optimal financial decision in the future.
1.2 RESEARCH OBJECTIVES
First of all, this research paper tries to verify clearly the concepts and
priorities of defining corporate capital structure. By Trade-off and Pecking Order
theories, the author wants to test the impact of both theories on each of
determinants.
Secondly, the author would like to start with analyzing the debt ratio during
the crisis. Kantor and Holdsworth (2010) showed that the leverage of firm gradually
3
increased in the crisis and also continued to rise sharply in post-crisis due to time
lags. These time lags were referred to the delay of the project construction. The
inefficient account receivables also determined the lack of capital or risky capital
structure which owners had to borrow more debts in order to settle down these
problems in the crisis stage. The research by Kang, Maysami, Mensah, and Pham
(2013) demonstrated that the negative operating business of real estate companies
performed gloomy visions in the crisis. High interest expenses just wiped out their
earnings, and cash flow gradually shifted from positive sign to negative sign over
this period. Furthermore, Kim and Stone (1999) figured out that high levered
corporations might face an unexpected cut-off of lending credits from financial
institutions which was imitated obviously in their thesis. Its effect of financial
distress may drive the company go bankrupt. The urgent response from board of
directors is to divest in non-core projects and reduce goods or materials in inventory
at a discount price to survive in the market.
Finally, in the modern age, there is a new trend for firms in the crisis may
use spin—off strategy which may help parent company to achieve an efficient
capital structure or lower debt ratio by excluding several debt amounts. Basically,
the spin-off strategy does not change the levered ratios in consolidated financial
statement. But this strategy somehow will help business to get better financial ratios
of parent company. The parent company has high opportunities to be raised its
credit by rating agencies. There are also alternative solutions of internal financing
(Nguyen, 2010) such as pre-sale system to the buyers or diversified business sector
in order to stay in the market. In general, the author specifies their mechanisms by
typical examples in the data set.
1.3 RESEARCH QUESTIONS
What the key determinants make the significant exposures on capital
structure in Vietnamese real estate enterprises which importantly need to be
4
answered in this study. The efficient optimization will be an answer for those real
estate enterprises which are struggling with debt and interest coverage in different
business prospects.
In general, the optimal level will follow the industrial benchmarks of
different stages of economy. Basing on previous theories of trade-off and pecking
order, there can be several questions, which concern the choice of capital structure,
are tested by statistics and regression model. The writer mentions them in three
assumptions: firstly, the debt leverage of one company adjusts to go down gradually
during the current crisis. Secondly, real estate companies will struggle with less
financial budget by debt issuers. Finally, the relationship between debt and
profitability is expected to perform a divergent trend. This would help writer to
analyze and evaluate Vietnamese listed real estate corporations with respect to
capital structure.
1.4 SCOPE OF STUDY
In this paper, the writer would like to use panel data which combined both
cross section and time series. Panel data tends to provide more accurate estimations
of related determinants in regression model. Furthermore, it allows us to identify
and measure exactly the changes of determinants which we cannot detect by single
cross section or single time series methodology. Fixed Effect Model (FEM) and
Random Effect Model (REM) are comparative methodologies to evaluate the
significant results of regression model. The test of Hausman will be applied to
differentiate between FEM and REM.
There are 56 observations in the data set. They are listed real estate
companies in Vietnamese stock market. The primary data, including balance sheet,
income statement and cash flow statement are collected from State Securities
Commission (SSC). The survey period is limited from 2010 to 2013
5
1.5 STRUCTURE OF THESIS RESEARCH
The thesis research consists of five chapters: presentation, literature review,
research methodology, results and explanations, and conclusions. In details, chapter
I will mention briefly about an overview of this study, research objectives, research
questions, and scope of the study. Next, chapter II will discuss about literature
review of pecking order and trade-off theories from previous studies. Chapter III
will be an essential part of this study to demonstrate analytical framework, research
methodology, data collection and introduction of determinants. In the next part,
chapter IV is the section to consider about results and explanations of regression
model testing the statistical significance between FEM and REM. Finally, chapter V
is the last part to mention about conclusions of this study. Major findings and
limitations also imply directly to improve the results of further researches.
6
CHAPTER II: LITERATURE REVIEW
This chapter will present the principal of Modigliani and Miller, pecking
order, and trade-off theories. Each of theories evaluates the different purposes of
capital structure related to financial decisions of company. There are two parts in
this chapter. Firstly, the empirical studies review the efficiencies of previous papers.
Secondly, hypothesis of variables will explain their specific impacts on capital
structure.
2.1 REVIEW OF EMPIRICAL STUDIES
Modigliani and Miller (1958), two famous foundations of corporate finance,
clearly explained the concept of capital structure needed to be generated the great
interests among financial researchers. The general idea of their theorem mentioned
that a levered company enjoyed the more benefits than those companies without
using leverage. They stated strongly that an optimization of debt level reasonably
adjusts to business values and cost of using capital. In particular, the company
would tentatively increase or decrease their debt levels in order to not only balance
healthy capital structure but also maximize their earnings.
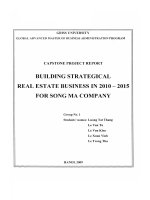
The trade-off model presented an optimal debt level to utilize perfectly the
earning interest depending on the preferential tax reduction and costs of distress
occurring once the corporation faced with financial difficulties. This suggestion
simply changes the company’s financial decisions from the actual level of debts
towards the optimal ones. A business which obtains the greater investment
opportunities and profitability, the more leverage methodologies they expect to use
as the definition of trade-off theory developed by two authors of Fama and French
(2002). According to Modigliani and Miller (1963), totally agreed that trade-off
theory would reflect the company’s ambition on debt level, and then the owner of
the firm was seeking much higher levels of debt than people see in reality to
7
maximize their business values in the stock market. In figure 2.1, a high level of
debt helps the firm to increase its own value by advantages of tax shield and
financial discipline. At the optimal peak, the firm fails to rise in its value.
Bankruptcy costs may reflect the fixed costs, which owner will pay permanently
while agency costs come from the interest expenses. These two factors will push not
only the value of firm lower, but also the debt level continues to rise.
Figure 2.1: Trade-off Model
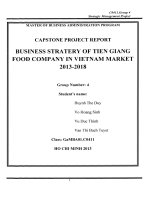
Following the previous research paper from Frank and Goyal (2005),
Pecking Order hypothesis implies the simplest definition of debt ratios which
typically tends to rise up once new investment opportunity dominates the current
company’s risk and to fall if the gain payoff cannot offset the equivalent risk.
Furthermore, almost all discussions keep maintaining some versions of other special
things by interpreting the relative use of internal and external funds. In details, their
findings suggest that the more profitable the companies wish to earn, the less
levered they use for business activities. It is no doubt to say that there is an absolute
consistent with the Pecking Order. Enterprises mostly are insensitive to change their
8
capital structures unless there will potentially occur unexpected crisis. It explains
clearly that there was a very slow adjustment speed towards an optimal level of
debt. In figure 2.2, Pecking Order explains different considerations from board
managements. They want to keep internal capital rather than raising funds budget
from outside financial institutions. This underlying debt has no costs and helps the
owners to feel relax to decide the firm’s objectives.
Figure 2.2: Pecking Order
So, this paper applies the principal theories of pecking order and trade-off,
which are able to test the determinants of corporate capital structure. By the way,
different economic scenarios are also affecting on corporate level of debt. The
conflicts of effects between Trade-off and Pecking Order are distracting manager’s
financing decisions. In consequences, the statistic results will somehow explain the
difference and efficiency in each theory. Some evidences proved that the Pecking
Order is the most ultimate methodology than Trade-off to change the current debt
level.
9
However, because of the differences in asset management and intervention of
government policies, real estate companies may be impacted by single trade-off or
pecking order theory. The simultaneous presence of both theories is extremely rare
at the same period (Meng and Wang, 2012). This will make the firm struggling with
interest disputes between shareholders and debt owners. Therefore, the level of
explanation may not prove absolutely in this crisis stage with the appearance of
externalities.
The specification of each determinant will imply the different impact on
deficit finance or debt ratio of capital structure. The writer also considers about the
change of asset mobilization in real estate enterprises will make a greater effect on
level of debt. This would explain by huge inventories (normally hold the large
proportion of capitalization). The writer also hopes that the more income the real
estate companies earned, the lower debt level which was demonstrated obviously by
pecking order. Those companies tend to use internal capital supporting to their own
business rather than external financing such as financial institutions or credit
lenders.
The trade-off model is expected to put the risk on business activities. It
means that a firm needs to accept more risks to acquire higher growth rate of
business development. However, the writer considers about the dynamic momentum
of real estate development in Vietnam. They are more rooms to grow potentially in
further decades. Now they just need time to adjust optimal level of debt to keep
growing and expanding their market shares. Restructuring market is the prior path
to rebalance supply and demand for Vietnamese real estate sector. This helps to
illuminate the economic growth, and to enhance the living standards for the whole
society. In consequences, an increasing level of debt is inevitable trend for Vietnam
real estate companies.
10
2.2 HYPOTHESIS OF VARIABLES
To demonstrate these expected impacts, the writer considers to present
regression model in next coming chapter. The data is arranged by panel data which
is followed two comparative statistical models between FEM and REM. Debt ratio
is dependent variable which is calculated by total liability over total asset. There are
five determinants to explain the different impacts on debt ratio. Analytical
framework will also be appeared in the initial part of the next chapter to illustrate
how the regression model is working and specifications of each determinant in
terms of signs (positive or negative trend).
2.2.1 Dependent Variable: Debt Ratio
Total Liability/Total Assets is the general concept of debt ratio to mention
about how many percentages of assets which are built up from liability obligation.
By evaluating this ratio, we can easily consider the financial health status of real
estate enterprises. However, the limitation of this ratio is that in case any enterprises
had many large accounts of payment to suppliers, deferred revenues, tax and other
payables to the State budget, etc. Accordingly, this ratio will exaggerate the
financial leverage of enterprises. The higher total liability over the total assets
shows the lower independence of equity, and as the consequence, the enterprises are
struggling with financial crisis due to pressure of debt interest.
2.2.2 Independent Variables
a) Profitability
There is no consistent estimation on the effects of profitability on capital
structure. A profitable firm normally has many incentives to raise more debt levels
to enjoy the benefits from tax shield advantages (Booth et al., 2001). Specifically,
11
the pecking order theory demonstrates that corporations would prefer the budgets
which came from internal funds such as retained earnings rather than external funds
from financial institutions. It performs true effect of pecking order to explain the
impact of profitability on debt ratio. However, when the corporations are facing
with financial distress and external fund needs to be supported urgently, the prior
choice is to borrow debts from outside financial institutions, then possibly with the
corporate bonds, and consequently with equity, such as preferential shares as a final
mandate (Brealey and Myers, 1991). In contrast, the trade-off theory imply the
positive trend between profitability and debt ratio by the reason “more leverage
created more incomes” (Bowen et al., 1982). In this paper, the writer would like to
test the earnings before interest, taxes, depreciation, and amortization (EBITDA)
divided by enterprise value (EV) as an indicator of profits in business activities. It
seems to be more suitable than the ratio of EBIT divided by total assets due to
specifications of real estate industry. Most of real estate corporations may inherent
some indirect assets which are under constructions or gain extra goodwill income.
Enterprise value absolutely provides a clearer outlook of companies than their own
total assets. The inverse trend between leverage and profitability would expect to
change in different economic scenarios.
b) Company’s Size
From the previous studies, Rajan and Zingales (1995) stated that impact of
size on capital structure is ambiguous issue. They claimed that a larger firm will
face with low probability of bankruptcy. Frank and Goyal (2003) confidentially
wrote down in their thesis that an inverse movement between business scale and
bankruptcy risk. Their abstracts mentioned about the dilemma situation of giant
holdings to consider whether they should trigger advanced level of debt or not to
expand their assets. They provided a conclusion of the larger firms should be more
leveraged. It means that a historic and reputable firm normally received a high
credit rating score or low default risk evaluation and was able to attract more
12
attention from financial analysts and rating agencies. Clearly, larger firms may issue
new amount of debts with less capital costs. The business scale and leverage should
be on the same movement depending on above logic. In conclusion, for the
relationship between size and debt ratio, the pecking order claimed the negative
signs while there is positive sign of trade-off model.
c) Risk of Business Activities (volatility)
The volatility from business performance is the best representative indicator
to measure the probability of risk. According to trade-off model, when the standard
deviation of profitability was increasing, the expected returns also tend to increase
as the normal consequences (Kester, 1986). The business risk would increase in
higher level due to the volatility of earnings. However, a negative relation is found
by (Bradley et al., 1984) and (Titman and Wessels, 1988). In this study, the author
wants to follow Booth et al. (2001)’s formula framework by calculating a
periodically standard deviation in each of real estate companies. The volatility of
earnings
before
interest,
taxes,
depreciation,
and
amortization’s
growth
(EBITDA_GROWTH) in fiscal year basis will indicate well the risk from business
performances. For this determinant, the author generally puts the positive sign for
the standard deviation of EBITDA_GROWTH and debt leverage to test how
effective the enterprise would increase 1% of leverage to create an amount of
earnings.
d) Depreciation
Some previous empirical studies confirmed the theoretical prediction of
trade-off model, such as Kim and Sorensen (1986) confirmed the positive
relationship of depreciation and debt ratio. However, a negative relation between
non-debt tax shields and leverage is also found by (Huang and Song, 2002) and
(Titman and Wessels, 1988). They mentioned that when an asset depreciates, its
13
book value also decreases by the amount of accumulated depreciation. Assuming
that total liabilities remained at the original level, the total liabilities over total
assets ratio was moved to higher phase by the lower value of total assets. In this
study, the writer follows Titman and Wessels (1988)’s methodology to calculate the
depreciation ratio by collecting enterprise’s depreciation in fiscal year basis, finally
divided by total assets. In consequences, the relationship between depreciation ratio
and debt leverage performs an inverse discretion.
e) Debt Interest
Normally, the costs of financial divisions come from interest expenses.
Zhang and Li (2008) revealed that higher interest expenses will stimulate the debt
leverage. Basing on trade-off theory, they demonstrated the evidence that interest
expenses became a tax shield to reduce the amount of taxes, and created an
incentive to use the high amounts of debt eventually. However, a rise of interest
expense will also unexpectedly argue the conflict between debt holders to equity
holders, and the shareholders to managers. The positive significance of these
determinants to debt ratio will be likely to expect in regression model.
Indicators
Brief definition
Profitability
EBITDA divided by EV
Company’s Size
Volatility
Depreciation ratio
Debt Interest
Natural Logarithm of
Total Assets
Standard deviation of
EBITDA
Expected signs
(+)Trade-off
(-)Pecking Order
(+)Trade-off
(-)Pecking Order
(+)Trade-off
(-)Pecking Order
Depreciation divided by
(+)Trade-off
total assets
(-)Trade-off
Natural Logarithm of
Interest Expenses
Table 2.1: Expected signs of five related determinants
14
(+)Trade-off
CHAPTER III: RESEARCH METHODOLOGY
From previous studies, the writer points out five determinants which have
different effects on capital structure. Debt ratio will be presented for dependent
variable in regression model. There are two main parts in this chapter. They are
analytical framework and introduction of the regression model. The analytical
framework reviews the impact of independent variables on debt ratio while
regression model describes the model’s shape, method of data collection and
research statistic.
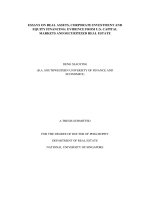
3.1 ANALYTICAL FRAMEWORK
Figure 3.1: Analytical framework of capital structure’s determinants
As shown in figure 3.1, the framework analyses the consequence of cause
and effect that may provide ultimately the relationship results. In the graph,
internalities and externalities are two main factors which cause the greatest effect on
capital structure. As the writer mentioned in previous parts, the externalities of
government policies and management levels should not test in this paper due to lack
of information. For the internal determinants, there are five factors such as size,
profitability, volatility, depreciation ratio, and debt interest costs that may give the
15
clear impact to debt ratio. Basing on historic researches of authors, they typically
concluded the different signs of each factor towards debt ratio.
3.2 REGRESSION MODEL
3.2.1 Assumptions of Regression Model
a) The first assumption is that the writer will use five determinants which
have an impact on debt ratio. If one company are seeking new amount of inflow
capital by borrowing from credit issuers, the creditor will carefully consider about
the current debt ratio of the firm. Almost Vietnamese real estate corporations have
depended heavily on capital lending from commercial banks or financial credit
issuers.
b) The next assumption will be the relationships between debt ratio and each
of independent variables Xi which are linear in the parameters of the specific
functional form chosen (basing on descriptive statistics). Furthermore, the writer
also uses the quadratic term to check whether the nonlinear relationship between
debt ratio and each of independent variables happened in the regression model. By
completing the square of each determinant and adding them to statistical equation,
the writer received no significant improvement of squared determinants to
regression model.
c) Fixed Effect Model (FEM) and Random Effect Model (REM) are
comparative statistical methodologies which will be used in this regression model.
The test of Hausman will choose the best response to put in the regression model.
16
3.2.2 Limitations of Regression Model
a) In regression model, the writer only discusses on internal determinants.
The external determinants of government policies and management skills are
ambiguous information and the lack of data. They are determined by social
preferences and business development respectively. The effect of externalities will
be explained more in part of the conclusions.
b)
Some outliers seem to be quite influential in the data set. If these
observations made any significant changes in result, we would like to use dummy
data points for regression model.
c) Data set is short duration (from 2010 to 2013). So, it would not perform
well the status of observation due to time lags.
3.2.3 Equation of Regression Model
𝑫𝒆𝒃𝒕𝒓𝒂𝒕𝒊𝒐 = 𝜷𝟎 + 𝜷𝟏𝑿𝟏 + 𝜷𝟐𝑿𝟐 + ⋯ + 𝜷5𝑿5 + 𝜺
Where:
- Debt ratio is calculated by total liability over total asset
- 𝑋1, 𝑋2, 𝑋3, X4, and X5 are presented by depreciation ratio, size, debt
interest, profitability, and volatility respectively.
- 𝛽1, 𝛽2, 𝛽3, 𝛽4, and 𝛽5 are coefficients of each determinant
- 𝛽0 is intercept term
- 𝜀 is the error term
3.2.4 Data
All data sources are available at the State Securities Commission of Vietnam
(SSC) from 2010 to 2013. There are total 56 real estate companies are listed on Ho
17
Chi Minh Stock Exchange (HSX) and Hanoi Stock Exchange (HNX). The main
standard of those selected companies is that their market capitalizations must be
over 100 billion VND. Some of them are diversified in many real estate sub-sectors,
including consultant, supplier, contractor, etc. In this paper, the author uses
descriptive statistics to observe the current debt ratio in Vietnamese listed real estate
companies. The comparative statistical models of FEM and REM will provide the
effect of five determinants to changes in debt ratio. The data set will design as dated
panel data, which identify company’s names as cross section series and years as
date series.
This paper focuses on the period of time from 2010 to 2013 when Vietnamese
real estate market just slightly passed over the bottom of crisis. At this stage, the
bubble of real estate industry seems to be predictably triggered by tight monetary
policies in order to reduce the hike rates of inflation, and to stabilize the
macroeconomics. The cutting credit for the real estate market causes a negative
impact on real estate companies. The prices of land, housing, and office lease had
declined significantly to the lowest level, which most of investors forced to sell-off
about 50% from their original values, compared to the past gorgeous period. The
failure of price equilibrium between sellers and buyers in this process also leaded to
the low trading liquidity, bankruptcy, and high unemployment rate in real estate
sector.
3.2.5 Research Method
Descriptive statistics presents the brief summaries of observations in data set.
The descriptive graphs also mention about the dispersion or central tendency of
observations. The Regression line will point out the relationship between debt ratio
and its determinants. The author bases on result of this test to confirm the shape of
regression model. The matrix correlation also presents to test the multicolineary of
related determinants in regression model.
18