Topic 3 ENGLISH ACCOUNTING
Bạn đang xem bản rút gọn của tài liệu. Xem và tải ngay bản đầy đủ của tài liệu tại đây (1.1 MB, 12 trang )
Cost-Volume-Profit Relationships
Topic 03
5-2
• What is the implication of Contribution margin per unit?
• What is the implication of Contribution margin ratio?
5-3
Break-even point
Break-even point
in units sold
Break-even point in
total sales dollars
Fixed expenses
Unit contribution margin
=
=
Fixed expenses
CM ratio
5-4
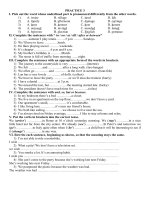
CVP Graph
$
Sales
Total costs
Fixed costs
units
5-5
Incremental analysis
Racing Bicycle is currently selling 500
bikes per month. The company’s sales
manager believes that an increase of
$10,000 in the monthly advertising
budget would increase bike sales to 540
units.
Should we authorize the requested
increase in the advertising budget?
5-6
Incremental analysis
$80,000
$80,000++$10,000
$10,000advertising
advertising==$90,000
$90,000
Sales
Salesincreased
increasedby
by$20,000,
$20,000, but
butOperating
Operatingincome
income
decreased
decreasedby
by$2,000
$2,000. .
5-7
Incremental analysis
The Shortcut Solution
5-8
Target Profit Analysis
Suppose Racing Bicycle wants to know how
many bikes must be sold to earn a profit of
$100,000.
5-9
The Margin of Safety
Excess of budgeted (or actual) sales over
the break-even volume of sales. The
amount by which sales can drop before
losses begin to be incurred.
Margin of safety = Total sales - Break-even sales
5-10
Operating Leverage
• A measure of how sensitive operating income is
to percentage changes in sales.
• With high leverage, a small percentage increase
in sales can produce a much larger percentage
increase in operating income.
Degree of
operating
=
leverage (DOL)
Degree of
operating leverage
∆% Operating income
∆% Sales
=
Contribution margin
Operating income
5-11
The Concept of Sales Mix
• Sales mix is the relative proportions in which a
company’s products are sold.
▫In units
▫In dollars
• Average contribution margin per unit =
∑ UCMi X unit sales mixi
• Average contribution margin rate =
∑ CM ratioi X $ sales mixi
5-12
End of Topic 03