Impact of financial liberalization on private savings rate a panel data analysis
Bạn đang xem bản rút gọn của tài liệu. Xem và tải ngay bản đầy đủ của tài liệu tại đây (1.6 MB, 122 trang )
UNIVERSITY OF ECONOMICS
INSTITUTE OF SOCIAL STUDIES
HO CHI MINH CITY
THE HAGUE
VIETNAM
THE NETHERLANDS
VIETNAM – NETHERLANDS
PROGRAMME FOR M.A IN DEVELOPMENT ECONOMICS
IMPACT OF FINANCIAL LIBERALIZATION ON
PRIVATE SAVINGS RATE:
A PANEL DATA ANALYSIS
MASTER OF ARTS IN DEVELOPMENT ECONOMICS
BY
Mr. LE THANH THANH
Academic Supervisor:
Dr. NGUYEN HOANG BAO
Ho Chi Minh City, April 2016
3
ABSTRACT
This paper investigates the impact of financial liberalization on private savings rate.
The study covers the data of 58 countries from 1980 to 2005. The Abiad et al (2008)
database was used to measure the financial liberalization indices. Three-Stage Least
Squares (3SLS) was chosen as the main estimator of this study. The finding results show
that financial liberalization has both direct and indirect effect on private savings rate. The
direct effect, through state ownership in the banking sector, credit controls and excessively
high reserve requirements, entry barriers, prudential regulations and supervision of the
banking sector, capital account restrictions, interest rate controls, reduces private savings
rate while indirect effect, through entry barriers and capital account restrictions, are
increasing. Besides that, the findings also show an ambiguous correlation between
economic growth and the private saving rate. However, using de jure indicators to measure
financial liberalization makes the study can only identify the existence and direction of the
impact of financial liberalization on the private savings rate. The intensity of this impact
can not yet be measured. In addition, the observed data only updated to 2005 and not focus
on any special group of countries. So, it is not appropriate to recommend a particular policy
based on the results of this study.
Keywords: financial liberalization, private savings, panel data
4
ACKNOWLEDGEMENT
Foremost, I would like to sincerely and gratefully thank Dr. Nguyen Hoang Bao,
my supervisor, for his great support, crucial advice, and precious during my thesis finish.
Without his guidance, I am unable to finish this thesis.
Besides, I special thanks to the Vietnam – Netherlands Programme, especially
professors and staffs for their help during my thesis process.
I would like to thank all my friends who always beside me to encourage, help me
when I got stuck in doing the thesis and want to give up. Without them, I cannot finish this
thesis.
Last but not least, I would like to thank my family for their sacrifices for supporting
me not only in doing thesis but also in my life.
5
CONTENTS
ACKNOWLEDGEMENT .......................................................................................................................... 5
CONTENTS................................................................................................................................................. 6
LIST OF TABLES ...................................................................................................................................... 8
LIST OF FIGURES .................................................................................................................................... 9
CHAPTER ONE: INTRODUCTION ..................................................................................................... 10
1.1
Problem statement .................................................................................................................... 10
1.2
Research objectives and research questions ........................................................................... 12
1.3
The structure of research ......................................................................................................... 13
CHAPTER TWO: LITERATURE REVIEW ........................................................................................ 14
2.1
Theoretical literature ................................................................................................................ 14
2.1.1
Private savings ................................................................................................................... 14
2.1.1.1
Definition ....................................................................................................................... 14
2.1.1.2
Theoretical models of saving function ......................................................................... 15
Keynesian savings function .............................................................................................. 16
Life cycle theory ................................................................................................................ 18
The Mckinnon - Shaw Hypothesis ................................................................................... 20
2.1.2
Financial liberalization ..................................................................................................... 24
2.1.2.1
Definition ....................................................................................................................... 24
2.1.2.2
Financial liberalization indices .................................................................................... 27
2.1.2.3
Process of financial liberalization ................................................................................ 28
2.1.2.4
Criticism of financial liberalization ............................................................................. 31
2.1.3
Economic growth............................................................................................................... 32
2.1.3.1
Definition ....................................................................................................................... 32
2.1.3.2
Theoretical models of economic growth ...................................................................... 33
Classical growth theory .................................................................................................... 33
Dual-sector model ............................................................................................................. 33
Keynesian growth theory.................................................................................................. 34
Harrod–Domar model ...................................................................................................... 35
Solow model ....................................................................................................................... 35
P.A. Samuelson theory ...................................................................................................... 36
2.1.4
The relationship between private savings, economic growth and financial
liberalization ...................................................................................................................................... 37
2.2
Empirical literature .................................................................................................................. 43
6
2.2.1
General saving function .................................................................................................... 43
2.2.2
Financial liberalization and private saving rate ............................................................. 45
CHAPTER THREE: RESEARCH METHODOLOGY........................................................................ 47
3.1
Model descriptions .................................................................................................................... 47
3.1.1
Model specification ........................................................................................................... 47
3.1.2
Method specification ......................................................................................................... 52
3.2
Variable measurements ............................................................................................................ 55
3.2.1
Measurement of private savings rate .............................................................................. 55
3.2.2
Measurement of financial liberalization ......................................................................... 56
3.3
Summarize of variables description and data sources........................................................... 59
CHAPTER FOUR: RESULTS ................................................................................................................ 62
4.1
Description statistics ................................................................................................................. 62
4.2
Estimation results...................................................................................................................... 71
CHAPTER FIVE: CONCLUSIONS ....................................................................................................... 76
5.1
Major findings and policy implication .................................................................................... 76
5.2
Limitations ................................................................................................................................. 77
REFERENCES .......................................................................................................................................... 79
APPENDIX ................................................................................................................................................ 89
A.
Financial liberalization measures ................................................................................................ 89
B.
Coding rule of Abiad et al financial liberalization indices ........................................................ 95
C.
List of countries ........................................................................................................................... 102
D.
Detailed econometrics estimating and testing results .............................................................. 103
7
LIST OF TABLES
Table 2.1. Determinants of the Ratio of Private Saving to Income in Panel Studies ........ 43
Table 3.1 Description and expected sign of variables ....................................................... 52
Table 3.2 The direction of combined effect ...................................................................... 54
Table 3.3 Summary Statistics for Financial Liberalization Components and Index (Abiad
et al, 2008) ......................................................................................................................... 58
Table 3.4 Variable description and data source................................................................. 59
Table 4.1: Descriptive statistics ......................................................................................... 62
Table 4.2: Correlations among financial liberalization indices ......................................... 63
Table 4.3 The effect of seven financial liberalization indicators on private savings rate . 70
8
LIST OF FIGURES
Figure 2.1: Life cycle theory ............................................................................................. 18
Figure 2.2: The effect of interest ceiling rate on saving and investment .......................... 21
Figure 2.3: The Mckinnon and Show hypothesis .............................................................. 22
Figure 2.4: Financial liberalization process....................................................................... 29
Figure 3.1: The interaction between Financial liberalization, Private savings and Economic
growth ................................................................................................................................ 47
Figure 4.1 The average private saving rate, economic growth and financial liberalization
(1980 - 2005) ..................................................................................................................... 64
Figure 4.2 Private saving rate (PSR), GNDI per capita growth rate (GY) and Financial
liberalization indices (1980 - 2005) ................................................................................... 66
Figure 4.3: Scatter plot between Private saving rate (PSR) and Financial liberalization
indices (1980 - 2005) ......................................................................................................... 68
9
CHAPTER ONE: INTRODUCTION
1.1 Problem statement
From the mid-1980s, many developing countries undertook to liberalize its financial
markets. This process is considered to be one of the important factors in promoting national
economic development as well as promoting economic integration in the world economy.
Studying about the impact of financial liberalization on the country’s economy, therefore,
is a very interesting topic.
Although there have been many studies on this subject, however, there are a lot of
issues have not yet been settle and must be discussed further. One of them is the impact of
financial liberalization on savings. Beginning with McKinnon (1973) and Shaw (1973)
theory, they suggest that financial liberalization will break the government intervention on
interest rates, pulling interest rate up to the natural equilibrium of the market, thus
increasing the savings rate. Many subsequent studies have tried to find a deeper
understanding as well as testing this hypothesis (Giovannini, 1985; Campbell and Mankiw,
1990; Ostry and Reinhart, 1992; Koskela, Loikkanen and Viren, 1992; Bayoumi, 1993;
Jappelli and Pagano, 1994; Ogaki, Ostry and Reinhart, 1996; Bandiera et al, 1999; Loayza
et al, 2000; Chowdhury, 2001; Hebbel and Serven, 2002; Reinhart and Tokatlidis, 2003;
Baliamoune and Chowdhury, 2003; Nair, 2006; Ahmed and Islam, 2010; Ang and Sen,
2011). However, the results are still ambiguous. Some studies show the positive impact of
financial liberalization on savings (Bandiera et al, 1999; Baliamoune and Chowdhury,
2003; Ahmed and Islam, 2010), while others indicate that financial liberalization is the
cause that reduce savings rate (Koskela, Loikkanen and Viren, 1992; Jappelli and Pagano,
1994; Loayza et al, 2000; Ang và Nair, 2006; Sen, 2009; Ang, 2011). Besides, there are
other studies resulting an unclear relationship between these two factors (Bayoumi, 1993;
Hebbel and Serven, 2002; Reinhart and Tokatlidis, 2003).
One of the limitations of previous studies is the difficulty to measure accurately
financial liberalization. This led to the following weaknesses:
10
First, many studies measure financial liberalization very rudimentary. They used a
dummy variable with value 0 and 1 to measure financial liberalization (Harris, et al., 1994;
Haramillo, et al., 1996; Hermes and Lensink, 1998; and Bekaert, et al., 2005).With 0 for
year financial repression and 1 from the year starting financial liberalization. In fact, it is
clearly that financial liberalization is a process, not simply as an event. The financial
markets have gone through many stages to reach a certain degree of liberalization, it can
not be changed in a short time.
Second, some studies focus only on one or several aspects of financial liberalization
as opening up banking and stock Domestic Markets to Foreigners (Levine, 2001), capital
account liberalization (Eichengreen and Leblang, 2003) and stock market liberalization
(Bekaert, et al., 2005). Financial liberalization, in fact, is a process that includes a lot of
stages and different aspects. The review merely on one or a few aspects can not bring the
expected results.
Another thing should also mention when referring to aspects of financial
liberalization is: most previous studies have focused on building a general index reflecting
the financial liberalization of the country. The general index is constructed primarily by
summing the possible aspects of financial liberalization can be measured. Principal
component analysis (PCA) is a method often used. This inadvertently leads to two
following consequences:
-
This index may consist of two parts: policies have an effect on private saving and
policies have not (or insignificant) effect. The combined all of those effects could
not provide a specific and detailed view of the impact of financial liberalization.
Factors have
significant effect
General financial
liberalization index
Factors have
insignificant effect
11
-
The factors that affect private savings may include two smaller groups. One group
has a positive impact when the other has a negative impact. The combination of all
these factors that could make them eliminate or weaken each other, leading to
undesirable results in the research process.
Positive effect
General financial
liberalizaation
index
Factors have
significant effect
Negative effect
Factors have
insignificant effect
The last issue is the surprisingly lacking cross countries analysis. Most previous
studies have only focused on one country or a small group country. On average, the study
of each country or each group of countries often give a different result. The research on a
broad perspective with a larger data sets will bring more general accurate judgments on
this issue.
This study uses a new data set in which financial liberalization is divided into
multiple fragments in order to approach and examine the impact of financial liberalization
on saving more specific and detailed. Besides, as mentioned above, the limited studies
within the country or a small group of neighboring countries often lead to different results.
This study uses large data sets with more than 50 countries in many regions around the
world which differ the level of socio-economic development in hopes of eliminating or
limiting the effects of the exogenous variation distort the impact of financial liberalization
on private savings, and shows the pure and raw effects of the relationship between these
two factors.
1.2 Research objectives and research questions
To resolve the problem the first two issues, this study use Abiat et al (2008) data set
to measure financial liberalization. This database divides financial liberalization into seven
12
small indices represents for seven different aspects, including interest rate controls, credit
controls and reserve requirements, state ownership, entry barriers, policies on securities
markets, restrictions on the capital account, and banking regulations. This study expects to
find more specific results about the impact of financial liberalization on private savings
rate.
To resolve the third issue, this study used a large data set for 58 countries around
the world in hopes of providing a most general theoretical view about that relationship.
With those main purposes, this study will answer two following questions:
-
Does financial liberalization effect on private saving rate?
-
How does each channel of financial liberalization, including interest rate controls,
credit controls and reserve requirements, state ownership, entry barriers, policies on
securities markets, restrictions on the capital account, and banking regulations,
effect on private saving rate?
1.3 The structure of research
This study is organized into five sections. Chapter one presents an overview of the
main objectives of this study. Chapter two overviews of theoretical background as well as
present and comment on the previous empirical studies. The analytical framework of the
study is also presented in this chapter. Measurement and analysis of the data analysis are
discussed in chapter three. Chapter four covers research methodology, empirical model and
the results of the regression model. The final chapter, chapter five summarizes the research
results that have been achieved, some limitations in the study and ideas for further research.
13
CHAPTER TWO: LITERATURE REVIEW
The theoretical literature section introduces a general overview about private
savings, financial liberalization, and economic growth. The definition, theoretical models,
criticism as well as the relationship between them are mentioned. This section aim to point
out the analytical framework of this study. Afterward, the empirical literature section
synthesizes numerous studies on general savings function and the relationship between
financial liberalization and private savings rate.
2.1 Theoretical literature
2.1.1 Private savings
2.1.1.1 Definition
Savings, in general, is considered as a part of the income that is not used or the rest
of income after consuming. Along with the globalization of the economy, saving is defined
into two different types: domestic savings and national savings.
Domestic savings are the savings from the internal economy, is composed of two
parts public savings (savings from governments sector) and private savings.
In a closed economy, total national income Y is divided into three parts:
consumption (C), investment (I) and the shopping area of government (G):
Y = C + I + G (2.1)
Y–C–G=I
(Y – C – T) + (T – G) = I (2.2)
Where T is tax
This equation shows a balance between total saving and the total investment of the
country. In which, the left-hand side is domestic savings Sn, Y - C - T = Sp is the private
savings, T - G = Sg is saving of the government sector.
With an open economy, the identity (2.1) is rewritten as follows:
14
Y = C + I + G + NX
Where NX is net exports, which also can be seen as savings from abroad (Sf) or
capital inflow
Beside, Y –T = C + Sp => Y = C + Sp + T
(Sp –I) + (T –G) = Sf
I = Sp + Sg+ Sf= Sn+ Sf= S
National saving S is composed of Sn = Sp + Sg (domestic saving, including private
saving Sp and public saving Sg) and Sf (saving from abroad).
Focusing on the main subject of this study - private savings, we have:
Sp = Sn – Sg
Sp = S – (Sg + Sf)
Private saving the difference between domestic savings and public saving, or the
rest of national savings after removing public savings and savings from abroad.
2.1.1.2 Theoretical models of saving function
In Dictionnaire d'analyse économique (3rd edition, 2002), Bernard Guerrien has
commented that the classical economists and Marx consider saving as a behavior of rich
persons, it is almost merged to the surplus that social generated and accumulating for the
purpose of expanding production.
For the Neo-classical economics, saving primarily the result of an individual. It
comes from the choice between current consumption and future consumption. The Neoclassical economics said that the future is known with certainty (or with the risks have a
clearly limit). This makes each individual can make intertemporal choices most accurate.
Saving behavior, therefore, depends entirely on the interests and decisions of each
individual (life-cycle hypothesis), besides that, it also depends on the interest rate (the
model of financial liberalization by Mc. Kinnon and Shaw, 1973).
15
However, Keynes argue that the future is uncertain, do not have any model or
equation can help people to make intertemporal choices correctly. He considered saving as
a remainder, the rest after consuming. Thus saving is the result of a behavior that is
described through consumption function.
In this section, the study will review saving models mentioned above (life-cycle
hypothesis, the model of financial liberalization by Mc. Kinnon and Shaw, and the saving
function of Keynes).
Keynesian savings function
John Maynard Keynes, in his famous work - The General Theory of Employment,
Interest, and Money, mentioned consumption with some following ideas:
First, he said the basic psychological law of the consumer is that when incomes rise,
consumers will decide to increase consumption but with a less increasing level than income
growth. Marginal propensity to consume (MPC): 0 < MPC < 1
𝑀𝑃𝐶 =
∆𝐶
∆𝑌𝑑
Second, average propensity to consume (APC) tends to decrease as income
increases.
𝐴𝑃𝐶 =
𝐶
𝑌𝑑
Third, disposable income is the most important factor in deciding consumer
behavior and household savings. As disposable income increases, the consumption and
saving of households increases and vice versa.
From there he gave a consumption function as follow:
C = Co + MPC.Yd
16
In which Co is autonomous consumption (Co > 0), the minimum consumption, does
not depend on disposable income. Although income is zero, a household must spend a
minimum amount of Co for their basic needs. MPC is marginal propensity to consume,
showing the change of consumption as incomes changes one unit.
Disposable income Yd is used for two main purposes: consumption (C) and saving
(S), therefore, Keynesian saving function is derived from consumption function:
Yd = C + S
S = Yd – C
S = Yd - Co + MPC.Yd
S = - Co + (1 – MPC).Yd
Or: S = So + MPS.Yd
If C < Yd => S > 0: household is saving.
If C = Yd => S = 0: household do not save nor borrow.
If C > Yd => S < 0: household is spending more than their income.
The two key parameters that characterize the saving function are slope and intercept.
The slope is MPS (Marginal Propensity to Save), reflecting the change of savings
when Yd change one unit.
𝑀𝑃𝑆 =
∆𝑆
∆𝑌𝑑
MPS is assumed to be greater than zero but less than 1 (0 < MPS < 1)
Intercept So is autonomous saving, measuring the amount of saving undertaken if
income is zero.
Keynesian models still have some certain restrictions, especially in Keynes’s
conjecture about APC. But this is also the driving force for economists to continue further
research on consumption and saving behavior. I.Fisher (1930) realized that consumption
and saving of households not only depend on current income but also depend on the income
17
expected in the future. Then this idea continues to be studied and clarified, especially in
the life-cycle theory of Franco Modigliani income the permanent income hypothesis of
Milton Friedman.
Life cycle theory
In the early 1950s, Franco Modigliani and his student, Richard Brumberg,
developed a theory to analyze the behavior of the individual consumption, this theory is
called the life-cycle theory. Life-cycle theory determination an important role of the rate
of the population outside working age and income per capita in saving functions. Lifecycle theory was built on the micro perspective, with two basic assumptions:
-
The income of each individual will be low in the beginning and end of the lifecycle
(stages not within the working age).
-
Each individual has the desire to maintain a stable level of consumption throughout
their lifecycle.
Lifetime
Figure 2.1: Life cycle theory
Assume that there is a consumer who expects that he will live for T years and has
wealth W. He will work for R year and earning income Y each year. In this case, the
18
lifetime resources of consumer includes both original resources endowment, W, and
lifetime earnings, RY (the interest rate is assumed to be zero).
To to maintain a stable level of consumption, he distributes his lifetime resources
for T years. The consumption for each year in his lifetime, therefor, equal to:
His consumption function can be written as
Thus, the income each year Y throughout in R years is not used all for consumption.
𝑅
𝑅
𝑇
𝑇
The income spend for consumption in each of Y year is 𝑌, saving is 1 –
𝑌.
From saving behavior of each individual in society have been analyzed above,
saving in term of life-cycle theory can be generalized as follows:
Savings in a certain time will depend on the structure of the population and
determining by the difference between the savings of the population in the working age
and the over-consumption of the population outside working age. If the population is
growing (young population structure), the savings tend to decrease as the number of people
in working age increased more slowly than in the age group of adolescents. Conversely, if
the population grew slowly (older population structure), savings will increase due to the
population outside the working age increase more slowly than the population in working
age. Although the population of retirement age has increased but the decreasing savings
rate in this region is not much because of demand of consumption tends to decrease with
reducing income and the entering to final stages of the life-cycle.
In addition, other factors that affect directly or indirectly to the increased income
(economic growth, labor productivity growth) will be affected increase savings.
Saving function, in this case, can be modeled as follows:
19
S = f(D, Y, G,…)
Where:
S: saving rate/GDP
D: population outside the working age rate
Y: per capita income
G: economic growth rate
However, the weakness of this theory is assuming no bequest, no social security,
and no uncertainty. Many economists found out a problem in the life-cycle model: old
people do not dissave as quickly as has been assumed in the model. There are two
explanations for this fact:
First, there is an uncertainty in the future, therefore, retired individuals are usually
cautious about unpredictable expenses. The additional savings arising from this behavior
called precautionary savings. Precautionary savings may stem from living longer than
expected of an individual and, therefore, need to provide an extra living expenses for that
extra period of time. In addition, the cost for health care in old age are often quite large.
This makes the elderly saving more.
The second explanation is that the elderly may save more for their children. This
will reduce the saving rate.
The Mckinnon - Shaw Hypothesis
In another aspect, McKinnon and Shaw (1973) studied the savings under the impact
of financial liberalization, specifically the interest rate. The basic content of this theory said
that deposit rates have a positive impact on savings. Financial liberalization will remove
constraints on interest rate cap, push up interest rates, thereby increasing savings.
With the aim of promoting economic and create jobs, governments often intervene
in financial markets by keeping interest rate low. However, Kinnon and Shaw criticized
this action. They said that low-interest rate is the cause of poor saving situation. Investment,
20
therefore, is restricted and low investment efficiency. Kinnon and Shaw suggest that
financial liberalization will push interest rate up to the equilibrium level of the free market
in order to remedy that situation.
Three basic assumptions that Kinnon and Shaw given in their model are:
-
All the savings in the economy have been concentrated on the banking system in
the form of savings deposit.
-
The supply for the entire capital investment demand in the market come fully from
savings deposit.
-
Saving and investing are purely a function of interest rate. Saving is a positive
function of interest rate while investment is a negative function.
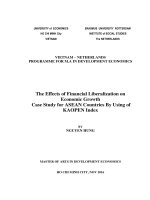
Figure 2.2: The effect of interest ceiling rate on saving and investment
The level of savings S0 corresponding economic growth g0 is a function of the real
interest rate. In a certain economic growth rate, the higher real interest rates the higher
savings. FF line represents financial repression policy. Nominal interest ceiling rate
applicable and makes real interest rate is limited below the equilibrium level. The amount
21
of actual investment is equal to the amount of savings I0 in real interest rates r0. Controlling
interest rate makes the amount of investment I0 clearly lower than the balance at the point
E. Besides the impact of reducing investment, interest ceilings rate reduces the efficiency
of investment because of the projects have lower returns now can be made.
In short, according to Kinnon and Shaw, financial liberalization will create the
following sequential processes:
-
Increase in real interest rates increases real savings in the economy
-
Increase in real savings will increase real investment
-
Increase in real interest rates increases investment efficiency
The result will be improved economic growth.
Figure 2.3: The Mckinnon and Show hypothesis
In figure 2.3, suppose that the interest rate ceiling is increased from FF to FF'. Real
deposit rates are now limited to r1 and make investments increased. The increase in interest
22
rates at the same time make the project has a low rate of return can not be done. The average
rate of return (or effectiveness) of loan projects thus increased. These effects make the
economic growth rate increased from g0 to g1. Saving curve shift to the right from S0
(corresponding to the economic growth g0) to S1 (corresponding to the economic growth
g1). Investments increased to I1.
If financial liberalization is strongly promoted with the completely removing
controls on interest rates, savings, investment and economic growth has been promoted.
Saving curve moves to position S2 corresponding to economic growth rate g2. Equilibrium
now is E2. The real interest rate is r2 and the amount of investment is I2.
According to this model, the real interest rate (the rate of return as that savers are
entitled) is the key to increased investment. Moreover, the impact of the increase in volume
and efficiency of investment interaction with each other and jointly promote economic
growth.
In turn, economic growth will stimulate saving in any public interest rate, and a new
cycle of influence begin. Kinnon and Shaw’s ideas have shown that financial liberalization,
the specifically rising real interest rate will affect saving through both two channels: direct
channel and indirect channel. Direct effects: rising real interest rate directly impact on the
income of savers, the increasing in returns will encourage saving behavior. Indirect effects:
increasing interest rate would improve the investment, leading to economic growth, people
have more asset will save more. Kinnon and Shaw's model took real interest rate as the
focus. However, besides that, this model also took into account the effects of economic
growth, savings of the previous year as well as the factors that directly influence the
growth. The savings of the previous year appear in this model because it represents for
wealth (or previous nonconsumption) which supposedly affect the current consumer
behavior through economic growth and wealth effect. Saving function in the model of
financial liberalization of Kinnon and Shaw can be written as follows:
S = f(G, Y, R, S(-1),...)
23
Where:
S: saving rate/GDP
G: economic growth rate
Y: income per capita
R: real interest rate
S(-1): saving rate /GDP previous year
The biggest criticisms against Mckinnon and Shaw’s financial liberalization theory
is that they did not take into account the effects of market failure.
One important function of financial markets is to collect, process and convey
information about the mobilization of savings, allocate capital and monitor the use of
capital. If it costs a lot of resources to get the information, then the market may fail. So,
building this theory base on the idea of the perfect market is not realistic.
The real interest rate increases by financial liberalization can bring unwanted effects
of adverse selection and moral hazard. First, when the interest rate increase, there is a
greater proportion of reckless investors apply for credit, but the prudent borrower will be
forced to leave the market as the expected profit on a loan contract of the prudent investor
might not be high enough to pay the loan interest rates(adverse selection). Second, the
borrower usually motivated to find ways to change the nature of their project to make it
become more risk (moral hazard).
2.1.2 Financial liberalization
2.1.2.1 Definition
At first, financial liberalization focuses on easing or elimination of government
control on the interest rate. Liberalizing interest rate is set at the center of financial
liberalization (Kinnon and Shaw, 1973).
24
However, at present, financial liberalization is not an end in the reduction of
government intervention on interest rates anymore. Terminology “financial liberalization”
is now much broader definition.
Basically, financial liberalization is easing restrictions on capital account (mainly
capital flows) and the financial transactions of individuals and businesses to promote an
easier implementation of these transactions, thereby making the allocation of financial
resources more effectively. Kaminsky and Schmukler (2003), Arestis and Caner (2004)
define financial liberalization as the elimination of controls on three components: the
capital account, the domestic financial sector, and the stock market.
On the other hand, financial liberalization is also determined by the reduction or
elimination of specific indicators of financial repression. It can also be seen as a process of
policy reform through which a country setting themselves an openness and more freely
financial markets in a suitable legal framework. The market forces will determine their
decisions themselves, without (or with a very little) intervention from the state (Williamson
and Mahar, 1998). Williamson and Mahar (1998) argues that financial liberalization has
six factors: interest rates deregulation, free participation in the banking sector, private
ownership of banks, bank autonomy, the removal of credit controls and liberalization of
international capital flows.
Baliamoune and Chowdhury (2003) suggest that financial liberalization including
the removal of controls on credit and interest rates, easier to participate in financial services
market, capital market development, strengthening prudential regulation and supervision,
and the international capital markets liberalization.
Abiad et al. (2008) supposed that financial liberalization has seven main sectors,
including interest rate controls, credit controls and excessively high reserve requirements,
the elimination of entry barriers, privatization of state-owned banks, securities market
policies, prudential regulations and bank supervision, and capital account restrictions.
25
An important issue when referring to the financial liberalization is that whether it is
necessary to distinguish clearly between financial liberalization and financial development
or not.
At the beginning, the economists talk about financial liberalization such as the
reduction of state intervention in the domestic economy. But with the development of the
world economy and the process of globalization, the concept of financial liberalization is
increasingly expanding. It is difficult to give an accurate general concept of financial
liberalization. Nowaday, the concept of financial liberalization are not confined to the
national framework but extends further into the international financial integration. While
financial development is generally defined as a process to improve the quantity, quality,
and efficiency of financial markets. Both financial liberalization and financial development
have certain impacts to economic growth. However, the clear distinction these two
definitions are quite difficult. In terms of nature, financial liberalization often refers to the
government as a barrier hindering financial market development. Purest idea of financial
liberalization is directed to a financial market as free as possible, the regulatory role of the
government as little as possible, the invisible hand is enough to drive the operation of
markets. In the concept of financial development, the role of the state seems to be more
emphasis. The state is one of the components has the most significant role in the
development of the financial markets of a country. In addition, financial liberalization often
leads to financial development, and vice versa, financial development often requires
financial liberalization accompanied. The ambiguity between these two concepts makes
studying sometimes unclear, especially in developing appropriate measurable indicators as
well as the exact role of each process in the process of economic development. Financial
development often vast and broader financial liberalization, however, financial
liberalization has the certain specific characteristic.
In this study, financial liberalization is considered in a broad sense, mainly based
on the opinion of Abiad et al. (2008).
26