Direct, indirect and total effect in spatial analysis of provincial FDI in vietnam
Bạn đang xem bản rút gọn của tài liệu. Xem và tải ngay bản đầy đủ của tài liệu tại đây (1.54 MB, 87 trang )
UNIVERSITY OF ECONOMICS
ERAMUS UNIVERSITY ROTTEDAM
HO CHI MINH CITY
INSTITUTE OF SCOCIAL STUDIES
VIETNAM
THE NETHERLANDS
VIETNAM – THE NETHERLANDS
PROGRAMME FOR M.A IN DEVELOPMENT ECONOMICS
DIRECT, INDIRECT AND TOTAL EFFECT IN
SPATIAL ANALYSIS OF PROVINCIAL FDI IN
VIETNAM
BY
LE VAN THANG
HO CHI MINH CITY, November 2016
UNIVERSITY OF ECONOMICS
ERAMUS UNIVERSITY ROTTEDAM
HO CHI MINH CITY
INSTITUTE OF SCOCIAL STUDIES
VIETNAM
THE NETHERLANDS
VIETNAM - NETHERLANDS
PROGRAMME FOR M.A IN DEVELOPMENT ECONOMICS
DIRECT, INDIRECT AND TOTAL EFFECT IN
SPATIAL ANALYSIS OF PROVINCIAL FDI IN
VIETNAM
BY
LE VAN THANG
ACADEMIC SUPERVISOR
DR. NGUYEN LUU BAO DOAN
HO CHI MINH CITY, November 2016
DECLARATION
“This is to certify that this thesis entitled “Direct, Indirect and Total effect In Spatial Analysis of
Provincial FDI in Vietnam”, which is submitted by me in fulfillment of the requirements for the
degree of Master of Art in Development Economics to the Vietnam – The Netherlands Programme
(VNP).
The thesis constitutes only my original work and due supervision and acknowledgement have been
made in the text to all materials used.”
Le Van Thang
i
ACKNOWLEDGEMENT
This thesis could not be accomplished without the supporting and the motivation that I have
received from many people. It is a pleasure to convey my gratitude to them all in my humble
acknowledgment.
Foremost, I would like to express my sincere appreciation to Dr. Nguyen Luu Bao Doan, my
supervisor. He gave me the greatest supporting, energetic assistance and valuable guidance as well
as an infinite patient to encourage me to complete my very first research. Without Dr. Nguyen Luu
Bao Doan, this study would never finish.
Besides, I also would like to give my gratitude to the Vietnam- Netherland Programme, especially
to all lecturers who provided me valuable knowledge, VNP staffs for their restless assistant for the
time I have been studying in VNP as well as School of Economics.
I would love to express my gratefulness to Prof. Nguyen Trong Hoai and Dr. Pham Khanh Nam
for the first suggestion to encourage me to deal with a novelty field of my knowledge - spatial
analysis. Moreover, I would like to give my sincere thankfullness to Dr. Pham Khanh Nam who
has provided a valuable data source for me to complete this thesis.
Besides that, I would like to thank all my friends, my fellows at the University of Economics, Ho
Chi Minh City, my groups and all the classmates in K20-VNP. All of them are always be my side
encourage and support me to complete the thesis.
Finally, I would like to send my gratefulness to my father, my mother, my two little brother, sisterVan Nam and Thuy Linh for their love, sacrifice, tremendous support for me not only to complete
this thesis but also for my whole life.
ii
ABBREVIATION
AIC: Akaike Information Criteria
ESDA: Exploratory Spatial Data Analysis
EU: European Union
FDI: Foreign Direct Investment
GDP: Gross Domestic Product
GSO: General Statistical Official
GRP: Gross Regional Product
PCI: Provincial Competitiveness Index
LM test: Lagrange Multiplier test
MPI: Minister of Planning and Investment
MNE: Multinational Enterprises
SAR: Spatial Autoregressive Model
SDM: Spatial Durbin Model
SEM: Spatial Error Model
USAID: The United States Agency for International Development
VCCI: Chamber of commerce and industry
VIF: Variance Inflation Factor
iii
ABSTRACT
This paper investigates the spatial pattern of Foreign Direct Investment (FDI) for all 63
provinces in Vietnam from 2011 to 2014. Empirical studies on locational determinants of FDI
typically neglected the spatial interaction among observations which lead to inefficient and biased
estimations. Indeed, Moran’s I suggested by Moran, which is used to detect the spatial
autocorrelation in data pattern of both dependent and independent variables, give hints of the
necessity of spatial econometrics in analyzing the FDI determinants.
Through General To Specific approach, the Spatial Durbin Model (SDM) has been chosen
as the most appropriate model, compared with other models like Non-spatial model, SpatialAutoregressive Model (SAR) and Spatial Error Model (SEM). This study finds that the FDI flow
into one province negatively spatially affects FDI inflow in remaining provinces. Moreover, by
applying SDM, this paper econometrically estimates the impact of host province’s determinants
and its neighbor determinants on its FDI inflow.
Keywords: Foreign Direct Investment, Moran’s I, Spatial analysis
iv
CONTENTS
DECLARATION ............................................................................................................................. i
ACKNOWLEDGEMENT ...............................................................................................................ii
ABBREVIATION...........................................................................................................................iii
ABSTRACT ....................................................................................................................................iv
LIST OF FIGURE.......................................................................................................................... vii
LIST OF TALBE .......................................................................................................................... viii
CHAPTER 1: INTRODUCTION .................................................................................................. 1
1.1 Problem statement ................................................................................................................. 1
1.2. Research objective................................................................................................................ 3
1.3. Research questions ............................................................................................................... 3
1.4 Scope of the study ................................................................................................................. 3
1.5. Thesis structure .................................................................................................................... 4
CHAPTER 2: OVERVIEW OF FDI IN VIETNAM ...................................................................... 6
2.1 Stages of foreign direct investment in Vietnam .................................................................... 6
2.2 Distribution of foreign direct investment among provinces.................................................. 8
2.3 Country of origin ................................................................................................................. 10
2.4 Sectors of foreign direct investment.................................................................................... 11
CHAPTER 3: LITERATURE REVIEW ...................................................................................... 14
3.1 Theories about location choices of foreign direct investment............................................. 14
3.1.1 The eclectic paradigm OLI ........................................................................................... 14
3.1.2 Agglomeration and foreign direct investment .............................................................. 16
3.2 The inter-dependence of FDI between locations................................................................. 17
3.2.1 MNE choice theory....................................................................................................... 17
3.2.2 Agglomeration effect .................................................................................................... 20
3.3 Empirical studies ................................................................................................................. 21
3.3.1 Empirical studies of FDI determinants in spatial analysis. .......................................... 21
3.3.2 Empirical studies of FDI determinants in Vietnam ...................................................... 23
3.3.3 Fundamental FDI determinants .................................................................................... 26
CHAPTER 4: DATA AND METHODOLOGY .......................................................................... 31
v
4.1 Data sources ........................................................................................................................ 32
4.1.1 Dependent variable ....................................................................................................... 32
4.1.2 Explanatory variables ................................................................................................... 33
4.1.3 Descriptive statistics ..................................................................................................... 36
4.2 Spatial econometric model .................................................................................................. 37
4.2.1 Spatial Autoregressive Model ...................................................................................... 38
4.2.2 Spatial Error Model ...................................................................................................... 38
4.2.3 Spatial Durbin Model ................................................................................................... 38
4.2.4 Marginal effect in Spatial Durbin Model ..................................................................... 39
4.2.5 Model selection............................................................................................................. 40
4.3 Pre-test for spatial existent with Moran’s I ......................................................................... 43
4.4 Spatial weight matrix .......................................................................................................... 44
4.5 Comparisons of models ....................................................................................................... 46
CHAPTER 5: EMPIRICAL RESULT.......................................................................................... 47
5.1 Direct effect ......................................................................................................................... 51
5.2 Indirect effect ...................................................................................................................... 54
5.3 Total effect .......................................................................................................................... 55
CHAPTER 6: CONCLUSION ..................................................................................................... 56
6.1 Main finding ........................................................................................................................ 56
6.2 Policy implication ............................................................................................................... 57
6.3 Limitation and future research ............................................................................................ 57
REFERENCES ............................................................................................................................. 59
APPENDICES .............................................................................................................................. 64
vi
LIST OF FIGURE
Figure 2.1: Registered, implement FDI (million USD) and Number of FDI projects .................... 7
Figure 2.2: The distribution of FDI in Vietnam from 1988 to 2014 ............................................... 9
Figure 2.3: The sector distribution of FDI .................................................................................... 12
Figure 3.1: Analytical framework of FDI and determinants......................................................... 31
Figure 4.1: General to Specific strategy ....................................................................................... 42
Figure 5.1: The Local Moran’s I of FDI inflow Vietnam in 2011-2012-2014 ............................. 49
vii
LIST OF TALBE
Table 2.1: Sharing of FDI in Vietnam from 1988 to 2014 ............................................................. 7
Table 2.2: Top ten countries of origin of FDI in Vietnam ............................................................ 11
Table 3.1: Multinational Enterprise Motivation ........................................................................... 18
Table 4.1: The variable descriptive ............................................................................................... 35
Table 4.2: The summary statistics of variables ............................................................................. 36
Table 5.1: The Moran’s I coefficient of FDI ................................................................................ 47
Table 5.2: The Moran’s I coefficient of explanatory variables .................................................... 48
Table 5.3: The AIC value.............................................................................................................. 50
Table 5.4: The Marginal effect of Spatial Durbin Model ............................................................. 52
viii
CHAPTER 1: INTRODUCTION
1.1 Problem statement
Foreign Direct Investment (FDI) plays a major role in the countries’s growth, especially in
developing countries, thank to its benefits, including technological transferring, management skill,
job creations, and other positive externalities. Moreover, the FDI is considered as one of the
essential elements for economic development (Cave, 1996; Nwaogu, 2012).
Aware of these positive effects, nations have implemented several manners to promote the FDI
inflow such as issuing supportive law and policies, opening their market, enhancing the human
capital or improving the infrastructure capability. Particular to Vietnam, since the “Doi Moi” in
1986, the economy system was reconstructed from planned economy into the market economy.
The foreign sector is accepted as a component of the economy. Vietnam started its new policies to
attract the FDI inflow and become an attractive destination for investment from abroad.
Due to the growth of FDI activities, researchers has paid considerable attention into finding the
FDI determinants in recent years. Blanc-Brude et al. (2014) have reviewed hundred previous
studies on FDI determinants with varying scales: countries within a region or sub-national in a
country. For sub-national level, there are some remarkable studies such as Cheng and Kwan
(2000), Sun, Tong and Yu (2002), Kang and Lee (2007) for China, Crozet et al. (2005) for France,
Guimarães, Figguieredo and Woodward (2000) for Portugal. Regarding to Vietnam, the examining
on FDI’s determinants at the provincial level are relatively inadequate. There is only few papers
in this field, like Pham (2002), Meyer and Nguyen (2005), Anwar and Nguyen (2010).
Nonetheless, the similarities of above studies is that they have assumed each region is isolated and
have no impact on the others. With this assumption, the amount of FDI inflow to each region are
functioned by its characteristic only and therefore, these researchers just explored the disparity of
FDI in term of locational determinants. However, according to the Tobler’s law (1970):
“Everything is related to everything else, but near things are more related than distant things”.
To illustrate for the Tolber’s Law, Neumayer and Plumper (2010) gave an example of a person in
attempt to avoid the traffic jam to arrive the destination as quick as possible. One conclusion might
be obtained from this example is that the time travel for this person to reach the destination would
be a function of the vehicle used, the velocity, the road route utilized. Also, the amount of time
1
depends on the time of others to arrive their destination. Besides, his travelling time also depends
on the other’s options such as their vehicle, their velocity, and their road route.
The Tolber’s law is also applied in examining the FDI determinants. For instance, if Ha Noi attracts
more FDI would possibly boost or deteriorate the FDI inflow of its nearby neighbors, or if Ha Noi
holds a good infrastructure or a high level of human capital, then it would not only assist to attract
more FDI inflow itself but also possibly make positive externalities on nearby provinces such as
Ninh Binh or Hai Duong. More comprehensive, this implies that the level of FDI inflow in one
province not only depends on its determinants but also influenced by the FDI inflow of other
nearby provinces as well as their determinants. Alternatively, the geographical proximity between
provinces in Vietnam also contributes a particular effect on the level of FDI inflow and the closer
proximity-the stronger effect. The impact caused by the proximity between regions is known as
spatial effect.
Therefore, due to the existence of spatial effect, the reliability of previous studies on FDI
determinants with assumption that regions are distinct, is in doubt. According to Anselin (1988),
the omission of spatial effect lead to biased, inconsistent or inefficient parameter estimates. As a
result, these spatial effects should be controlled to yield a more accurate estimation. Nevertheless,
previous works on FDI determinants of Vietnam provided a useful suggestion for selecting
potential determinants. Currently, there are only two empirical studies of Hoang and Goujon
(2014), Esiyok and Ugur (2015), which embraced the spatial effect. By applying two different
models, they stated that the FDI inflow to provinces in Vietnam has impact on one another with
different signs. However, the restraint of using two basic spatial models does not allow them to
distinguish the real impact of characteristics from nearby provinces on the host province.
Thereby, this study is expected to partially fulfill the drawbacks in previous studies by accounting
for the spatial interaction between provinces in investigating the FDI determinants, which might
offer more precise results. Especially, by applying recent spatial econometric techniques, this study
aims to reveal not only the spatial dependence of FDI in Vietnam but also the effect of alternative
provinces determinants on the FDI flow into one province.
2
1.2. Research objective
As discussed above, the FDI inflow to each province does not simply rely on its determinants but
also be mutually affected by the FDI inflow to other provinces and their determinants through the
spatial interaction. Followed by that, this study is designed to analyze the FDI determinants at
provincial level and examine the spatial interaction between provinces in attracting FDI.
1.3. Research questions
In order to reach the research goal, this study focuses on answering two main research questions:
(1) Does the spatial dependence of FDI inflow between provinces in Vietnam exist?
(2) Which determinants would affect the FDI inflow at the provincial level?
1.4 Scope of the study
This study adopts the panel data at the provincial level for all 63 provinces in Vietnam from 2010
to 2014. The amount of registered FDI in US dollars as the dependent variable is collected from
Vietnam Statistical Year Book by the General Statistical Official of Vietnam (GSO) and the
Provinces Statistical Yearbook from 2011 to 2014.
The Gross Domestic Product (GDP) proxy for the market size, the sum of export and import over
the GDP proxy for the degree of openness and the proportion of employment in foreign firms over
the total employment proxy for the agglomeration. These data are collected from the Provinces
Statistical Yearbook from 2010 to 2013. Additionally, the rate of trained labor force over 15 years
of age is employed to proxy for the labor quality and the monthly average income of wage workers
over 15 years of age proxy for the labor cost. The data of labor quality and labor cost are gathered
from Report on Labor Force Survey from 2010 to 2013. In order to account for the infrastructure,
the dummy variable of national marine port is employed. The data of national marine port in
Vietnam are retrieved from the Vietnam Government Website. Finally, the Provincial
Competitiveness Index (PCI) is used to proxy for the institution variable. The PCI data is collected
from VCCI reports from 2010 to 2013.
Firstly, this study applies the Moran’s I to detect the spatial autocorrelation in the data pattern of
the dependent variable and explanatory variables. If the spatial autocorrelation exists, then the
using spatial econometric models are necessary. Through the General to Specific approach, the 3
spatial models include the Spatial Durbin Model (SDM), Spatial Autoregressive Model (SAR) and
3
the Spatial Error Model (SEM) will be estimated with the binary contiguity weight matrix. Besides
the binary contiguity weight matrix, other spatial weight matrixes include the inverse distance
weight matrix, cut-off km weight matrix and the k-nearest weight matrix will also be estimated to
give the AIC value which is used as criteria for choosing the most efficient weight matrix. By
using the Wald Test, the SDM should be pointed out as the best model describes the data over
SAR and SEM. In addition, a non-spatial model will also be estimated to give the information for
comparing the results between non-spatial model and spatial model. Last, the Hausman test will
be employed to find out if the time-fixed effect is more favorable than the random effect.
1.5. Thesis structure
This study is organized as following: Chapter 1 presents the necessity of using spatial techniques
in investigating the FDI determinants as problems statement. Chapter 2 includes the stages of FDI,
locational distribution of FDI, sector of FDI and country of origin. Chapter 3 introduces some
theories of FDI that relate to the location choice of Multinational Enterprises (MNE), an
extraordinary concept of agglomeration and its effect on FDI. This chapter also explains how FDI
interdependence in the aspect of agglomeration effect and MNE motivations. Moreover, the
empirical study part will review some outstanding studies that examined spatial patterns of FDI
from the world. Last, empirical studies on the FDI determinants of Vietnam with and without
spatial interaction will be also discussed.
The data part introduces the measurement of dependent and explanatory variable as well as their
sources. In addition, the methodology introduces the three main spatial econometric models
includes SAR, SEM and SDM, their properties, disadvantages/advantages of each model and their
relationship. In addition, this part also demonstrates the technical to obtain the marginal effect in
SDM. Besides, this part also provides readers the detail of Moran’s I test which could carry out
the spatial autocorrelation of dependent variable as well as explanatory variables. As a key
component of spatial econometrics, this part will also introduce the construction of a spatial weight
matrix which stands for the spatial linkage between provinces. In this part, four spatial weight
matrix include the binary contiguity weight matrix, inverse distance weight matrix, binary
contiguity weight matrix with the cut-off km criteria and the k-nearest spatial weight matrix will
also be presented. Chapter 5 is the result which embraces the Moran’s I result and estimation
4
spatial regression result of SDM include direct effect, indirect effect and total effect. The last part
of this study is the conclusion, policy implication and limitation.
5
CHAPTER 2: OVERVIEW OF FDI IN VIETNAM
It had been nearly 30 years since the economy reform from planned economy into the market
economy in 1986, the Vietnam’s economy has integrated intensity with the rest of world. The
Vietnam has become one among the most rapid economies growth around the world. Undoubtedly,
the FDI is an essential factor to the impressive growth of Vietnam. As reported by Nguyen and
Nguyen (2007), the FDI capital contributes a critical role in the development of economy growth
as well as the progress of poverty reduction and improve the standard of living. The following part
will introduce details of FDI in Vietnam in term of stages of FDI process, provincial distribution
of FDI, country of origin of foreign investment and sectors of foreign investment.
2.1 Stages of foreign direct investment in Vietnam
Parallel with the opening market and economy reforming, Vietnam had established the legal
framework by legislating the first investment law (FIL) in 1987. This is considered the earliest
effort of Vietnam government in calling the foreign capital inflow. With the advantage of emerging
market, Vietnam has become a new attractive destination for the foreign capital from around the
world. In general, the trend of FDI inflow Vietnam could be separated into five stages from 1988
to 2014 as figure 2.1. This part will introduce the details of the five stages and some changing that
take significant impact on the FDI in Vietnam.
The initial stage is from 1988 to 1990 with the legislation of the foreign investment law in 1987.
During this period, the overall amount of registered FDI capital into Vietnam had reached 1.8
million dollars. However, the FDI inflow in this time remains quite low which is caused by several
constraints such as the high inflation rate, the infrastructure’s abilities in adapting to the
requirement of foreign investors. Moreover, according to Thuy Le (2007), foreign investors were
still so anxious and doubted on the Vietnam government commitment on economy reforming to
guarantee their benefit.
The second stage is from 1991 to 1997. This stage is marked by the amending of FIL in 1992,
1996 and the ceasing of U.S embargo policy in 1995. The amending of FIL in 1992 had adjusted
two basic regulations include the Build-Operate-Transfer, which is considered a form of FDI and
the duration of FDI projects could be extended up to 70 years. Especially, the amending of FIL in
1996 which permits the provincial authorities to issue investment licenses with certain
6
requirements on their own. As a result, the registered FDI inflow Vietnam for this period had
accrued rapidly and reached 9.63 billion dollars in 1996.
Registered FDI and implement FDI (million
USD) and Number of FDI projects
Registered FDI
Implement FDI
Number of projects
2014
2013
2012
2011
2010
2009
2008
2007
2006
2005
2004
2003
2002
2001
2000
1999
1998
1997
1996
1995
1994
1993
1992
1991
2000
1800
1600
1400
1200
1000
800
600
400
200
0
1988-1990
80000
70000
60000
50000
40000
30000
20000
10000
0
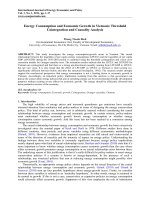
Figure 2.1: Registered, implement FDI (million USD) and Number of FDI projects.
Source: GSO
The next stage is from 1997 to 2000 that marked by the Asian financial crisis. During this period,
the amount of FDI inflow dropped sharply to the level even lower than 1993. The amount of
registered FDI in 1997 with 5.95 billion dollars declined to 2.82 billion dollars in 1999 and 2.76
billion dollars in 2000. According to Nguyen and Nguyen (2007), even though the Vietnam
economy had not suffered too many the negative impact from the crisis, but almost the foreign
investors originate from the countries that had to face the crisis. As a result, foreign investors are
forced to abandon or slowdown FDI projects in Vietnam. This leads to the declining of FDI inflow
for this period.
The fourth stage is from 2000 to 2008 and this stage could be separated into two small periods
from 2000 to 2006 and from 2006 to 2008. The amendment of Foreign Investment Law in 2000
has triggered a new expansion phase of the FDI in Vietnam. However, the amount of FDI inflow
in this period is not too noteworthy and remain relatively low. In 2006, Vietnam became a member
of WTO that required the equality treatment between foreign enterprises and domestic enterprises
as well as cut-off the tariff barriers. As an upshot, this had encouraged more foreign investors to
7
Vietnam. The registered FDI inflow in this period increased dramatically and peaked in 2008 with
more than 70 million US dollars.
The last stage is considered as a downward trend of FDI, which caused the global financial crisis
in 2008. The FDI inflow in 2009 had dropped sharply and reached 23.1 billion dollars 2009, which
is just about 32% of the total FDI inflow in 2008. The FDI inflow for this period has fallen and
reached the bottom at 15.6 million US dollars in 2011. Recently, for 2012 and 2013, the amount
of FDI inflow just be recovered but not too remarkable.
It is worth noting that there is co-movement between the amount of FDI registered and the number
of FDI projects as figure 2.1, especially in the period from 2007 to 2014. Meanwhile, the amount
of registered FDI declined, but the number of FDI projects tends to increase during this period. In
2008, the average scale of FDI was about 61.2 million US dollars per project when compared with
19.12 million US dollars per project in 2009 and 11.89 in 2014. Despite the growth of FDI projects,
as in the report on 25 years in FDI attraction of MPI, almost FDI projects are small and medium
scale.
2.2 Distribution of foreign direct investment among provinces
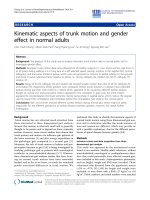
The distribution of FDI inflow in Vietnam through years is displayed as figure 2.2. The map of
FDI distribution is drawn from the data of registered FDI from 1988 to 2014. All 63 provinces
have received the FDI capital, but it is effortless to recognize that there is an uneven distribution
of FDI across these provinces. The more dark area implies the higher FDI inflow province and
vice versa, the lighter area implies the lower FDI inflow province. The FDI mainly concentrates
in the Red River Delta and the South-East Vietnam. On the other hand, the North-West, Central
highland and Mekong Delta exhibit a lower of FDI inflow. Alternatively, the FDI inflow is
clustered across provinces in Vietnam. More specifically, provinces with high FDI inflow tends to
be closed in distance with each other and vice versa. For example, in the South East Vietnam, Ho
Chi Minh City with the highest FDI is surrounded by provinces with high FDI such as Dong Nai,
Binh Duong and Ba Ria- Vung Tau. In the Red River Delta, figure 2.2 also exhibits that Ha Noi
with high FDI inflow is also surrounded by its neighbor provinces such as Thai Nguyen and Bac
Ninh. In contrast to the South East and Red River Delta, provinces in the Mekong Delta or
provinces in North-West exhibit a low FDI with each other. In addition, the FDI inflow is clustered
in provinces belong to the KEZ.
8
Figure 2.2: The distribution of FDI in Vietnam from 1988 to 20141
Source: Author’s calculation.
As seen in table 2.1, the FDI inflow tends to concentrate in provinces belong to the Southern KEZ2
and the Northern KEZ. These provinces are characterized by their proximity geographical and the
similarity in the development of economy than the other. 24 provinces in Key Economic Zone
received nearly three- quarters of total FDI inflow in Vietnam with 73.5%. The Northern Key
Economic Zone takes account of 28.2% and Southern Economic Zone takes account of 35.55%
the total FDI, respectively. Meanwhile, the Mekong Delta KEZ and the Central KEZ just capture
a small proportion of FDI inflow as 1.7% and 8.7%, respectively. The rest 39 provinces of Vietnam
just take a share of 26.5% total FDI. This could be caused by the advantage of being one of the
KEZ where provinces benefit from the effort of Vietnam government in developing the
1
The FDI distribution across Vietnam is drawn by Geoda Software
Vietnam is decided into 4 Key Economic Zone with 24 provinces include Northern, Central,
Southern and Mekong Delta.
2
9
infrastructure capabilities, enhancing the level of education, training, science researching and
modern technology transformation.
Key Economic Zone
Share of FDI
Northern Key Economic Zone
28.2%
Central Key Economic Zone
8.1%
Southern Key Economic Zone
35.5%
Mekong Delta Key Economic Zone
1.7%
Others
26.2%
Total
100%
Table 2.1 Sharing of FDI in Vietnam from 1988 to 2014
Source: Author Calculation
2.3 Country of origin
In terms country of origin, according to the Ministry of Planning and Investment report, until 2014,
101 nations and territories have made investment in Vietnam. Table 2.2 presents the top ten
investors in Vietnam with the cumulative amount of FDI inflow from 1988 to 2014, this group
accounts for 81.7% total amount of FDI inflow. Except for British Virgin Island and US, the rest
8 countries are all originated from Asia countries with more than 70% total FDI inflow. South
Korea is the biggest source with 4190 projects and account for 14.92% total FDI. Japan and
Singapore also contributed a high share of FDI in Vietnam with 14.77% and 13.03%, respectively.
In South East Asia area, Singapore, Malaysia and Thailand also dominated approximately 20%
total the FDI inflow Vietnam. The US as the latecomer also contributed 4.34% of total FDI with
725 projects.
10
Country
Number of FDI
The FDI registered
Share of FDI in
projects
(Million USD)
Vietnam
(Projects)
(Percent)
South Korea
4190
37726.3
14.92
Japan
2531
37334.5
14.77
Singapore
1367
32936.9
13.03
Taiwan
2387
28468.5
11.26
British Virgin
551
17990
7.11
Hong Kong
883
15603
6.17
United States
725
10990.2
4.34
Malaysia
489
10804.7
4.27
China
1102
7983.9
3.15
Thailand
379
6749.2
2.67
Total
14604
206587.2
81.7
All country
17768
252716
100
Island
Table 2.2 Top ten countries of origin of FDI in Vietnam
Source: GSO
2.4 Sectors of foreign direct investment
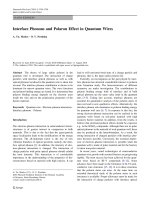
In terms of sectors of investment, the FDI inflow is relatively diversified with various sectors. As
seen in figure 2.3, the foreign investors tend to be favored in the manufacturing sector and real
estate when each of them accounts for 55.9% and 19.1%, respectively. The construction sector and
11
the accommodation and food service take a small share of FDI capital with 4.51% and 4.42%,
respectively. All other sectors such as mining and quarrying, energy, retail, education,
communication, et cetera are summed up and they take only 16.02% of total FDI. Detail of sectors
of foreign investment is provided in appendices part.
THE SECTOR DISTRIBUTION OF FDI IN VIETNAM
Others
16%
Accomodation
and food service
5%
Construction
4%
Manufacturing
56%
Real Estate
19%
Figure 2.3 The sector distribution of FDI
Source: Author calculation
According to the report on 25 years in FDI attraction of Ministry of Planning and Investment, FDI
has played a crucial role in Vietnam’s economy. Vietnam has achieved numerous benefit in the
aspect of socioeconomic such as economy growth, economy structure transformation, job creation,
technological transfer, enhance the competitive ability for at all the national, enterprise and
production level and contribute its effect to the progress in world economy integration. Nguyen
and Nguyen (2007) proposed seven reasons for explaining the successes for FDI attracting in
Vietnam include: the strategy location of Vietnam, the stable political system and economy,
12
abundant natural resources, young and quality labor force, large market size, a potential platform
for exporting to EU and USA and its commitment to economic reform.
However, besides the benefit caused by FDI, there still are many restraints such as high portion
FDI enterprises are operated with the medium-low technological, low living standard of workers,
pollution, energy resource wasted, et cetera.
13
CHAPTER 3: LITERATURE REVIEW
The following part introduces some theories associated with the location choices of FDI with the
paradigm OLI as the main theory. In addition, the linkage between the agglomeration economies
and FDI also be presented. Besides, this part also explains the spatial interdependence of FDI
inflow between regions by the agglomeration effect and MNE motivation. Further, this chapter
also provides some empirical studies on FDI determinants with and without spatial dimension.
3.1 Theories about location choices of foreign direct investment
Before making investment decisions in given country/regions, MNE have to agitate several
considerations such as why they should invest, how should they be organized or managed or where
should they invest. Parallel with the development of FDI around the world, several theories have
been developed to explain its activities. Some common theories are typically used as the Market
Perfection, Market Imperfection theory, Internalization theory, Transaction Cost theory, Product
Life Cycle theory, Macro Economic theory, Internationalization theory, the Eclectic Paradigm
OLI. And as a consequence, this also leads to problematic to search for only one theory, which can
explain for all issues related to the FDI. However, regarding to location choices of FDI, some
theories could be listed as the Production Life Cycle theory (Veron, 1966), the Macroeconomic
theory of FDI (Kyoshi Kojima, 1973) and the Paradigm OLI (Dunning, 1979, 1981). Among
theories above, the eclectic OLI paradigm (Dunning, 1979, 1981) is the most typical theory that is
employed to explain the FDI location choice.
3.1.1 The eclectic paradigm OLI
The eclectic OLI paradigm (Dunning, 1981) combines three components include the OOwnership, the L-Location and the I-Internalization. The three components of the Paradigm OLI
will be presented as below:
The O- Owner advantage
When foreign firms determine to invest abroad, they have to face with many disadvantages once
compare to local firms. By operating abroad, firms would have borne an oversea cost. This means
that foreign firms would have to possess specific advantages that make them more competitive.
These advantages could be the trademark, superior production techniques, management skills,
14
production skills, marketing system or the advantage of scale. And these advantages would be
strong enough to compensate the cost and gain a higher return.
The I- Internalization
By owning its advantage, foreign firms may have several choices for production abroad include
the collaboration with other firms in the host countries. They might sell the license or joint venture
with others local firms. However, foreign firms would have an incentive to believe that, advantages
by production and operation internally might earn more benefit rather than the collaboration with
others.
The L- Location
In the scope of this study, assume that the component “I” and the “O” are given, the component
“L” in OLI should be the most appropriate theory for explaining the investing based on the location
advantages. The L-Location advantages include many factors such as:
The abundant material resource
The market size
The cost factors
The labor-capital
The business environment
The physical infrastructure
The political system
The social/cultural
Apparently, as mentioned above, the location choice of FDI firms could be explained by the
Production Cycle Theory and the Macro Economic Theory. However, the using of these theories
shows some shortcoming when comparing with the L-Location in the paradigm OLI.
Firstly, in the Life Cycle Theory of Veron (1986), the investment of firms only occurs at the last
stage of production, and the incentive of moving out is caused by the cost factors only. Second, in
the Macro Economic theory of Kyoshi Kojima (1973), the motivation of investing abroad comes
from the cost advantage and the abundant resource. In comparison with the Production Cycle
Theory and the Macro Economic theory, the “L” factor in OLI theory can explain the incentive of
FDI inflow better and more sufficient
15