The nexus among corruption, public expenditure and economic growth evidence from provinces of vietnam
Bạn đang xem bản rút gọn của tài liệu. Xem và tải ngay bản đầy đủ của tài liệu tại đây (992.56 KB, 60 trang )
UNIVERSISTY OF ECONOMICS
HO CHI MINH CITY
VIET NAM
INSTITUTE OF SOCIAL STUDIES
THE HAGUE
THE NETHERLANDS
VIET NAM – NETHERLANDS
PROGRAMME FOR M.A IN DEVELOPMENT ECONOMICS
THE NEXUS AMONG CORRUPTION, PUBLIC
EXPENDITURE AND ECONOMIC GROWTH: EVIDENCE
FROM PROVINCES OF VIETNAM
By
NGUYEN THI MY PHUC
MASTER OF ARTS IN DEVELOPMENT ECONOMICS
HO CHI MINH, November 2015
UNIVERSISTY OF ECONOMICS
HO CHI MINH CITY
VIET NAM
INSTITUTE OF SOCIAL STUDIES
THE HAGUE
THE NETHERLANDS
VIET NAM – NETHERLANDS
PROGRAMME FOR M.A IN DEVELOPMENT ECONOMICS
THE NEXUS AMONG CORRUPTION, PUBLIC
EXPENDITURE AND ECONOMIC GROWTH: EVIDENCE
FROM PROVINCES OF VIETNAM
A thesis submitted in partial fulfillment of the requirements for the degree of
MASTER OF ARTS IN DEVELOPMENT ECONOMICS
By
NGUYEN THI MY PHUC
Academic Supervisor:
DR. NGUYEN HOANG BAO
HO CHI MINH, November 2015
ABSTRACT
This research investigated the impact of public expenditure in investment on the
economic growth under the presence of corruption. Three stage least squares method is
employed in order to indicate this effect in the panel data of 63 provinces/cities in Vietnam
from the period 2008-2013. The findings are: (1) The lower corruption is associated with the
lower in public expenditure in development investment; (2) The lower corruption has a
positive effect on economic growth; (3) Public spending in development investment has a
positive effect on economic growth and the presence of corruption do not reduce this effect;
(4) The lower corruption has a positive effect on private investment; (5) In term of the
openness, foreign investment can reduce corruption. Thereby, some implications have been
proposed to foster the growth of economy.
Keywords: corruption, public investment, public expenditure, Three stage least squares
method
i
ACKNOWLEDGEMENT
First of all, I would like to express my deep and sincere gratitude to Dr. Nguyen Hoang Bao,
my supervisor. His inspiration together with intellectual supports has encouraged me to
complete this thesis.
Special words of thanks also go to Dr. Truong Dang Thuy for his critical comment, patient
guidance and enthusiasm throughout the course of writing my thesis.
Finally, I would like to express my deepest gratefulness and thankfulness to my family, my
friends, my colleagues, for all the continuing support for me to complete this research work.
ii
TABLE OF CONTENTS
ABSTRACT ................................................................................................................................ I
ACKNOWLEDGEMENT....................................................................................................... II
TABLE OF CONTENTS ....................................................................................................... III
ABBREVIATIONS ...................................................................................................................V
LIST OF FIGURES ................................................................................................................ VI
LIST OF TABLES ................................................................................................................ VII
CHAPTER 1. INTRODUCTION ............................................................................................ 1
1.1 PROBLEM STATEMENT ............................................................................................................................ 1
1.2 RESEARCH OBJECTIVE ............................................................................................................................. 2
1.3 RESEARCH HYPOTHESES ......................................................................................................................... 2
1.4 THESIS STRUCTURE .................................................................................................................................. 3
CHAPTER 2. LITERATURE REVIEW ................................................................................ 4
2.1. THE KEYNESIAN THEORY ABOUT GOVERNMENT EXPENDITURE ..................................................................... 4
2.2. GOVERNMENT EXPENDITURE IN NEO-CLASSICAL THEORY ............................................................................. 5
2.3. ABOUT CORRUPTION IN PUBLIC EXPENDITURE IN INVESTMENT ...................................................................... 6
2.4. EMPIRICAL REVIEW ........................................................................................................................................ 7
2.4.1 Public spending in investment and economic growth ............................................................................ 7
2.4.2 Corruption and public spending in investment ....................................................................................... 8
2.4.3 Corruption and growth ........................................................................................................................... 9
2.4.4 Private investment in the relationship with growth, corruption and public investment .......................... 9
2.4.5 Foreign investment in the relationship with growth and corruption ..................................................... 11
2.5. CONCEPTUAL FRAMEWORK ......................................................................................................................... 12
CHAPTER 3. METHODOLOGY AND DATA ................................................................... 13
3.1. METHODOLOGY ...................................................................................................................................... 13
3.2. DATA SOURCES AND CHARACTERISTICS......................................................................................... 14
3.2.1 DATA SOURCES ................................................................................................................................ 14
3.2.2 MEASURE GDP FOR EACH PROVINCE ........................................................................................ 15
3.2.3 CHOICE OF CORRUPTION VARIABLE ......................................................................................... 16
3.2.4 ENDOGENOUS AND EXOGENOUS VARIABLES ........................................................................ 17
3.3. MODEL SPECIFICATION ........................................................................................................................ 18
3.4. ESTIMATION METHOD........................................................................................................................... 20
iii
CHAPTER 4. ANALYSIS RESULTS ................................................................................. 21
4.1. PRELIMINARY STATISTICS ................................................................................................................... 21
4.1.1 DESCRIPTIVE STATISTIC................................................................................................................ 21
4.1.2 CORRELATION OF COEFFICIENTS ............................................................................................... 25
4.2. THE IDENTIFICATION PROBLEM OF THE SIMULTANEOUS EQUATION...................................... 28
4.3. RESULTS ................................................................................................................................................... 29
CHAPTER 5. CONCLUSION AND SUGGESTION.......................................................... 38
5.1. CONCLUSION ........................................................................................................................................... 38
5.2. POLICY IMPLICATIONS.......................................................................................................................... 38
5.3.
SUGGESTIONS FOR FURTHER RESEARCHS ................................................................................. 39
5.4.
THE LIMITTED OF THESIS ................................................................................................................ 39
REFERENCE .......................................................................................................................... 41
APPENDICES ......................................................................................................................... 46
iv
ABBREVIATIONS
BRVT
Ba Ria Vung Tau
FDI
Foreign Direct Investment
FGLS
Feasible generalized least squares
GDP
Gross Domestic Product
GMM
Generalized Method of Moments
GSO
General Statistics Office
IMF
International Monetary Fund
OLS
Ordinary least squares
PCI
Provincial Competitiveness Index
TSLS
Three Stage Least Squares
USAID
United States Agency International Development
UTC
The Unmatched Count Technique
VCCI
Vietnam Chamber of Commerce and Industry
VND
Vietnam Dong
WB
World Bank
v
LIST OF FIGURES
Figure 2.1: Rahn Line (source: Tejvan Pettinger (2008)). .......................................................... 5
Figure 2.2: The relationship among corruption, public investment, private investment, foreign
investment and growth .............................................................................................................. 12
Figure 4.1: A combination of four scatter plots shows the correlation with GDP per capita
variable of: informal cost, non-State investment capital, public spending and foreign
investment capital (these variables excluding informal cost are in value log). ........................ 27
Figure 4.2: A combination of four scatter plots shows the correlation with public spending in
investment variable of: State investment capital, informal cost, foreign investment capital and
GDP per capita (these variables excluding informal cost are in value log). ............................. 28
vi
LIST OF TABLES
Table 4.1: Descriptive Statistic ................................................................................................. 22
Table 4.2: Correlation of coefficients ....................................................................................... 25
Table 4.3: Three stage least squares regression with impact of corruption on government
expenditure in investment and economic growth (when i.id variable is not considered) ......... 30
Table 4.4: Three stage least squares regression with impact of corruption on government
expenditure in investment and economic growth (when i.id variable has been used) .............. 31
Table 4.5: Three stage least squares regression with impact of corruption on government
expenditure in investment and economic growth ..................................................................... 33
Table 4.6: Three stage least squares regression with corruption affecting government
expenditure in investment, taking an interaction variable into consideration .......................... 34
Table A.1: The list of provinces ............................................................................................... 46
Table A.2: Data sources ............................................................................................................ 47
Table A.3: The development investment expenditure of Vietnam (2007-2013) ...................... 47
Table A.4: The data on the development investment capital of Vietnam (2007-2013)............ 48
Table A.5: The ranking of 63 provinces/cities in the PCI index in the period from 2008 to
2014 .......................................................................................................................................... 50
vii
CHAPTER 1. INTRODUCTION
1.1 PROBLEM STATEMENT
Public investment and its role in economic development have been affirmed by many
economists and policy makers. In developed or developing countries, public expenditure in
investment is considered as a foundation in long run economic growth (Tanzi and Zee, 1997).
According to Cashion (1995), Kocherlakota and Yi (1997), Fuente (1997) and Kneller et al.,
(1999) public investment has positive effects on economic growth, especially in the case of
developing countries (cite in Kneller R. and Haque M. E., 2008). However, a positive impact
of public investment depended on institution. It was found that a better institutional setting
may foster the positive effects of public investment (de la Croix and Delavallade, 2009; Dort
et al., 2014). While a poor institution, especially corruption, waste is popular (Tanzi and
Davoodi, 2002b).
Firstly, corruption impacts the public investment in both quantity and quality. There is
a wide spread of corruption on over the world, especially in developing countries in the recent
years. From its detrimental impact on economic growth, corruption distorts decision of higher
political, retards economic growth (Tanzi, 1998). Heath W. (2000) stated that: “corruption is a
cancer in society and is slowly eating away at the public sector”. It reduces the return in public
investment, lead to the economic development down following by Kneller R. and Haque M. E.
(2008). In conclusion, through the impact on the public investment, corruption retards the
economic development.
Vietnam is a developing country in Southeast Asia with over 90 million inhabitants.
By political and economic reforms (Doi Moi) launched in 1986, Vietnam’s GDP per capita
increase from around 100$ to over 2000$ by the end of 2014 within a quarter of a century. In
reducing poverty, Vietnam has a dramatic change in which the number of people dropped
from over 50% in the early 1990s to 3% today (World Bank, 2015).
With the development of two big cities is Ha Noi and Ho Chi Minh, Vietnam inherited
the contribution of 63 provinces in the process of its own economic development. The GDP of
Ha Noi and Ho Chi Minh account for 10.3% and 20% of the GDP of whole country
1
respectively (Provincial statistic yearbook, 2013). GDP per capita is the highest at Ba Ria
Vung Tau province (about 160 million VND in 2013) and Lai Chau province is the smallest (9
million VND in 2013). The rate in GDP per capita was also found different among 63
provinces/cities.
The share of public investment or public expenditure in investment in Vietnam
accounted for a high rate of government expenditure activities. In detail, in the period 20172013, average public investment expenditure of Vietnam accounted for 29% of budget (show
in Appendix 3). This average figure on the provincial scale is 25% (Bac Can province) and
22.5% (Cao Bang province) respectively in period 2008-2013 (source from Provincial
Statistical Yearbook, 2008-2013). However, the growth rate in GDP of Bac Can province and
Cao Bang province is quiet small, 5.24% and 4.78% in 2013 be compared with this rate of a
whole country is 5.42% in 2013. The question is whether corruption could be a cause make
differently in provincial economic growth through the impact of public investment?
In this research, we aim to investigate whether public expenditure in investment has a
negative effect on provincial economic growth when there is a presence of corruption’s effect
or not.
1.2 RESEARCH OBJECTIVE
This paper examines whether corruption has a negative effect on public investment and
economic growth, and through this investment decelerates economic growth. In other words,
the study test whether bureaucracy or “grand” corruption results in increasing the share of
public investment on GDP leading to lower economic growth rate. In order to get that, this
research find out more about corruption on its own expansion will affect public expenditure in
investment, and whereby has direct and indirect effect to economic growth.
1.3 RESEARCH HYPOTHESES
H1: The higher corruption is associated with the higher public expenditure in investment.
H2: The higher corruption has a negative effect on economic growth.
H3: Public investment has a positive effect on economic growth.
2
H4: The lower corruption has a positive effect on private investment.
H5: The foreign corruption has a negative effect on corruption.
1.4 THESIS STRUCTURE
The thesis remains in five chapters. Chapter 2 reviews literature about the relationship
among public investment, economic growth and corruption, also some other factors effect to
the development such as foreign investment and private investment. Chapter 3 discusses the
data characteristics and an estimation method employed in the study. Chapter 4 presents
empirical result on the scope of 63 provinces/cities in Viet Nam in period 2008-2013. Chapter
5 is the conclusion of this study, comment about the policy implication, also the limitation of
this study whereby suggest some further studies.
3
CHAPTER 2. LITERATURE REVIEW
This chapter presents the theory and empirical review about various links among public
expenditure, corruption, private investment, foreign investment and economic growth.
2.1. The Keynesian theory about government expenditure
Following Keynesian theory, fiscal policy can be used to intervene in the economy by
government through the impact of public expenditure. There is an increasing in government
expenditure will lead to a risen in economic growth in the condition of an expansionary fiscal
policy (cited in Odihiambo, 2015). Public expenditure stimulates consumer demand, arouses
business investment, support employment and contribute to rising income. That if government
expenditure is not occurred, the economic growth will go down, have no building
infrastructure, and protect civil rights.
The public expenditure investment in public good is usually lower in return, need a
long time to payback, but it is necessary for the social economic development. The public
spending in investment has been creating more productivity, a long term impact to the
economy. Beside, spending in budget is also instrument to boost private investment by its
support in the quality in infrastructure, the environment investment, etc.
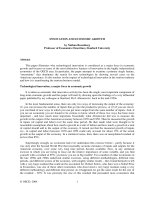
However, if there is an overspending in budget (exceeded the optimal thresholds), it
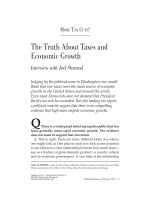
will prevent the economic growth. This is similar with Richard Rahn (1986) (cited in Anh P.T.
2008). That is there is an optimal level of government spending in economic growth
maximizing. The optimal level of government spending is between 15% and 25% of GDP. Its
efficiency is not only depending on what government spends but also the level of spending
Tejvan Pettinger (2008).
4
The economic growth
Government spending as a share of GDP
Optimal size of
government
Figure 2.1: Rahn Line (source: Tejvan Pettinger (2008)).
2.2. Government expenditure in Neo-classical theory
In 1980s, there is a dramatically risen in some model of neoclassical about the role of
public expenditure in economic growth. In this time, many empirical researches were born.
Typically, it is begun with the endogenous growth model of Barro (1990) on the research
about the role of public spending and tax on the economic growth process. To build this
model, Barro (1990) based on the maximum welfare behavior of all sectors in the economy
included government region, households, and in production of private firm. On the production
sector aspect, public service is considered as inputs in the production of final good. At the
beginning, the productive government has a positive impact to growth and saving rates, but
subsequently decline.
After that, an endogenous growth had been developed by Futagami, Morita, and
Shibata (1993) with private and public capital in dynamic analysis; Cashin (1995) with the
influence of public investment, public transfer and distortionary taxation on the rate of growth;
or Glomm and Ravikumar (1997) with the growth effect of productive government spending.
Kneller et al. (1999) find a strong support for Barro model (1990) that productive government
expenditure enhances the steady-state growth rate. Furthermore, the identifying of Ghosh and
Roy (2004) to analyze the impact of element of public spending in both public capital and
5
public services on economic growth. Government spends on both public service for short run
and public capital for long run. Pubic capital is such as roads, railways, airports and other
forms of infrastructure or the long time projects. Public service for short run is such as
spending on policing and the maintenance of road, and it has more immediate effect.
2.3. About corruption in public expenditure in investment
Corruption is “the single greatest obstacle to economic and social development” (cited
in Farooq et al, 2013). Tanzi (1998) discussed the relationship between corruption and
government expenditure in term of investment project, procurement spending, and extra
budgetary accounts. Firstly, there is appearance of “commission” which some higher officials
will be received when projects has been chosen. Because the existence of discretion of highlevel public official is truth, distorted decisions regarding on public investment can become
more popular. In fact, these decisions will effect to the efficiency in government’s project
investment activity in some aspect such as: the size, composition, the usage in resources.
In reality, public investment projects are very large but useless. The procedure of this
case was described as: when some enterprises will be chosen to undertaking the project, a
“commission” to the government officials is obligatory. The “commissions” are often
calculated as percentage of the total cost of the project. So, when helping the enterprises win
the bid or win a large project bureaucrat will receive a “commission” increasing together.
Consequently, some projects are much larger and complex than necessary. Moreover, a list
over-cost material was supported to increase the expenditure of project. From private benefit
of political agent, some resources such as human, land, technique were allocated inefficiently.
Consequence, some projects are completed but never used. Some are low quality and they
need more re-investment.
In summary, the presence of corruption in previous study will make the cost in
investment exaggerated, whereby that public expenditure in investment is higher than normal
is no exception; reducing the efficiency of public investment also.
6
2.4. Empirical review
2.4.1 Public spending in investment and economic growth
Being developed from Barro (1990), the endogenous model was continued to use by
Cashin (1995) and many theorists. On the level of public investment, Cashin (1995) found the
positive effect of public investment on the rate of economic growth with the test of data from
23 developed countries in period 1971-1988. Devarajan, Swaroop and Zou (1996) using data
from 43 developing countries from 1970 through 1990 year to focus a rise in the level of
current expenditure1 has positive and dramatically effect on growth, but the effect of public
expenditure in capital component was negative on per-capital growth. This result was the same
with Ghosh and Gregoriou (2007) Being analyzed in an endogenous growth framework for the
panel data of 15 developing countries over 28 years, using GMM techniques, current (capital)
government spending has positive (negative) and significant effect on the growth rate .
However, Bose (2007) cited that: “The share of government capital expenditure in GDP in
positive and significant correlated with growth but current expenditure is insignificant”.
On the other hand, about the component expenditure in public investment in the link
with growth rate of the economy was also discussed by many previous researchers. Easterly
and Rebelo (1993) found that “investment in transport and communication is consistently
correlated with growth”, but in the condition of budget constrain, Bose (2007) shows that:
“these do not survive”, also find the government expenditure and investment in education are
significant associate with growth.
To discuss that whether in the developing countries public investment is consider as an
engine of growth or not? A country with a big public capital invest in infrastructure have
positive effect on accelerating economic growth in low-income countries “if governments do
not behave in the past” (Warner, 2014). In fact the need of infrastructure and relate capital in
1
This defined was classified by International (Monetary Fund IMF) based on the type and purpose of
expenditure. Capital expenditure used for durable goods (more than one year). Current expenditure includes
wages, other goods or services, interest payments, and subsidies (see Devarajan, Swaroop and Zou (1996))
7
developing countries is great, so public investment was accounted for a large share of total
investment in the majority of developing countries (Khan, 1996).
2.4.2 Corruption and public spending in investment
Corruption has been defined by many different ways. The reason for that originated
from the various in its appearance and impact. Treisman (2000) cited corruption is self-interest
of public official in public sector. Lamsdorff (2001) in the condition of corruption, the
decision of higher official will be distort, the same with Ditella (1999), Tanzi (1998), Van
Ryckeghem and Weder (2001). This lead to misallocate resources such as human talent,
distribution public capital, the size and technology of project will be. Corruption may lead
bureaucrats using unproductive public expenditure, or offer them opportunities for rentseeking.
The government spending tends to items which are easy to levy. The level and
composition public investment activities will be over-estimated too. For example, in case of
Mauro (1998) government spending in education is found to be reduced. Lucrative
opportunities only come from markets difficult to monitor such as technology project or
immature markets for instance infrastructure projects. With Tanzi and Davooodi (2002b), they
find the higher corruption associated with the higher public investment by using two kinds
corruption index Business International (BI)2 and Political Risk Services, Inc. Developing a
theory game, Dartanto (2010) cites that by the rent-seeking behavior, the volume of public
investment tend to be larger. This study has built the corruption index on its own local
government in Indonesia.
2
Business international (BI) available for 68 countries over the 1980-1983 range from 1(most
corrupt) to 10 (least corrupt) indicate “the degree to which business transaction involve
corruption or questionable payments”, ICRG international country risk guide cover 1982-95
is available for 42-128 countries higher indicate “high government officials are likely to
demand special payment” and “illegal payments are generally expected throughout lower level
of government” range from 0(most corrupt) to 6 (least corrupt) detail in Kneefer and knack
(1993) (cited in Mauro (1995)).
8
2.4.3 Corruption and growth
One hand, corruption has a positive impact on growth. Getting bribery, officials will
work faster and more efficient (Leff, 1964; Hungtinton, 1968), or with Rock and Bonnett
(2004), when they investigate a positive effect of corruption in the new large East Asian
economies. Paul (2010) in the case of Bangladesh growth, there is a positive association
between corruption and growth. This research supposed corruption greases the wheels of
commercial Bangladesh’s regulation heavy system and unleashed private investments, but this
thing only happened when unconnected between in bureaucracy and major public utilities in
Bangladesh case. However, most of the earlier empirical studies before discovered that
corruption impedes economic growth. Mauro (1995) finds corruption has a negative effect to
private investment and make economic grow down, the same with Li, Xu and You (2000);
Ugur (2013) and Dridi (2013). In case of Pakistan, Farooq et al. (2013) use the time series data
over the period of 1987-2009 plus applied structural break unit test find that corruption has a
negative effect to economic growth in the long run.
Beside a substantial empirical work on the negative impact of corruption on economic
growth, there is some studies has been research inverse effect (Shabbir and Anwar, 2007; Saha
and Gounder, 2013). Taking to reverse side, Treisman (2000) states: “more developed
economies, and (probably) higher import were less corrupt”. Rauch and Evans (2000) finding
less corruption in a good condition of promoting the productivity of state officials. In the
decentralization of public expenditure, corruption will be reduced following by Fisman and
Gatti (2002). In the case of Vietnam, Bai et al. (2013) with an empirical analysis uses survey
data collected from over 13,000 Vietnamese firms between 2006 and 2010 shows that
economic growth is predicted to decrease corruption.
2.4.4 Private investment in the relationship with growth, corruption and public
investment
The question is: Does public investment has more impact on the growth than private
investment? The answer is not clear. Khan (1996) also finds the answer this question, with a
large sample of 95 developing countries over the period 1970-90, the finding is that there is a
9
distinction between them, and private investment has a stronger effect on the growth than
public investment does. This result is the same with Ghani and Din (2006) in the context of
Pakistan economy.
When corruption still exists, private investment was impacted in both quantity and
quality. Following O’toole and Tarp (2014) that bribery (one of the categories of corruption)
has negative and statistically effect on efficiency of domestic SMEs investment, and when
facing with the prospect of paying bribes, it is possible lead to reduce the level of private
investment.
Baliamoune-Lutz and Ndikumana, (2008) uses unbalanced panel data from 33 Africa
countries for the period 1982-2001 to explore the impact of public and private investment
under the control of corruption on growth. This research shows corruption has a positive effect
on public investment while it has a negative effect on private investment. On the view of
negative affect, corruption discourages private investment by increasing the costs of doing
business and instability in expected returns. Corruption acts as a tax on capital, but this tax is
uncertain. This thing delay investment activities. For example, one standard deviation decrease
in the corruption index raises private investment 2.5 percent points (Pellegrini and Gerlagh,
2004) (cited in Baliamoune-Lutz and Ndikumana, 2008).
Pall (2010) exclaims that corruption discourage private invest by raising indirect
production cost. In the condition of corruption, government tend public fund toward
unproductive activities, have large investment infrastructure in order to get more
embezzlement.
The crowding in effect of public investment on private invest has been considered
(Nguyen Hoang Bao, 2014). The high level of public investment might attract more private
investment. In fact, public investment creates conditions for profitable private investment such
as: reduce cost, enhances the infrastructure quality, support an attractive the investment
environment, build a high skill labor, etc.
10
2.4.5 Foreign investment in the relationship with growth and corruption
Openness to international trade and their role was mentioned in many fields such as: a
positive effect on growth through the result of learning by doing channel, specialization and
spillovers Lucas, (1988), the scale effect (Rivera-Batis & Romer, 1991). Another aspect
concerning about financial flow: foreign aid, especially foreign direct investment together with
knowledge and tech transfer (Moran et al., 2005) (cited in Nguyen Hoang Bao, 2014).
In term of economic growth, Wacziarg (2001) investigate the link between trade policy
and economic growth in a panel of 57 countries from 1970 to 1989. This study suggests a
positive impact of the openness on economic growth. In Viet Nam case, the openness also
states its role in the economic growth. For example, Su Dinh Thanh and Nguyen Minh Tien
(2014), estimate panel data of 43 out of 63 provinces/cities in Viet Nam in the period 19972012, they find that foreign direct investment has a positive impacts on the provincial
economic in the long term. Tam Bang Vu (2008) shows that FDI contribute to Gross domestic
product growth through enhancing on labor productivity by regressing GDP on the robust
OLS estimation (OLSR), Least square dummy variable (LSDVR) and FGLS method.
To approaching on the corruption aspect, Ades and Di Tella (1999) find that countries
get more competition from foreign firm, from abroad trade can reduce corruption. Larrain B.
and Tavares (2004) show the share of FDI relative with GDP is significant associated with
lower corruption. Shabbir an Anwar, (2007); Gounder Rukmani and Saha, shrabani (2013) the
openness or globalization can reduce corruption. The interactive relationship between
economic development and openness of India’s economy leads to a reduction in corruption.
11
2.5. Conceptual Framework
Private investment
Public spending in
investment
The provincial economic
growth
Corruption
Foreign investment
Figure 2.2: The relationship among corruption, public investment, private investment, foreign
investment and growth
12
CHAPTER 3. METHODOLOGY AND DATA
This chapter presents the methodology and data characteristics. The Cobb-Douglass
production function has been used to find the contribution of public spending in economic
growth. This part also mentions data source, some typically characteristic of variables, model
specification, and estimation method.
3.1. METHODOLOGY
A productive government expenditure and non-productive government expenditure are
being applied in the production function of final goods following (Barro, 1990; Futagami et
al., 1993; Cashin, 1995; Glomm and Ravikuma, 1997; Ghosh and Roy, 2004). Haque M. E.
and Kneller R., (2008) argued that non-productive expenditure has no effect on the investment
decision, and the growth rate unless be financed by some form of distortionary taxation. A
simple Cobb-Douglass version has been used and be extent with non-productive government
expenditure as exogenous input.
Where 0<⍺<1, L is labor; K is capital stock, Y is total output, and G is total
government spending. In the Cobb- Douglas production function, production technology is
constant with scale of labor and capital stock. Technology change is treated as exogenous. The
Cobb-Douglas production function assumes that elasticity of substitution is equal to one. With
assumption that L is constant, if there is an increasing in K and G, the production function will
have a fixed performance. That has an endogenous growth in the economy.
Accessing to the production function:
Where y= Y/L; k=K/L; A is represents a constant technology parameter; and Gγ is a
form of non-rival, non-excludable public good.
13
If β = (1- α) there is sustainable endogenous growth that is determined in part by public
investment; If β < (1- α) a version of the neoclassical model in which expenditure affect the
level but not the growth of output (assuming exogenous technical process).
The β term, that is the elasticity of output with respect to public investment. When the society
has corruption, the return to public investment is equal to:
β = γ (1-η)
Where η is increasing in the level of corruption; If η=0, then β=γ the absence of corruption; If
η=1, then β=0 at the highest level of corruption, the returns to investment are bound at zero.
Differentiating the production function with respect to time yields the following:
̇
̇
̇
̇
The change in output is followed by the change of K and G dependent on
and
.
When having more corruption, the effect of G on Y will reduce.
3.2. DATA SOURCES AND CHARACTERISTICS
3.2.1 DATA SOURCES
The panel data of 63 provinces in Vietnam for the period 2008-2013 was collected on
Provincial Statistical Yearbook, General Statistics Office (GSO) of Vietnam, the Provincial
Competitiveness Index (PCI)3, and the World Bank (WB). A full list of our data sources was
showed in Appendix 1.
The expenditure in Vietnam State’s budget is various in the composition. In the final
settlement of account they are: expenditure in development investment, current expenditure
3
The PCI index is based on the experiences of nearly 8.093 domestic enterprises (2013) about
a quality execution and business environment through at 63 provinces/cities of Vietnam and
the estimation of nearly 1.609 foreign firms. This survey was done by Chamber of Commerce
and Industry of Vietnam (VCCI), with support from United States Agency International
Development (USAID).
14
and the others. The development investment programs might reduce private cost in terms of
human resource, infrastructure and hence, create more productivity for economic development
process. Current expenditure together with the others tends to national defense and security,
state apparatus operation, state debts settlement. In this study, we approach the data of public
expenditure in investment to answer for research question.
The investment capital followed by the capital resource has been divided in three kinds
such as: State, non-state, and foreign sector. The state capital is expense to increase and
remain physical assets, in a given period. It was related with the big project of national
program. The data of foreign capital investment in this research indicates for the openness
level of each province. Whether province gets more attraction in foreign investment, there is a
growing in openness. In this study, we employ State investment capital is public investment
capital variable; non-State investment capital is private investment variable in model.
3.2.2 MEASURE GDP FOR EACH PROVINCE
Because of having the over-estimate in the GDP data of each province, we used a
method to get the consistence between the GDP of provinces data and the GDP of Vietnam.
Firstly, we calculated:
Where
GDP: Gross Domestic Product of Vietnam in year t, be get from GSO.
GDPit: the sum of Gross Domestic Product of 63 provinces in year t, get from the Provincial
statistic Office.
If I < 1: there is an over-estimation in the data of GDP of each province
Secondly, we have one formula in GDPi as follow:
15
Where
: The GDP of each province after re-calculating, and this figure will be used to
calculate the other index such as: GDP per capita, or public investment in a relative to GDP in
this research.
3.2.3 CHOICE OF CORRUPTION VARIABLE
Corruption has been defined in many different ways. Economists generally see
corruption as a part of the problem of rent seeking (Tanzi 1998, Shleifer and Vishny 1993,
Mauro 1995) (cite on Kwabena et al., 2001). Most of the corruption practices are illegal and
difficult to measure. Following Tanzi (1998), the act of corruption can be divided into
different categories. For example, bureaucracy or “petty”, cost-reducing or benefit enhancing,
briber-initiated or bribee-initiated, coercive or collusive, ect. Corruption can be a gift form or
bribes. It can be an illegal income in trade (good or services) when official choose the best
price-quality from the seller, and government budget be distorted, according to Ablo and
Reinikka (1998). It is important to distinguish or define corruption.
In this research, corruption has been seen in a special case, in any transactions involved
to public official. Corruption in public sector by the local contains two elements: the
exaggeration of the cost of public investment project and use of inferior materials (Haque
M.E. and Kneller R. 2008). That corruption inflates the public investment and reduces its
return in the economy. These lead to lower in the economic growth. Tanzi and Davoodi
(2002b) discussed about corruption as a “commission” in public project bidding. Thereby,
corruption distorts decisions of higher officials. Thus, how can this study choose the
corruption variable for the case of 63 provinces/cities in Vietnam?
Take advantage of the annual Vietnam Provincial Competitiveness Index (PCI) survey,
this research use the informal charge (“chi phi khong chinh thuc”) to measure corruption in 63
provinces. This data get from Chamber of Commerce and Industry of Vietnam (VCCI) in
period 2008-2013. This variable measures a type of bribery during business registration and
licensing. To do this, PCI survey employ the unmatched count technique (UTC). This
technique has been used widely by a list question to answer so-called sensitive question (Ahart
and Sackett 2004; Coutts and Jann 2011) (cited in Malesky E.J et al, 2015). It is measure on a
16