Impact of income inequality on health from middle and high income countries in 1991 2010
Bạn đang xem bản rút gọn của tài liệu. Xem và tải ngay bản đầy đủ của tài liệu tại đây (1.47 MB, 89 trang )
UNIVERSITY OF ECONOMICS
HO CHI MINH CITY
VIETNAM
ERASMUS UNVERSITY ROTTERDAM
INSTITUTE OF SOCIAL STUDIES
THE NETHERLANDS
VIETNAM – THE NETHERLANDS
PROGRAMME FOR M.A IN DEVELOPMENT ECONOMICS
IMPACT OF INCOME INEQUALITY ON
HEALTH IN MIDDLE AND HIGH INCOME
COUNTRIES IN 1991 - 2010
BY
PHAM DANG XUAN ANH
MASTER OF ARTS IN DEVELOPMENT ECONOMICS
HO CHI MINH CITY, November 2016
UNIVERSITY OF ECONOMICS
INSTITUTE OF SOCIAL STUDIES
HO CHI MINH CITY
VIETNAM
THE HAGUE
THE NETHERLANDS
VIETNAM - NETHERLANDS
PROGRAMME FOR M.A IN DEVELOPMENT ECONOMICS
IMPACT OF INCOME INEQUALITY ON
HEALTH IN MIDDLE AND HIGH INCOME
COUNTRIES IN 1991 - 2010
A thesis submitted in partial fulfilment of the requirements for the degree of
MASTER OF ARTS IN DEVELOPMENT ECONOMICS
By
PHAM DANG XUAN ANH
Academic Supervisor:
DR. NGUYEN VAN NGAI
HO CHI MINH CITY, November 2016
2
Declaration
I hereby declare that this thesis has been exclusively the original work of myself
and the result of my own research, except where due reference has been made in the
content, and free from plagiarism of the work of others.
I also certify that this master thesis has not been accepted in any degree or not
under submission for any other degree or qualification, other than that of the degree of
Master of Arts in Development Economics at Vietnam - Netherlands Programme.
3
Abstract: The income inequality and average heath of population level relation is
tested in this paper with panel data of 48 high and middle income countries over 20 recent
years. Evidence of significantly negative impact of income distribution on life expectancy
at birth and positive impact on infant mortality rate has been found. Moreover, GDP per
capita also has similar impact on heath in opposite directions. Even though the marginal
effects are quantitatively small, results are found to be quite robust when controlling for
endogeneity concerns and other issues.
JEL: I14, I15, O15, C33, C36
Key words: Income inequality, life expectancy, infant mortality rate, health,
human development, GDP per capita, secondary schooling, health spending, panel data.
4
Table of Contents
Page
Declaration.............................................................................................................. i
Abstract .................................................................................................................. ii
Tables of contents................................................................................................. iii
Abbreviations ....................................................................................................... iv
List of Figures .........................................................................................................v
List of Tables ........................................................................................................ vi
1. Chapter 1: Introduction ..................................................................................1
1.1. Problem Statement .....................................................................................1
1.2. Research Objectives ...................................................................................2
1.3. Research methods and expected outcome ..................................................3
1.4. Thesis Structure ..........................................................................................4
2. Chapter 2: Literature review ..........................................................................5
2.1. Theoretical Background .............................................................................5
2.1.1. Income and effects to health
2.1.2. Income inequality hypothesis
2.2. The conceptual framework .........................................................................8
2.3. Empirical Studies Findings ........................................................................9
3. Chapter 3: Data and Model Specifications ..................................................14
3.1. Empirical Model .......................................................................................14
3.2. Data sources and Description ...................................................................17
3.3. Estimation Method ...................................................................................28
3.3.1. Panel Data Model
3.3.2. Tests and Control for robustness of results
4. Chapter 4: Results and Discussion ...............................................................32
4.1. Descriptive Statistics ................................................................................32
4.2. Result Interpretation .................................................................................38
5. Chapter 5: Conclusions .................................................................................48
5.1. Concluding Remarks ................................................................................48
5.2. Policy implication.....................................................................................51
5.3. Limitations and further researches ...........................................................52
References .............................................................................................................54
Appendix ...............................................................................................................60
5
Abbreviations
OECD - Organisation for Economic Co-operation and Development
WHO – World Health Organisation
UNESCO - United Nations Educational, Scientific, and Cultural Organization
AGOA - African Growth and Opportunity Act
WIID – World Income Inequality Database
UNU-WIDER – United Nations University-World Institute for Development
Economics Research
CME – Child Mortality Estimates
LE – Life Expectancy
IMR – Infant Mortality Rate
IV – Instrumental Variable
GDP – Gross Domestic Product
GNI – Gross National Income
PPP - Purchasing Power Parities
FE – Fixed Effects
RE - Random Effects
GLS - Generalized Least Squared
FGLS - Estimator or Feasible Generalized Least Squared
OLS – Ordinary Least Squared
2SLS - Two-stage Least Squares
LM – Lagrange Multiplier
GMM - Generalized Method of Moments
6
List of Figures
Page
Figure 2.1: Life expectancy at birth and real GDP per capita in 48 countries, 19912010......................................................................................................................................6
Figure 2.2: Possible channels income inequality might affect health ............................8
Figure 3.3: Gini ratio estimation by Lorenz curve .......................................................19
Figure 4.4: Life expectancy and infant mortality rate versus GDP per capita ..........33
Figure 4.5: Life expectancy and infant mortality rate versus Gini index ...................34
Figure 4.6: Life expectancy and infant mortality rate versus Health spending per
capita .................................................................................................................................35
Figure 4.7: Life expectancy and infant mortality rate versus Secondary schooling
enrolment ratio .................................................................................................................36
7
List of Tables
Page
Table 3.1: Summary of data resources and denotation used in models ......................17
Table A.2: Summary of hypotheses testing of model effects selections ......................60
Table 4.3: Descriptive statistics for the explanatory variables, 48 countries 1991 –
2010....................................................................................................................................32
Table A.4: Model selection and Tests for life expectancy ...........................................60
Table A.5: Model selection and Tests for IMR .............................................................61
Table A.6: Correlations of variables in models .............................................................62
Table A.7: Regression of Gini with impact of IVs ........................................................63
Table 4.8: Comparison of OLS regressions and panel effect regressions - Life
Expectancy ........................................................................................................................39
Table 4.9: Comparison of OLS regressions and panel effect regressions – IMR ......39
Table 4.10: Effects of income inequality using fixed-effects and random-effects ......42
Table 4.11: Effects of income inequality using instrumental variables on life
expectancy .........................................................................................................................42
Table 4.12: Regressions on life expectancy with interactions of Gini and GDP per
head - Trade Openness instrument ...............................................................................44
Table 4.13: Regressions on life expectancy with interactions of Gini and GDP per
head – Investment Ratio instrument .............................................................................45
Table 4.14: Regressions on infant mortality rate with interactions of Gini and GDP
per head ............................................................................................................................46
Table A.15: Regressions with system GMM on life expectancy and infant mortality
rate ....................................................................................................................................64
Table A.16: List of countries in research according to World Bank ..........................64
Table A.17: List of STATA output of empirical results ...............................................65
8
Chapter 1: Introduction
1.1 Problem Statement
In the recent years, the researches on health and its surrounding relationships has
been on the rise. Explanatory factors affect health as the whole population is point of
interest of many authors. The outcomes of studies are among most controversies, not only
in the conclusions, but also in the discussions and criticism of limitations regarding the
methodologies, data, underlying channels of mechanisms.
Health, as definition, is “a state of complete physical, mental, and social well-being
and not merely the absence of disease or infirmity” as from the World Health
Organization (WHO). The concerns of health are one of the most significant matters in
modern societies. With the advances in technology and health care, all aspects of health
have been considerably improved in almost every country, especially in life expectancy
and infant mortality rate. Life expectancy and mortality rate don’t necessarily reflect the
quality of life in term of the income metrics, but in the most popular studies in this filed,
the connection between the these two major metrics of life quality, and other income
based measurements, has been investigated and hence, established (Lynch et al., 2004;
Ellison, 2002).
Health, at individual or population level has exposed some degrees of relationships
to inequality according to Rodger (1979), Preston (1975), and Deaton (2001). Besides
that, there is recently increase in studies regarding health and population health and its
nexus with income, and especially, inequality (Gravelle et al., 2002; Torre & Myrskylä,
2014). Even though the measurement of inequality is itself hardly intuitive (Lynch et al.,
2004), many economists tried to quantify it through numbers of metrics. Therefore, the
relationship between income inequality and the health are becoming important.
In other aspect, the association between economic growth in terms of income
distribution and quality of life metrics are ongoing topic in economic studies. The quality
of life can only be raised if growth and standard of living go together. Among
determinants of a highly developed society, health and education are key opponents.
Apart from education attainment, which is a proven factor interacting with wealth
distribution, health at aggregate level such as life expectancy and infant mortality rate has
9
exposed some degrees of connections to income inequality according to Rodger (1979),
Preston (1975), Deaton (2001).
Alternatively, there are empirical works of researches on the connection between
human capital and economic growth, in terms of income level. As results, there is
recently increase in studies regarding health and population health and its nexus with
income, and more extending, income inequality (Gravelle et al., 2002; Torre & Myrskylä,
2014).
Equally important, the mutual effect of health and income inequality is a source of
debate in many papers. In one hand, some papers have been indicated that the part of the
income inequality hypothesis. On the other side, the effects of health outcomes on income
conception and vice versa have been investigated for long time (Leigh et al., 2009).
However, the connections between three concepts: economic inequality, health progress
and their interactions with income driving mechanism are not easily established or
observe with solid evidences. The consistent results of researches of this interest are still
exceptionally unconvincing because of conflicting conclusions.
1.2 Research objectives
Due to the rising health concerns in welfare, especially when it comes to child
mortality reduction and prolong human longevity, many studies has been accelerating the
knowledge and connections of health policies in terms of income distribution instruments
such as Gini or Robin Hood Indexes. Exploring the pattern of Gini coefficient linking to
life expectancy and IMR, with control of some insightful factors such as level of income,
health spending, etc… are the main purposes of this income inequality on health indexes
study, and are largely to contribute to literatures.
The longevity and quality of life are essential to modern societies, but lacking of
understanding of how income inequality could impact health, lacking convinced
evidences, particularly combined with controversies in underlying patterns of pathways in
evidences in groups of countries, making perspectives become distorted. Therefore, the
proposed objectives of this research are to:
1. Estimate the effect of income inequality on life expectancy at birth and infant
mortality rate in some of middle and high income countries in period of 1991-2010.
10
2. Estimate the effect of GDP per head in conjunction of income inequality on health
with consideration of differentiating high, upper middle and lower middle income
countries.
Because the main objective of this research is to re-examine the effects of income
inequality on health outcome, with the attempt to reveal underlying mechanisms with
evidence from patterns of developed and lesser developed countries of divergent levels.
Hence, the research will try to answer some questions:
1) Better income differences (lower inequality) lead to better life expectancy and
reducing infant mortality rate at aggregation level?
Furthermore, income per capita (GDP per head) has been long time considered the
incentive for positive change in health perspectives; therefore, this study will also
examine the second research question on:
2) Whether higher income per capita increases health indicators at aggregation level
or in other hands, does income associate with differences in health in different income
levels?
1.3 Research methods and expected outcome
The main approach to this study is to use panel data of 48 countries of high and
middle income over the period of 20 years (1991-2010) to draw the results with the
attention to unobserved heterogeneity by using fixed and random effects as well as some
econometric methods to overcome the confounding and other issues in models. All the
results are to be examined in manner to ensure there are no biases affecting the
interpretations and concluding statements. Data is collected from various macro sources.
Outcomes of research is projected to supplement the recent literatures and expected
to fulfill the understandings of income inequality – health relation. Income inequality
should be one of most important meditations for population health; in this case life
expectancy at birth and infant mortality rate, along with income per head. In that hope,
any actions by governments that adjust income inequality or distribution and income level
have direct or indirect impacts on health of their own people.
11
1.4 Thesis Structure
This study is structured to feature the literature and framework of theory in
following next section. Subsequently, the econometric models will be presented with data
descriptions as well as estimation strategies. Finally, result of estimation and discussions
are to be shown on two last sections alongside conclusions.
12
Chapter 2: Literature Review
In this review, I first introduce the theory grounds of income inequality
hypothesis, as well as income level effects on health measurements. Subsequently, basis
for the models will be analyzed and established through relation of theory and empirical
results.
2.1 Theoretical Background
2.1.1 Income and effects to health
Preston (1975) was leading in investigate the impact of pattern of income to health
across countries. The striking result in his milestone paper revealed the relationship
between per capita national income and life expectancy at birth for different period of
times. This relationship is, however, was at diminishing return to income. Another
conclusion was that if the income inequality was to be reduced, the life expectancy could
be extended for specific country, ceteris paribus. Therefore, the negative relationship
between income inequality and health has been suggested.
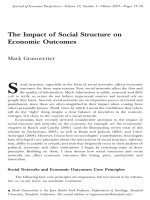
The Figure 2.1 below shows the milestone of Preston (1975) works and
remarkably illustrates the relationship of income per capita in form of real GDP per head
and life expectancy at birth by using data of full 48 countries over the period of 20 years.
Even though the noise is spotted around the data structure, the effect of diminishing rate
is well observed when real GDP per capita raises life expectancy specifically at the range
of 65-85 year old phase corresponding to about 5,000-45,000 U.S. dollars increase. This
also could be key prediction for policy recommendations as the concentrated effect is
visually demonstrated.
13
Figure 2.1: Life expectancy at birth and real GDP per capita in 48 countries, 1991-
75
70
65
60
55
Life expectancy at birth (years)
80
2010
0
20000
40000
60000
Real GDP per capita
80000
100000
Moreover, the link between incomes to health, with no account for inequality
direct effects, usually referred to as “absolute income hypothesis”, is reviewed by Deaton
(2001). This means that income directly affects health, no matter how the relative income
compared to others. On the contrast, “relative income hypothesis” draws the outcome of
health from the income inequality. More precisely, the relative income hypothesis evolves
to the income inequality hypothesis, which proposes the direct effect from inequality to
health. The sizeable researches on income inequality hypothesis have been done using
cross country data level (Childs, 2013).
The arguments of Preston (1975) have drawn the important conclusion and laid
foundations for large number of researches over time, extending to health measures and
income as well as income inequality relationship (Beckfield, 2004). Lots of studies
showed somewhat quantitative effects even though the debate how income inequality
affects population health continues. Nevertheless, these studies are mostly with caveats
and there are never absolute conclusions.
14
2.1.2 Income inequality hypothesis
While the connection between the income effects on health in principle has been
long time considered by Preston (1975), the statistical relation of income inequality to
population health has also recently reviewed intensively by Lynch et al. (2004) and many
others.
The association from income inequality to health has been modeled in at least
several papers for many income level countries and many regions (Wilkinson & Pickett,
2006). While the insights from these specific researches are very helpful in shaping the
picture of changes in income in relation to health (often measured by mortality and life
expectancy), the conclusions are not compelling enough to definitely confirm the robust
connection between income inequality and health indications.
There are as well considerable attempts to understand the mechanism that shapes
the complicated correlation and the causality of inequality, health with interaction of
income development. Among these efforts, some significant literatures can be found
trying to relate inequality to health (Leigh et al., 2009), or in (Gravelle et al., 2002), based
on the detailed works of Deaton (2001), Preston (1975), Wilkinson (2002), and Rodgers
(1979). In discussed papers, absolute income hypothesis, relative income hypothesis, and
income inequality hypothesis are mentioned as instrumental theory to explain the
dynamics of relations (Wagstaff & Van Doorslaer, 2000).
Furthermore, Ellison (2002), in critical thinking paper, has been skeptical the
possible “statistical artefact” between average population health and income inequality,
which was derived from the curvilinear association from the individual levels. He also
gave some explanations for this curvilinear effect and proposed this was underlying
mechanism for relative income hypothesis.
At the core of underlying mechanism of income inequality on health outcome,
social inequality is the most influencing aspect hypothesized by many. Initially, income
inequality is related to shrinking social cohesion or social capital and in turn increases
mortality (Kawachi et al., 1997), while social inequality is per se ground for measuring
the mean deviation of pairs of incomes in whole population in Gini, according to Sen
(1997). By exploring the pathways of psychological and physiological effects on health,
Wilkinson (2002) has been drawn the connections between the social cohesion and
15
mortality, indicated that the benefits of social network to health. The reason behinds are
the psychological effects on cognition which spread over the social classes leading to
poor health. Wilkinson (1992) reviewed empirically papers tested with cross section data
found relationship of the inequality in society characterized by Gini and health. In
conclusion, the social epidemiological transition is the most visible rationale for the
relative income hypothesis as Herzer and Nunnenkamp (2015) and Wilkinson (2002)
mentioned along with. On the other hands, the societal circumstances in the form of social
inequality (which leads to economical inequality) are the main dynamism driving the
characteristics spreading through pathways into health aspects.
2.2 The conceptual framework
As theories described above, the diagram of which mechanism could be briefly
demonstrated as following:
Figure 2.2: Possible channels income inequality might affect health
The social and economical determinants of relationship between health and
income inequality could be attributed by several features as in literatures of many
researchers. The first is income per capita. The income per capita as proxy of GDP per
head is central mediator for socio-economic situations that has been constantly connected
with the positive progress of health. Developing of real GDP per capita implies improving
living standard with the great impact on life expectancy and infant mortality rate through
many channels (Chen et al., 2014).
16
Secondly, Health spending per capita, which is aided by wealth of each individual
and has direct impact on health progress in society. Such effect is found in literatures
written by van Deurzen et al. (2014), in which pattern of spending on health implicitly
heads to hospitals in major cities in Low and Middle Income Countries.
More recently, van Baal et al. (2013) has carefully observed the health care
expenditure and the life expectancy leading to conclusion there is positively obvious
impact of health care spending on life expectancy, particularly in Western countries.
However, the marginal effect as well as underlying mechanism of causal relationship is
still in doubt.
Gross secondary school enrolment is gross ratio to population of age group
regardless the age that corresponds to level of secondary education level. It is the basic
input for economic growth given the human development. Secondary schooling
attainment appeared undoubtedly in vast number of literature in relation to economic
growth models and as basic determinants as average schooling in general is highly
correlated with life expectancy and economic output (Bloom et al., 2004). Feinstein et al.
(2006) has consolidated the substantial direct-effect of education on heath in lot of papers
with complex mechanism of channels that education’s impact. Logically, education needs
to be included to models for an explanatory performance of model specification (Groot &
van den Brink, 2006).
Details of conceptual framework with its determinants will be discussed in data
descriptions when model is to be constructed in next chapter.
2.3 Empirical Studies Findings
In comprehensive review whether income inequality is a major determinant of
income inequality relation to population health, specified by life expectancy and infant
mortality rate, with income level as mediator, relevancies of concepts have been
presented by some significant researches and studies. The firm establishment of
literatures is essential for building the connections of concepts.
Probably the most fundamental study for the theory and empirical proof regarding
relation of inequality and health has been conducted by Rodger (1979). Following Preston
(1975)’s findings, and using individual to aggregate health approach, he has described the
impact of income and its distribution on life expectancy as function at diminishing rate.
17
This function could be demonstrated for absolute income hypothesis. Given the non linear
of functional form, the mean of life expectancy needed to be correlated with income
distribution, and therefore modeled by Gini coefficient.
Initially, the precise form of income-life expectancy function has been defined by
various control variables joining the two concepts. On the empirical side, Rodger (1979)
has exhibited the excellent result in which lower equality leaded to higher mortality. This
statement held true throughout many specifications, and also for less developed countries,
with somewhat reduced significance level. Secondly, the infant mortality rate was
significantly affected by income inequality in rich countries. The overall importance of
this research has encouraged many evidence-based works with inspired theory.
In frequently cited article to connect income distribution and life expectancy at
birth for a lot of countries in OECD and Europe, Wilkinson (1992) found the relatively
strong evidence for relation between income changes over time with life expectancy using
cross section data. The result drawn from paper with important indication that the gross
national product per head was no longer a factor in which life expectancy relate to, at
least for developed countries. On the other hand, relative income rather than absolute one
is main cause explaining the mechanism of income distribution on life expectancy.
Nevertheless, with evidence from across country and within the United States of
American, Mellor and Milyo (2001) has criticized Wilkinson (1992) and demonstrated
more controversial result, when income inequality sometime raised health outcome, but
sometime in opposite way. This paper is highlighted with the longer time of analysis, the
account of education factor or taking difference to investigate the middle mechanism.
Moreover, the casual relationship between individual health and inequality was not
strongly robust. Finally, the income inequality hypothesis associated with some previous
works was skeptical.
Furthermore, Gravelle et al. (2002), in attempt to replicate the significant work of
Rodger (1979), has tested relative income hypothesis and relations between per capita
income, population health, and income inequality using new data, new approaches and
methodologies. In the end, they found no significant connection for mentioned concepts
for either developed or developing countries as cited in Deaton (2001)’s paper, which he
systematically reviewed many studies on links between inequality, development and
18
health. Questions have been raised for aggregate data and methodologies troubles. As a
result, relative income hypothesis has been challenged.
Conversely, as update for Wilkinson (1992), with the analytical study for 21
industrialized nations from 1975 to 2006, Torre and Myrskylä (2014) has strongly
confirmed the effects of income equality on health outcome, especially when differenced
by age. That implied the more equal income yielded the lower mortality at young age and
children. They also found that the gender had important impact to the result. Finally,
given the literature they reviewed, they casted the doubt on work of Gravelle et al. (2002).
In addition, some scholars has been taking substantial efforts to review many
studies and researches concerning the nexus of income inequality and heath, such as
Lynch et al. (2004), Leigh et al. (2009), Wilkinson & Pickett (2006) and Deaton (2001).
They all found the quite contradicted conclusions throughout the large numbers of studies
reviewed. However, the income inequality is indeed having the power to influent health,
at various degrees. Additionally, as recent data is increasingly better over years; with
sophisticated analysis methods, the channels of mechanisms of health and income
inequality has been explicitly revealed. Domination of evidences seems to be favor for the
slightly negative or mixed correlation and between inequality and health at large range of
significance.
However, against the hypothesis of income inequality is dangerous for health;
Beckfield (2004) has recently attempted to replicate the works trying to overcome the
limitations of cross-sectional studies by testing on over 100 countries with 692
observations. The findings repeatedly denied such relationship with fixed effects models
to capture unobserved heterogeneity, even with prosperous countries and 2 measure of
income inequality (Gini and share of income). Controlling for variables also rendered the
null hypothesis.
In general, the measure of income inequality indicators is also the debate of many
researches. In order to counterpart this arguments, Kawachi and Kennedy (1997) has used
cross section study, tested a range of six income inequality indicators including Gini, on
50 states of the U.S. to reconfirm the high association between the mortality and income
inequality, which has been demonstrated in many ecological researches.
19
Inspired by Mellor and Milyo (2001), Childs (2013) has checked the validity of
income inequality hypothesis, with panel data for U.S. to overcome the weak model
specifications. Although the data did not support the hypothesis with incorrect signs
detected, conclusion of possible association between income inequality and health was
drawn due to reasons of complicated channels of impact.
It should also be noted that the income inequality hypothesis is not always holding
for population level. Wagstaff and Van Doorslaer (2000) has been doubtful about the
robust of such aggregate level, and claimed that only absolute income hypothesis could be
held true on the U.S population data, not relative-income hypothesis or income-inequality
hypothesis.
International evidences for income inequality hypothesis are quite divided by the
mixed results by massive body of literature like Ellison (2002) and Lynch et al. (2004).
Developing and developed nations are of the interest in research in order to investigate
the difference of effects in two groups of countries caused by wealth. Torre and Myrskylä
(2014) and Macinko et al. (2004) have done the examinations on many developed and
industrial countries and realized the negative effects of income inequality on life
expectancy and infant mortality rate. In the case of Macinko et al. (2004), they found
mixed results when controlled for other economical indexes using Theil index proxied for
wage inequality.
In less relevant, there is also study which focused on another form of mortality
such as women’s experience of child mortality (van Deurzen et al., 2014). Findings were
consistent for other studies where higher inequality is associated with higher child
mortality experiences in individual’s data from 52 low and middle income countries. This
study also implied the wealth of poor should be improved to bridge the gap between rich
and poor.
Most recently, Herzer and Nunnenkamp (2015) chose to use panel co-integration
to enhance the robustness of research when interesting effect of income inequality on life
expectancy. The difference of finding between two groups of developed and developing
countries was significant. The income inequality surprisingly raised the life expectancy in
rich countries and the opposite result in poor ones. The results exposed to stable through
many sensitive checks but with little magnitudes.
20
The definite conclusion whether health can be affected by income inequality
consequently remained open. In addition, the notable robust results were dominated for
developed countries. The casual mechanism in adverse way was also reviewed with some
possible grounds. Finally, lacking of quality data and unknown instruments behind health
and income were reasons for incomplete evidences.
21
Chapter 3: Data and Model Specifications
3.1 Empirical Model
The model of income inequality – health relationships have been econometrically
set up based on works of Preston (1975), Rodgers (1979), and Mellor and Milyo (2001).
The macro-model could be specified simply as the effect of income distribution measure
and function of set of income and controlling factors: (Rodgers, 1979)
Y = α + βG + γX + ε
Where
Y is the health indicators
G is measure of income distribution
X is controlling factors including means of income
ε is error term
The major effects between the two health measurements and key indicator of
equality-Gini coefficient- are modeled in regression connections in regards of affecting
factors in accordance with literatures and framework of variables nexus. This study
considers six (6) specifications:
The base of empirical models (1), (2) includes the real GDP per capita as in the
fundamental concepts by Rogers (1979), and is consistent with the approaches by Torre
and Myrskylä (2014); Herzer and Nunnenkamp (2015), which is the most common factor
paired with Gini for socio-economic environmental measure. The subsequent ingredients
are reflected health care spending and education following the researches of Macinko et
al. (2004), and specially Mellor and Milyo (2001), who found controversial conclusions.
Those are health expenditure per capita and secondary schooling enrolment ratios which
are incorporated into 2 basic models for life expectancy and infant mortality rate.
The more refined of 2 models extended by using interaction terms to distinguish
the effect of Gini and GDP per capita under conditions of effect between higher and
lower middle income countries. These models are presented in (3), (4), (5), and (6).
22
(1) LifeExpit = α + 1Giniit + 2GDPpcit + 3Healthpcit + 4SchoolEnrollit + eit (IVs:
TradeOpen, InvestRatio)
(2) IMRit = α + 1Giniit + 2GDPpcit + 3Healthpcit + 4SchoolEnrollit + eit
(3) LifeExpit = α + 1Giniit +2 GDPpcit + 3Healthpcit + 4SchoolEnrollit + 5(Hii x
Giniit) + eit
(4) LifeExpit = α + 1Giniit + 2GDPpcit + 3Healthpcit + 4SchoolEnrollit + 5(Hii x
GDPpcit) + eit
(5) IMRit = α + 1Giniit + 2GDPpcit + 3Healthpcit + 4SchoolEnrollit + 5(Hii x Giniit)
+ eit
(6) IMRit = α + 1Giniit + 2GDPpcit + 3Healthpcit + 4SchoolEnrollit + 5(Hii x
GDPpcit) + eit
Where in models:
LifeExp is Life expectancy at birth (years)
IMR is Infant mortality rate (deaths of infants under one year old per 1000 live births)
Gini is ratio index expressed as percentage from 0, represents perfect equality, and 100,
perfect inequality. Details explained in data description.
GDPpc is per capita GDP in PPP adjusted at constant 2011 international dollars. For
particular case of Argentina, when data missing was encountered, constant U.S. dollar at
year 2010 is choice of replacement (World Bank, 2015).
Healthpc is per capita health care expenditure as total public and private health spending
as ratio of total population in weighted average in PPP adjusted at constant 2011
international dollars
SchoolEnroll is gross secondary schooling enrolment ratio to population of age group
(whatsoever the age) for both sexes (percentage point %)
TradeOpen is ratio of imports and exports to GDP (percentage point %)
23
InvestRatio is gross capital formation (gross domestic investment as ratio to GDP) which
consists of fixed asset and net changes in level of inventories (percentage point %)
Hi is dummy variable. Value of 1 is countries high or upper middle income. 0 is lower
middle
In these models, TradeOpen and InvestRatio are proposed instrumental variables and
could be used or removed from models should the correlations are not importantly
verified.
24
3.2 Data sources and Description
Table 3.1 summarizes the list of variables used in study as well as their expected
signs, unit, denotation, sources of data retrieved. Consequently, details of each variable,
how they collected and explanations on which pathways they affect dependent variables
or included in models are presented following.
Table 3.1: Summary of data resources and denotation used in models
Dependent Variables, Denoted
Expected Signs
Regressors
Life
and
Instrumental Variables
Infant
expectancy mortality
(IV)
Life
Sources of variables
rate
Expectancy
at LifeExp
N/A
N/A
Beckfield (2004)
IMR
N/A
N/A
Beckfield (2004)
Gini
-
+
Herzer and
birth
Infant Mortality Rate
(per 1000 births)
Gini ratio (%)
Nunnenkamp (2015)
GDP per head
GDPpc
+
-
Torre and Myrskylä
(2014)
Health
Expenditure Healthpc
+
-
per head
Secondary Schooling SchoolEnroll
(2004)
+
-
Enrollment
Investment share per InvestRatio
(IV)
Mellor and Milyo
(2001)
N/A
N/A
GDP (%) (IV)
Trade Openness (%) TradeOpen
Macinko et al.
Pritchett and
Summers (1996)
N/A
N/A
Augmented from
Pritchett and
Summers (1996)
The data set in study is collected from World Bank, Child Mortality Estimates, and
World Income Inequality Database from United Nations University – World Institute for
Development Economics Research sources.
25