Slide strategic financial management l03
Bạn đang xem bản rút gọn của tài liệu. Xem và tải ngay bản đầy đủ của tài liệu tại đây (4 MB, 26 trang )
Strategic
Strategic Financial
Financial Management
Management
Hurdle Rate: The Basics of Risk
Khuram Raza
First Principle and Big Picture
The Basics of Risk
Defining the Risk
Equity Risk and Expected Returns
Measuring Risk
Rewarded and Unrewarded Risk
The Components of Risk
Why Diversification Reduces the Risk
Measuring Market Risk
The Capital Asset Pricing Model
The Arbitrage Pricing Model
Multi-factor Models for risk and return
Proxy Models
The Risk in Borrowing
The Determinants of Default Risk
Default Risk and Interest rates
Defining the Risk
Since financial resources are finite, there is a hurdle that projects have to cross before being
deemed acceptable.
This hurdle will be higher for riskier projects than for safer projects.
A simple representation of the hurdle rate is as follows:
Hurdle rate = Riskless Rate + Risk Premium
Defining the Risk
The two basic questions that every risk and return model in finance tries to
answer are:
How do you measure risk?
How do you translate this risk measure into a risk premium?
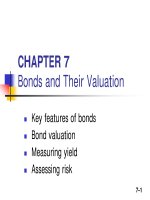
What is Risk?
Risk, in traditional terms, is viewed as a 'negative'. Webster's dictionary, for instance, defines
risk as "exposing to danger or hazard".
The Chinese symbols for risk, reproduced below, give a much better description of risk:
The first symbol is the symbol for "danger", while the second is the symbol for "opportunity",
making risk a mix of danger and opportunity. You cannot have one, without the other.
What is Risk?
Risk is therefore neither good nor bad. It is just a fact of life. The
question that businesses have to address is therefore not whether
to avoid risk but how best to incorporate it into their decision
making.
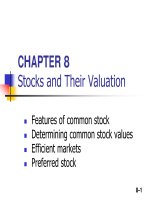
Equity Risk and Expected Returns
Measuring Risk
Investors who buy an asset expect to make a return over the time horizon that they will hold the asset. The actual return that they make
over this holding period may by very different from the expected return, and this is where the risk comes in.
an investor with a 1-year time horizon buying a 1-year
Treasury bill (or any other default-free one-year bond)
with a 5% expected return. At the end of the 1-year
holding period, the actual return will be
?
Measuring Risk
Now consider an investor who invests in Disney. This investor, having done her research, may conclude that she can make an expected return
of 17 % on Disney over her 1-year holding period. The actual return over this period will almost certainly not be equal to 17%: it might be
Much greater, or
Much lower
This Volatility/spread from the average
Return is Known as Risk of the Returns
And is measured by standard deviation
Of the Returns
Rewarded and Unrewarded Risk
When a firm makes an investment, in a new asset or a project, the return on that investment can be affected by
several variables, most of which are not under the direct control of the firm. Some of the risk
comes directly from the investment
a portion from competition
some from shifts in the industry
some from changes in exchange rates
and some from macroeconomic factors.
Rewarded and Unrewarded Risk
Diversifying Risk
In a given year a particular pharmaceutical company may fail in getting approval of a new drug,
thus causing its stock price to drop.
But it is unlikely that every pharmaceutical company will fail major drug trials in the same year.
On average, some are likely to be successful while others will fail. Therefore, the returns for a
portfolio comprised of all drug companies will have much less volatility than that of a single
drug company.
By holding stock in the entire sector of pharmaceuticals we have eliminated quite a bit of risk as
just described.
Diversifying Risk
But it's possible there is sector-level risk that may impact all drug companies.
For example, if the FDA changes its drug- approval policy and requires all new drugs to go through more strict testing
we would expect the entire sector - and our portfolio comprised of all pharmaceutical companies - to suffer.
But what if we held a portfolio of not just pharmaceuticals but also of computer companies, manufacturing
companies, service companies
We would expect this expanded portfolio to be even less risky than a portfolio comprised of just one sector.
In fact, we can imagine a market-level portfolio comprised of all assets. Such a market portfolio would still have
uncertainty and risk but it would be greatly reduced compared to just one asset or even a group of related assets
Diversifying Risk
Systematic Risk & Unsystematic Risk
We can then think of risk as having two components:
1.
2.
Firm specific Risk
Market level Risk
Total Risk = Systematic Risk + Unsystematic Risk
Systematic Risk is the variability of return on stocks or portfolios associated with changes in return on
the market as a whole.
Unsystematic Risk is the variability of return on stocks or portfolios not explained by general market
movements. It is avoidable through diversification.
STD DEV OF PORTFOLIO RETURN
Total
TotalRisk
Risk==Systematic
SystematicRisk
Risk++Unsystematic
UnsystematicRisk
Risk
Total
Unsystematic risk
Risk
Systematic risk
NUMBER OF SECURITIES IN THE PORTFOLIO
Portfolio Expected Return
n
RP = Σ ( Wj )( Rj )
J=1
RP = ( Wj )( Rj )+ ( Wk )( Rk )
RP is the expected return for the portfolio,
Wj is the weight (investment proportion) for the jth asset in the portfolio,
Rj is the expected return of the jth asset,
m is the total number of assets in the portfolio.
Portfolio
Portfolio Standard
Standard Deviation
Deviation
n
n
σP =
Σ Σ Wj Wk σ jk
J=1
K=1
2 2
2
2
σP= Wj σ j +Wk σ k +2 WjWk ρjk σ jσ k
Wj is the weight (investment proportion) for the jth asset in the portfolio,
Wk is the weight (investment proportion) for the kth asset in the portfolio,
σ jk
is the covariance between returns for the j
th
and k
th
assets in the portfolio.
ρjk is the correlation between returns for the jth and kth assets in the portfolio.
Portfolio Risk and Return
Portfolio Combinations and Correlation
Perfect Positive
Correlation – no
diversification
Both portfolio returns
and risk are bounded
by the range set by the
constituent assets
when ρ=+1
Example of Portfolio Combinations and Correlation
Positive Correlation –
weak diversification
potential
When ρ=+0.5 these
portfolio combinations
have lower risk –
expected portfolio return
is unaffected.
Example of Portfolio Combinations and Correlation
No Correlation – some
diversification potential
Portfolio risk is
lower than the risk
of either asset A
or B.
8 - 23
Example of Portfolio Combinations and Correlation
Negative Correlation –
greater diversification
potential
Portfolio risk for more
combinations is lower
than the risk of either
asset
8 - 24
Example of Portfolio Combinations and Correlation
Perfect Negative
Correlation – greatest
diversification potential
Risk of the portfolio is
almost eliminated at 70%
invested in asset A
8 - 25