eMarketer Vietnam online digital usage and behavior 2015 2020
Bạn đang xem bản rút gọn của tài liệu. Xem và tải ngay bản đầy đủ của tài liệu tại đây (1.09 MB, 13 trang )
VIETNAM
ONLINE
Digital Usage and Behavior,
2015-2020
NOVEMBER 2016
Rahul Chadha
Contributor: Dustin Sodano
Read this on
eMarketer for iPad
VIETNAM ONLINE: DIGITAL USAGE AND BEHAVIOR, 2015-2020
Vietnam’s young population and low service costs help give the country a higher internet penetration rate than
most of its neighbors in Southeast Asia. Usage of smartphones and related activities, including use of social media
and messaging apps, are also fairly high.
■■
■■
■■
■■
■■
■■
■■
■■
In 2016, more than half of the country will access the
internet at least once a month—a higher rate than in
India, Indonesia and Thailand.
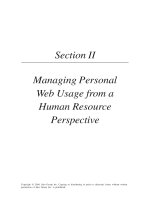
Average Daily Time Spent Online Among Internet
Users in Vietnam, 2015
% of respondents
According to Nielsen, internet users in Vietnam spend
nearly 25 hours per week online. This is high compared
with elsewhere in Southeast Asia.
One poll found that mobile phones are the most
common device used to access the web in Vietnam,
employed by 85% of internet users ages 15 to 49.
Nearly three-quarters (73%) used laptops.
More than one-third of Vietnam’s population are social
network users. By 2020, that figure will approach half
(46.7 million). Smartphones, used by 38.3% of adults
at least monthly, are a main reason behind social
networking’s growth.
Messaging apps are even more popular. One survey
found that 74% of smartphone users used a messaging
service more than once per week, while only 60% had
used social media apps.
Retail ecommerce sales, excluding travel, will total
$1.71 billion in 2016, accounting for just 1.1% of total
retail sales in Vietnam. By 2020, that figure will expand
to only 1.5%.
Purchasing online video is not yet very common. One
poll found that only 13% of internet users in Vietnam
had paid for an online video provider. By comparison,
78% had paid for cable TV and 40% had paid for
satellite TV.
Online video viewers have one destination that stands
out from the rest: YouTube.
WHAT’S IN THIS REPORT? This report looks at some of
the most crucial aspects of Vietnam’s digital usage and
behavior, including internet penetration, smartphones and
social networks, messaging apps, ecommerce and video.
VIETNAM ONLINE: DIGITAL USAGE AND BEHAVIOR, 2015-2020
<3 hours
7%
9+ hours
20%
3-5 hours
26%
7-9 hours
15%
5-7 hours
32%
Note: n=967 ages 15-49
Source: Vietnam Ecommerce and Information Technology Agency (VECITA),
"2015 Vietnam Ecommerce Report," April 15, 2016
210076
www.eMarketer.com
KEY STAT: Internet users in Vietnam tend to spend a
great deal of time online. In 2015, 58% of users spent an
average of 3 to 7 hours daily online, while 20% spent 9 or
more hours on the web.
CONTENTS
2 Vietnam Online: Digital Usage and Behavior, 2015-2020
3 Vietnam’s Internet Penetration Is Driven by Mobile Phones
4 Smartphone Users Gravitate to Social Networks
6 Messaging Apps Appeal to the Price Conscious
7 Local and Regional Players Rule Ecommerce
10 Paying Customers Still Prefer Cable and Satellite over
Video-on-Demand
12 eMarketer Interviews
12 Related eMarketer Content
12 Related Links
12 Editorial and Production Contributors
©2016 EMARKETER INC. ALL RIGHTS RESERVED2
VIETNAM’S INTERNET
PENETRATION IS DRIVEN BY
MOBILE PHONES
Vietnam has one of the higher internet penetration
rates in Southeast Asia thanks to a young population
and low access costs. eMarketer estimates that this
year, for the first time, more than half of the country’s
population (50.6%) will access the internet at least
once a month. That puts its penetration rate above
India, Indonesia and Thailand. The number of internet
users in the country is expected to grow from
48.2 million in 2016 to 61.7 million in 2020, when the
penetration rate will reach 62.5%.
Vietnam’s internet growth is complicated by the active
role the government plays in regulation. While the
economic reforms begun by the government in 1986—
known collectively as Doi Moi—have liberalized the
country’s economy, the government still monitors online
content and suppresses anything deemed subversive.
While the level of control over the internet in Vietnam
does not approach that seen in China, the country’s two
largest internet service providers, Viettel and Vietnam Post
and Telecommunications (VNPT), are state-run entities.
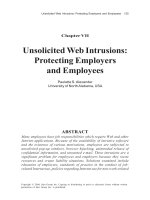
Weekly Time Spent Online According to Internet
Users in Select Countries in Asia-Pacific, Nov 2015
hours
Singapore
25.9
Philippines
24.7
Vietnam
24.7
Hong Kong
24.4
Malaysia
24.2
India
24.1
Taiwan
23.0
Indonesia
20.3
Thailand
19.5
Note: n=1,000 ages 16+ in each country
Source: Nielsen, "Cross-Platform Insights Report 2015" as cited in press
release, June 21, 2016
212518
www.eMarketer.com
The amount of time internet users spend online daily was
also substantial. According to the Vietnam Ecommerce
and Information Technology Agency (VECITA), only 7% of
internet users in Vietnam spent an average of 3 hours or
less online each day in 2015, while 58% spent between 3
and 7 hours.
Average Daily Time Spent Online Among Internet
Users in Vietnam, 2015
% of respondents
However, these controls have not tempered residents’
interest in accessing the internet. According to November
2015 data from Nielsen, internet users in Vietnam spent
an average of 24.7 hours per week online, tying them
with internet users in the Philippines, and trailing only
internet users in Singapore, a country with a much more
robust internet infrastructure.
9+ hours
20%
<3 hours
7%
3-5 hours
26%
7-9 hours
15%
5-7 hours
32%
Note: n=967 ages 15-49
Source: Vietnam Ecommerce and Information Technology Agency (VECITA),
"2015 Vietnam Ecommerce Report," April 15, 2016
210076
www.eMarketer.com
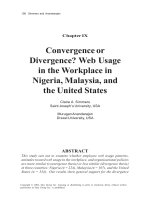
For consumers in Vietnam, the route to the internet will
increasingly run through mobile devices. VECITA also
reported that in 2015 mobile phones surpassed laptops as
the device most commonly used to access the internet:
85% of internet users ages 15 to 49 said they relied on
mobile phones to get online, while 73% of respondents
used a laptop.
VIETNAM ONLINE: DIGITAL USAGE AND BEHAVIOR, 2015-2020
©2016 EMARKETER INC. ALL RIGHTS RESERVED3
Devices Used to Access the Internet Among Internet
Users in Vietnam, 2014 & 2015
% of respondents
Laptop
75%
73%
Mobile phone
65%
85%
Desktop
33%
38%
Tablet
SMARTPHONE USERS GRAVITATE
TO SOCIAL NETWORKS
Internet users, particularly those on advanced
handsets, have been quick to join social networks.
eMarketer estimates that 35.8 million people in
Vietnam will be social network users in 2016, or 37.6%
of the population. By 2020, those figures will climb to
46.7 million people and a penetration rate of 47.3%.
Social Network Users and Penetration in Vietnam,
2015-2020
19%
19%
2014
2015 2016 2017 2018 2019 2020
2015
Social network users (millions) 32.3 35.8 39.1 42.1 45.1 46.7
Note: n=967 ages 15-49
Source: Vietnam Ecommerce and Information Technology Agency (VECITA),
"2015 Vietnam Ecommerce Report," April 15, 2016
—% change
13.8% 10.9% 9.2% 7.8% 6.9% 3.6%
—% of internet users
72.7% 74.2% 75.1% 75.5% 75.6% 75.7%
210077
—% of population
34.2% 37.6% 40.7% 43.4% 46.0% 47.3%
www.eMarketer.com
Internet access via mobile phones will continue to grow
in part due to the continued adoption of smartphones
in Vietnam. eMarketer estimates that the number of
smartphone users in the country will increase from
36.5 million, or 38.3% of the population, this year to
58.4 million users in 2020, when they will account for
59.2% of residents.
Mobile Phone* and Smartphone** Users in Vietnam,
2015-2020
Mobile phone users*
(millions)
—% of population
2015
2016
2017
2018
2019
2020
57.1
59.2
61.0
62.9
64.5
65.9
60.5% 62.1% 63.5% 64.8% 65.9% 66.8%
Note: internet users who use a social network via any device at least once
per month
Source: eMarketer, Nov 2016
218574
Kantar Media Vietnam (KMV) found that 80% of internet
users ages 15 to 54 in urban areas in Vietnam polled
in 2015 used social networks, making it the most
popular internet activity in the survey, tied with visiting
news websites.
Leading Internet Activities Among Internet Users in
Vietnam*, 2015
% of respondents
Access news websites
80%
80%
—% change
4.4%
3.7%
3.1%
3.1%
2.6%
2.2%
Social network use
Smartphone users**
(millions)
27.2
36.5
43.7
49.5
54.5
58.4
Instant messaging
—% of population
28.8% 38.3% 45.5% 51.0% 55.6% 59.2%
Online newspaper
—% change
Find information
7.3%
Note: *individuals of any age who own at least one mobile phone and use
the phone(s) at least once per month; **individuals of any age who own at
least one smartphone and use the smartphone(s) at least once per month
Source: eMarketer, Sep 2016
215558
www.eMarketer.com
A May 2016 survey of smartphone users in Asia-Pacific
from research firm GfK found that 81% of respondents in
Vietnam used their devices to access the internet daily.
That figure was higher than the one reported for Japan,
India and Australia, underscoring just how fundamental
smartphones have become to gaining internet access
in Vietnam.
VIETNAM ONLINE: DIGITAL USAGE AND BEHAVIOR, 2015-2020
72%
Listen to music online
—% of mobile phone users 47.6% 61.7% 71.6% 78.7% 84.4% 88.6%
40.4% 34.4% 19.8% 13.3% 10.1%
www.eMarketer.com
69%
68%
62%
View video clip
47%
Send/receive emails
Watch TV shows
Academic/research
39%
34%
33%
Note: n=5,775 ages 15-54; *urban areas
Source: Kantar Media Vietnam (KMV), "Vietnam Media Habit Survey," May 5,
2016
210817
www.eMarketer.com
©2016 EMARKETER INC. ALL RIGHTS RESERVED4
Smartphones will play a key role in facilitating access to
social networks among internet users. Research from
W&S Group found that social media app use was already
deeply entrenched in the behavior of smartphone users
in Vietnam, a mobile-first market. According to a poll of
smartphone app users in Vietnam conducted by W&S
Group in March 2016, 84.1% of respondents opened a
social networking app daily.
Frequency with Which Smartphone Social Media App
Users in Indonesia, Thailand and Vietnam Use
Smartphone Social Media Apps, March 2016
% of respondents
Indonesia
Thailand
Vietnam
Daily
80.9%
86.9%
84.1%
5-6 times per week
10.7%
7.7%
8.5%
3-4 times per week
3.9%
3.0%
3.0%
1-2 times per week
2.2%
1.5%
3.6%
Less than once per week
2.4%
0.9%
0.8%
Note: Indonesia n=460; Thailand n=465; Vietnam n=504; ages 17+;
respondents referred to their most used social media apps in the past 30
days; numbers may not add up to 100% due to rounding
Source: W&S Group, "Tracking Study on Smartphone Applications," May 11,
2016
210840
www.eMarketer.com
In addition, W&S Group reported that 84.0% of
smartphone users in Vietnam had opened a social
networking app sometime in the 30 days preceding its
March 2016 poll. That put social networking apps ahead of
other app categories in the poll, including games, music,
and photo and video apps.
Facebook has already established a strong presence in
Vietnam, with an estimated 91.5% of all social network
users in the country accessing the platform in 2016.
eMarketer projects the number of Facebook users in
Vietnam will increase from 32.7 million this year (34.4%
of the population) to 43.5 million (44.1%) in 2020.
Facebook Users and Penetration in Vietnam,
2015-2020
2015 2016 2017 2018 2019 2020
Facebook users (millions)
32.7
36.0
39.0
41.9
43.5
—% change
14.5% 11.5%
29.4
9.8%
8.4%
7.5%
3.8%
—% of social network users
91.0% 91.5% 92.0% 92.5% 93.0% 93.2%
—% of internet users
66.2% 67.9% 69.1% 69.8% 70.3% 70.5%
—% of population
31.1% 34.4% 37.4% 40.2% 42.8% 44.1%
Facebook’s dominance over competing social networks in
Vietnam also extends to smartphones. According to We
Are Social, Facebook’s social media app had a penetration
rate of 29% among the overall population as of Q4 2015,
putting it ahead of local chat app Zalo, Google+, Line,
Twitter and Instagram, among other social media and
messaging platforms.
Social Media/Messaging App User Penetration in
Vietnam, by Platform, Q4 2015
% of population
29%
Zalo
25%
Facebook Messenger
25%
Google+
20%
Skype
15%
Viber
11%
Line
10%
9%
9%
6%
Source: We Are Social, "Digital in 2016," Jan 27, 2016
204245
www.eMarketer.com
While Facebook has experienced success in capturing
market share, its gains also face a potential threat.
Vietnam’s government has shown a willingness to block
the platform at moments of political unrest, as when
protesters gathered for rallies in May 2016 following mass
fish deaths attributed to pollution released into waters
from a plastics manufacturing company.
While Facebook once faced competition from local
upstart Zing Me, the latter was unable to keep pace with
the innovations offered by Mark Zuckerberg’s company,
and was eventually abandoned by users. Now Facebook
is the clear leader in Vietnam, with a penetration rate that
will be hard for competitors to reach or even approach.
Note: internet users who access their Facebook account via any device at
least once per month
Source: eMarketer, Nov 2016
218786
VIETNAM ONLINE: DIGITAL USAGE AND BEHAVIOR, 2015-2020
www.eMarketer.com
©2016 EMARKETER INC. ALL RIGHTS RESERVED5
MESSAGING APPS APPEAL TO
THE PRICE CONSCIOUS
Messaging Apps that Smartphone Users in Vietnam
Have Installed on Their Smartphone, by Age,
June 2016
% of respondents in each group
In Vietnam, messaging apps are broadly adopted by
smartphone users for a simple reason—they provide
users with over-the-top (OTT) services that allow
customers to avoid sometimes costly texting services
provided by mobile network operators.
The GfK survey found that 74% of smartphone users in
Vietnam used a messaging service more than once per
week, a higher figure than those who used either social
media (60%) or shopping apps (31%).
Smartphone Users in Asia-Pacific Who Use
Smartphone Messaging, Social Media and Shopping
Apps Regularly*, by Country, May 2016
% of respondents
Messaging
Social media
Shopping
Australia
70%
63%
21%
China
79%
70%
48%
India
82%
81%
54%
Indonesia
83%
86%
35%
Japan
39%
47%
15%
Singapore
82%
76%
37%
Thailand
55%
82%
32%
Vietnam
74%
60%
31%
Note: n=8,099 ages 18+; *more than once per week
Source: GfK, "The Connected Consumer: Insights into Digital Consumer
Behavior in APAC," June 22, 2016
213791
www.eMarketer.com
Messaging app users in Vietnam have embraced local
platform Zalo in a market that is now crowded with
international competitors. According to DI Marketing,
80% of smartphone users polled in June 2016 had Zalo
installed on their devices, more than the 73% who
had installed Facebook Messenger. Global messaging
giants WeChat and WhatsApp barely registered among
smartphone users in Vietnam, with install rates of 5% and
4%, respectively.
18-25
26-30
30-35
35+
Total
Zalo
80%
83%
81%
71%
80%
Facebook Messenger
78%
72%
75%
55%
73%
Viber
33%
43%
51%
51%
40%
Skype
37%
40%
41%
23%
37%
Line
21%
18%
15%
11%
18%
Yahoo
9%
11%
16%
13%
11%
Tango
7%
10%
11%
13%
9%
4%
7%
8%
2%
5%
4%
4%
5%
3%
4%
KakaoTalk
3%
3%
4%
1%
3%
BeeTalk
3%
1%
3%
1%
2%
Snapchat
2%
1%
3%
2%
2%
Other
1%
3%
1%
1%
2%
Note: n=1,200
Source: DI Marketing, "Chat Apps Usage in Vietnam," June 10, 2016
212098
www.eMarketer.com
Zalo’s parent company, VNG, reported in April 2016 that its
messaging app had 50 million registered users. Despite
its near ubiquity among smartphone users in Vietnam,
Zalo still faces a formidable opponent in Facebook
Messenger, which had nearly the same install rate as Zalo
among those ages 18 to 25, according to DI Marketing.
In addition, We Are Social data cited earlier found that
Zalo and Facebook Messenger had the same install rate,
25%, among smartphone users in Vietnam as of Q4 2015.
Zalo has benefitted from a lack of strong competition
from regional messaging platforms like Line and Kakao
Talk. This is partly due to resistance among consumers
to digital payment systems. In underbanked Vietnam,
consumers still rely on cash to pay for most goods and
services. While Facebook generates its revenues largely
through advertising, platforms like Line and Kakao Talk
are heavily reliant on in-app purchases made using digital
payment systems, which are not yet widely adopted
in Vietnam.
The use of messaging apps in Vietnam is not a zero-sum
game, with a majority of end-users installing a number of
apps that provide essentially the same service. According
to DI Marketing, 89% of messaging app users in Vietnam
used more than one messaging app.
VIETNAM ONLINE: DIGITAL USAGE AND BEHAVIOR, 2015-2020
©2016 EMARKETER INC. ALL RIGHTS RESERVED6
LOCAL AND REGIONAL PLAYERS
RULE ECOMMERCE
Number of Messaging Apps Used by Smartphone
Messaging App Users in Vietnam, by Age, June 2016
% of respondents
18-25
10%
15%
30%
26-30
7%
34%
33%
30-35
12%
25%
30%
18%
21%
24%
11%
16%
14%
35+
24%
35%
Total
12%
1
33%
2
26%
27%
3
17%
4
9% 6%
12%
Retail ecommerce sales in Vietnam will total
$3.26 billion by 2020, constituting 1.5% of all retail
sales, eMarketer estimates.
5+
Note: n=1,200; via smartphone; numbers may not add up to 100% due to
rounding
Source: DI Marketing, "Chat Apps Usage in Vietnam," June 10, 2016
212097
Ecommerce has yet to take off in Vietnam. eMarketer
anticipates retail ecommerce sales, excluding travel,
will total $1.71 billion in 2016, accounting for only
1.1% of the $161.16 billion in total retail sales.
Total Retail and Retail Ecommerce* Sales in Vietnam,
2015-2020
billions, % change and % of total retail sales
www.eMarketer.com
The market for messaging apps was most fragmented at
the younger end, with 45% of respondents ages 18 to 25
using four or more messaging apps. In fact, the research
showed that those under 35 were using only one app in
significantly smaller numbers than those who were 35
or older.
2015
Total retail
sales
—% change
2016
2017
2018
2019
2020
$147.99 $161.16 $174.37 $187.45 $200.57 $213.61
9.9%
8.9%
8.2%
7.5%
7.0%
6.5%
Retail
ecommerce*
sales
$1.37
$1.71
$2.08
$2.47
$2.88
$3.26
—% change
43.5%
24.3%
22.0%
18.5%
16.8%
13.2%
—% of total
retail sales
0.9%
1.1%
1.2%
1.3%
1.4%
1.5%
Note: converted at the exchange rate of US$1=VND21,913.7; excludes
travel and event tickets; *includes products or services ordered using the
internet via any device, regardless of the method of payment or fulfillment
Source: eMarketer, Aug 2016
213220
www.eMarketer.com
VECITA reported that ecommerce revenue in 2015
had totaled $4.07 billion, an increase of 37% from the
previous year.
The country’s ecommerce landscape is dominated by
local and regional players. Lazada Vietnam, which is
majority-owned by China’s Alibaba Group and carries its
own inventory and serves as a marketplace, ranks among
the top players in the country. According to SimilarWeb,
Lazada Vietnam recorded the highest number of monthly
page views in Vietnam in August 2016 at 24.5 million. That
put it ahead of consumer electronics retailer The Gioi Di
Dong, business-to-consumer (B2C) platform Tiki.vn, online
retailer Sendo.vn and several others.
VIETNAM ONLINE: DIGITAL USAGE AND BEHAVIOR, 2015-2020
©2016 EMARKETER INC. ALL RIGHTS RESERVED7
Leading B2C Ecommerce Sites in Vietnam, Ranked by
Monthly Page Views, Aug 2016
millions
Product/Service Categories Purchased Digitally by
Digital Buyers in Vietnam, 2015
% of respondents
Lazada Vietnam
Clothing, shoes, cosmetics
24.5
The Gioi Di Dong
17.1
Tiki.vn
Tech/electronics
11.7
Sendo.vn
56%
Kitchen and home appliances
10.7
Vatgia.com
49%
10.4
Fptshop
Lozi
Books, stationery, gifts, flowers
7.7
3.2
Hotdeal
3.2
Nguyenkim.com
42%
Travel (airfare, train ticket)
34%
Food
2.4
1.5
33%
Phongvu
Note: represents activity tracked by SimilarWeb, broader industry metrics
may vary
Source: SimilarWeb as cited by ecommerceIQ, Sep 27, 2016
217789
www.eMarketer.com
According to data from DI Marketing, advanced handsets
have still not yet displaced desktops and laptops. Its
August 2016 survey of digital buyers in Vietnam found
that 75% of respondents used a PC to make a purchase,
while 51% used a smartphone and 21% used a tablet.
Devices Used for Digital Purchases by Digital Buyers
in Vietnam, Aug 2016
% of respondents
Desktop/laptop
75%
Smartphone
Tablet
64%
51%
21%
Note: n=565
Source: DI Marketing, "Study About Online Shopping Behavior in Vietnam,"
Sep 12, 2016
216713
www.eMarketer.com
However, there are signs that advanced handsets are
making inroads among digital buyers in Vietnam. Tran Hai
Linh, CEO of Sendo.vn, said in June 2016 that 75% of its
customers accessed the site by smartphone.
The growth of mcommerce in Vietnam is also in line with
wider regional trends. Online marketing services provider
Criteo found that mobile transactions made up 54% of all
digital ecommerce transactions in Southeast Asia in Q2
2016, an increase from 39% in Q4 2015.
Movie or concert tickets
22%
Hotel bookings, tours
19%
Education/business services
7%
Music/videos/DVDs/games
7%
Spa and beauty services
6%
Other
2%
Note: ages 15-49
Source: Vietnam Ecommerce and Information Technology Agency (VECITA),
"2015 Vietnam Ecommerce Report," April 15, 2016
210032
www.eMarketer.com
DIGITAL BUYERS ATTACHED TO CASH
ON DELIVERY
In Vietnam, cash on delivery (COD) remains a favored
payment method among consumers, especially in
urban areas.
According to a July 2016 survey of digital buyers living in
urban Vietnam conducted by Q&Me, 85% of respondents
used COD as their main payment method for digital
purchases. Bank transfers were the primary payment
method for 8% of those polled, while only 6% said they
relied on debit or credit cards, a reflection of the low
penetration rate of payment cards in the country.
VECITA found that 64% of digital buyers in Vietnam had
purchased soft goods and cosmetics digitally in 2015,
making them the most popular product category for
ecommerce. Consumer electronics ranked second (56%),
followed by kitchen and other home appliances (49%).
VIETNAM ONLINE: DIGITAL USAGE AND BEHAVIOR, 2015-2020
©2016 EMARKETER INC. ALL RIGHTS RESERVED8
Primary Payment Method Used for Digital Purchases
According to Digital Buyers in Urban Vietnam*,
July 2016
% of respondents
Credit card/
debit card
6%
Bank
transfer
8%
Cash on delivery
85%
Note: numbers may not add up to 100% due to rounding; *Hanoi and Ho
Chi Minh City
Source: Q&Me, "Vietnam Ecommerce Market Survey," July 19, 2016
214693
www.eMarketer.com
Similarly, VECITA reported that 91% of digital buyers in
Vietnam had used COD to complete an ecommerce
transaction in 2015, an increase from 64% in 2014. Digital
buyers’ use of ewallets actually declined from 37% to
11% over the same time period, while bank transfers
were used by 48% of buyers in 2015, up from 14% the
year before.
Payment Methods Used for Ecommerce Transactions
According to Digital Buyers in Vietnam, 2014 & 2015
% of respondents
Cash on delivery
64%
91%
Ewallet
Vietnam is similar to India in its adherence to COD as a
preferred payment method. As in India, consumers have
little incentive to switch over to other payment methods,
with many services accepting cash as a matter of course.
“Even if I want to pay my electricity bill, someone
comes around and collects cash,” said Richard Burrage,
managing partner at Vietnam-based market research firm
Cimigo. Furthermore, COD also makes it easier to refuse
an order once it arrives. “If I do some shopping online, I’ll
pay them in cash. All of the fears of online shopping are
dispersed; if I don’t like it, I can turn it away,” said Burrage.
The ability of consumers to inspect goods purchased
online before paying has alleviated some of the trust
issues related to the nascent ecommerce market in
Vietnam, but it has also provided an incentive for vendors
and third-party logistics providers to keep the cost of COD
free or low. And when costs related to COD purchases
are incurred, they are usually shouldered by the merchant.
In addition, merchants and consumers prefer cash
payments because it’s easier for such transactions to
remain off the books, thus avoiding taxes.
Bank cards are rarely used to buy goods or services
thanks to the combination of an underbanked populace
and a dearth of point-of-sale (POS) terminals for offline
purchases. The government in Vietnam has moved in
recent years to encourage consumers to move toward
payment methods other than cash by establishing new
regulations for digital payments.
Still, much work remains to be done if vendors are going
to start accepting more payment methods. According to
a November 2015 survey of businesses in Vietnam by
the Vietnam Ecommerce Association (VECOM), nearly all
(97%) respondents accepted bank transfers, while only
16% accepted payment cards, a category that included
credit and debit cards. Only 4% accepted digital wallets.
37%
11%
Bank transfer
14%
48%
Scratch cards
11%
6%
Payment card (credit, debit, gift, etc.)
7%
Noncash Payment Methods Accepted by Businesses
in Vietnam, Nov 2015
% of respondents
20%
Other
1%
Bank transfer
1%
16%
2014
2015
4%
Note: ages 15-49
Source: Vietnam Ecommerce and Information Technology Agency (VECITA),
"2015 Vietnam Ecommerce Report," April 15, 2016
210079
www.eMarketer.com
2%
Payment card*
Digital wallet
Scratch card**
Note: n=4,735; *includes all types of payment cards (credit, debit, gift, etc.);
**type of preloaded payment card
Source: Vietnam Ecommerce Association (VECOM), "Viet Nam E-Business
Index 2015," Feb 1, 2016
205474
VIETNAM ONLINE: DIGITAL USAGE AND BEHAVIOR, 2015-2020
97%
www.eMarketer.com
©2016 EMARKETER INC. ALL RIGHTS RESERVED9
The digital wallet sector in Vietnam remains fractured.
Online newspaper VietnamNet reported in August 2016
that there were 16 digital wallets in operation in the
country as of May 2016, but many of them had been
developed by ecommerce platforms and worked solely on
those websites. In order for digital payment methods like
mobile wallets to catch on in Vietnam, they will have to
provide a greater range of service options for consumers.
PAYING CUSTOMERS STILL
PREFER CABLE AND SATELLITE
OVER VIDEO-ON-DEMAND
Despite the emergence of various video-on-demand
(VOD) platforms in Vietnam, paying for online video
services has not yet become a widespread behavior
among consumers there.
A September 2015 poll of internet users in the
country conducted by Nielsen found that only 13% of
respondents paid for an online video service provider.
Cable TV remained the dominant mode of pay TV, used by
78%, while 40% paid for satellite TV.
Internet Users in Vietnam Who Currently Pay for
Select TV/Video Services, Sep 2015
% of respondents
Cable provider
78%
Satellite provider
13%
7%
4%
40%
Online service provider
Other
None of these
Source: Nielsen, "Global Video-on-Demand Survey" as cited in press
release, March 18, 2016
210113
www.eMarketer.com
Despite the uphill battle online video services face
from traditional TV platforms, digitally savvy consumers
are turning to online resources in search of more and
different programming, as well as the freedom offered
by on-demand services, according to data from Nielsen’s
November 2015 study.
“Consumers are exercising their choice of how, when and
where they can obtain their content and are more active
in their media habits than ever before,” said Doan Duy
Khoa, director of consumer insights for Nielsen Vietnam.
VIETNAM ONLINE: DIGITAL USAGE AND BEHAVIOR, 2015-2020
©2016 EMARKETER INC. ALL RIGHTS RESERVED10
YOUTUBE ECLIPSES THE COMPETITION
Among those who have embraced online video, YouTube
has emerged as a favorite destination. The adoption
of YouTube by video viewers in Vietnam makes sense
given the platform’s ad-supported model, which gives
consumers resistant to paying for videos access to
free content.
According to data from comScore Video Metrix, Google
sites (a category that mainly refers to YouTube) had the
most unique viewers of any online video property in
Vietnam in March 2016, with 15.4 million.
Top 10 Online Video Properties Among Internet Users
in Vietnam, Ranked by Unique Viewers, March 2016
millions
1. Google sites*
1. YouTube
97%
2. Facebook
3. NhacCuaTui.com
81%
56%
Note: ages 16+
Source: Nielsen, "Cross-Platform Insights Report 2015" as cited in press
release, June 21, 2016
212515
www.eMarketer.com
Although it did not register on either Nielsen or
comScore’s list of top online video properties, Netflix has
been available in Vietnam since January 2016. However,
the subscription-based service suffers from a lack of
localized content and the absence of Vietnamese subtitles
for much of its nonlocal content.
15.4
2. BroadbandTV
12.5
3. QuizGroup
10.0
4. BlueSeed Digital
7.2
5. Facebook
6.8
6. Maker Studios
6.1
7. Fullscreen
6.0
8. Coc Coc
5.9
9. Videology
5.8
10. Warner Music
Top 3 Video-on-Demand (VOD) Platforms According to
VOD Viewers in Vietnam, Nov 2015
% of respondents
4.8
Note: home and work locations; includes ad and content video streaming;
*mainly refers to YouTube
Source: comScore Video Metrix, May 19, 2016
211295
www.eMarketer.com
comScore’s data included a litany of online video content
studios that largely publish their work on YouTube, such as
BroadbandTV, Maker Studios and Fullscreen. But it also
included Facebook, which garnered 6.8 million views in
the month, as well as Vietnam-based web browser Coc
Coc (5.9 million).
Similarly, the November 2015 Nielsen data found that
YouTube was the most popular platform among VOD
viewers in Vietnam. In fact, 97% of respondents used
YouTube, while 81% used Facebook. Local platform
NhacCuaTui.com was also a favorite, used by 56% of
those polled.
VIETNAM ONLINE: DIGITAL USAGE AND BEHAVIOR, 2015-2020
©2016 EMARKETER INC. ALL RIGHTS RESERVED11
EMARKETER INTERVIEWS
Marketing in Asia-Pacific: Millennials in Vietnam Are
Social, Skeptical and Seeking Role Models
Richard Burrage
Managing Partner
Cimigo
Interview conducted on April 20, 2016
RELATED EMARKETER CONTENT
Digital Usage in Southeast Asia: Vietnam
EDITORIAL AND
PRODUCTION CONTRIBUTORS
Cliff Annicelli
Michael Balletti
Joanne DiCamillo
Dana Hill
Eden Kelley
Stephanie Meyer
Kris Oser
Heather Price
John Rambow
Allie Smith
Managing Editor, Reports
Copy Editor
Senior Production Artist
Director of Production
Chart Editor
Senior Production Artist
Deputy Editorial Director
Senior Copy Editor
Executive Editor, Reports
Director of Charts
Global Millennials 2016: Gauging the Digital Behavior
of Young Adults Around the World
Mobile Commerce in Vietnam: An Early Picture
Retail Ecommerce Sales in Southeast Asia:
Opportunities and Challenges for Six Key Markets
Social Network Users: Vietnam
RELATED LINKS
comScore Inc.
Criteo
DI Marketing
GfK
Kantar Media Vietnam (KMV)
Nielsen
Q&Me
SimilarWeb
Vietnam Ecommerce Association (VECOM)
Vietnam Ecommerce and Information Technology
Agency (VECITA)
W&S Group
We Are Social
VIETNAM ONLINE: DIGITAL USAGE AND BEHAVIOR, 2015-2020
©2016 EMARKETER INC. ALL RIGHTS RESERVED12
The leading research firm for marketing in a digital world.
Coverage of a Digital World
eMarketer data and insights address how consumers
spend time and money, and what marketers are doing to
reach them in today’s digital world. Get a deeper look at
eMarketer coverage, including our reports, benchmarks and
forecasts, and charts.
Confidence in the Numbers
Our unique approach of analyzing data from multiple
research sources provides our customers with the most
definitive answers available about the marketplace.
Learn why.
Customer Stories
The world’s top companies across every industry look to
eMarketer first for information on digital marketing, media
and commerce. Read more about how our clients use
eMarketer to make smarter decisions.
Your account team is here to help:
Email to submit a request for research support, or contact
or 866-345-3864 to discuss any details related to your account.