Tiếng anh chuyên ngành kế toán part 6
Bạn đang xem bản rút gọn của tài liệu. Xem và tải ngay bản đầy đủ của tài liệu tại đây (110.71 KB, 10 trang )
38
Understanding the Numbers
or simply employing a fairly recent average value for the gains in making earn-
ings projections.
After 1996, Delta Air Lines disclosed little in the way of nonrecurring
gains on the sale of flight equipment. Its 2000 annual report, which covered
the years from 1998 to 2000, did not disclose any gains or losses on the disposi-
tion of flight equipment.
5
With hindsight, the first option, which would re-
move all of the gains and losses on flight equipment, may have been the most
appropriate alternative.
The Goodyear Tire and Rubber Company provides a timeless example of
the impact of nonrecurring items on the evaluation of earnings performance.
Exhibit 2.2 shows pretax results for Goodyear, with and without losses on for-
eign exchange.
As with Delta Air Lines, it may seem questionable to characterize as non-
recurring exchange losses that appear repeatedly. However, in line with the key
characteristics of nonrecurring items given earlier, Goodyear’s foreign exchange
losses are both irregular in amount and unlikely to be consistent contributors to
results in future years. Across the period 1993 to 1995 the reduction in foreign
exchange losses contributed to Goodyear’s pretax results by $35.5 million in
1994 and $60.2 million in 1995. That is, the entire $60.1 million increase in earn-
ings for 1995 could be attributed to the $60.2 million decline in foreign exchange
losses. The only way that the foreign exchange line could contribute a further
$60.2 million to pretax earnings in 1996 would be for Goodyear to produce a for-
eign exchange gain of $42.8 million ($60.2 − $17.4).
6
Other examples of irregular items of revenue, gain, expense, and loss
abound. For example, there were temporary revenue increases and decreases
associated with the Gulf War. (“Sales to the United States government in-
creased substantially during the Persian Gulf War. However, sales returned to
more normal levels in the second half of the year.”
7
) Temporary revenue in-
creases have been associated with expanded television sales due to World Cup
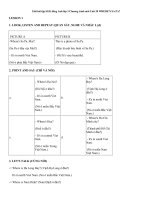
EXHIBIT 2.2 The Goodyear Tire and Rubber Company, results with
and without foreign-exchange losses, years ended
December 31 (in millions).
1993 1994 1995
Income before income taxes, extraordinary
item and cumulative effect of
accounting change $784.9 $865.7 $925.8
Add back foreign exchange losses 113.1 77.6 17.4
Income exclusive of foreign-exchange losses $898.0 $943.3 $943.2
Percentage income increase:
Income as reported 10.3% 6.9%
Income exclusive on foreign-exchange losses 5.0% 0.0%
SOURCE
: The Goodyear Tire and Rubber Company, annual report, December 1995, 24.
Analyzing Business Earnings
39
soccer. Temporary increases or decreases in earnings have resulted from ad-
justments to loan loss provisions resulting from economic downturns and sub-
sequent recoveries in the financial services industry. Most recently, there have
been widely publicized problems with tires produced for sports utility vehicles
that will surely create substantial nonrecurring increases in legal and warranty
expenses.
Identifying nonrecurring or irregular items is not a mechanical process;
it calls for the exercise of judgment and involves both line items and as the
pe
riod-to-period behavior of individual income statement items.
THE PROCESS OF IDENTIFYING NONRECURRING ITEMS
Careful analysis of past financial performance aimed at removing the effects
of nonrecurring items is a more formidable task than one might suspect. This
task would be fairly simple if (1) there was general agreement on just what con-
stitutes a nonrecurring item and (2) if most nonrecurring items were promi-
nently displayed on the face of the income statement. However, neither is the
case. Some research suggests that fewer than one-fourth of nonrecurring items
are likely to be found separately disclosed in the income statement.
8
Providing
guidance for locating the remaining three-fourths is a key goal of this chapter.
Identif ying Nonrecurring Items:
An Ef ficient Search Procedure
The search sequence outlined in the following discussion locates a high cumu-
lative percentage of material nonrecurring items and does so in a cost-effective
manner. Search cost, mainly in time spent by the financial analyst, is an impor-
tant consideration. Time devoted to this task is not available for another and,
therefore, there is an opportunity cost to consider. The discussion and guid-
ance that follows are organized around this recommended search sequence
(see Exhibit 2.3). Following only the first five steps in this search sequence is
likely to locate almost 60% of all nonrecurring items.
9
Continuing through
steps six and seven will typically increase this location percentage. However,
the 60% discovery rate is higher if the focus is only on material nonrecurring
items. The nonrecurring items disclosed in other locations through steps 6 and
7 are fewer in number and normally less material than those initially found
through the first five.
NONRECURRING ITEMS IN THE INCOM E STATEMENT
An examination of the income statement, the first step in the search sequence,
requires an understanding of the design and content of contemporary income
statements. This knowledge will aid in the location and analysis of nonre
curring
40
Understanding the Numbers
components of earnings. Generally accepted accounting principles (GAAPs)
determine the structure and content of the income statement. Locating nonre-
curring items in the income statement is a highly efficient and cost-effective
process. Many nonrecurring items will be prominently displayed on separate
lines in the statement. Further, leads to other nonrecurring items, disclosed
elsewhere, may be discovered during this process. For example, a line item that
summarizes items of other income and expense may include an associated note
reference detailing its contents. These notes should always be reviewed—step
5 in the search sequence—because they will often reveal a wide range of non-
recurring items.
Alternative Income Statement Formats
Examples of the two principal income statement formats under current GAAPs
are presented below. The income statement of Shaw Industries Inc., in Ex-
hibit 2.4 is single step and that of Toys “R” Us Inc. in Exhibit 2.5 is multistep.
An annual survey of financial statements conducted by the American Institute
of Certified Public Accountants (AICPA) reveals that about one-third of the
600 companies in its survey use the single-step format and the other two-thirds
the multistep.
10
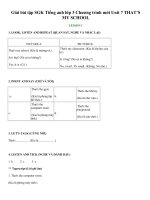
EXHIBIT 2.3 Ef ficient search sequence for nonrecurring items.
Search
Step Search Location
1 Income statement.
2 Statement of cash flows—operating activities section only.
3 Inventory note, generally assuming that the firm employs the LIFO inventory
method. However, even with non-LIFO firms, inventory notes may reveal
inventory write-downs.
4 Income tax note, with attention focused on the tax-reconciliation schedule.
5 Other income (expense) note in cases where this balance is not detailed on the
face of the income statement.
6 MD&A of Financial Condition and Results of Operations—a Securities and
Exchange Commission requirement and therefore available only for public
companies.
7 Other notes which often include nonrecurring items:
Note Nonrecurring items revealed
a. Property and equipment Gains and losses on asset sales
b. Long-term debt
Foreign currency and debt-retirement gains and losses.
c. Foreign currency Foreign currency gains and losses
d. Restructuring Current and prospective impact of of restructuring
activities
e. Contingencies Prospective revenues and expenses
f. Segment disclosures Various nonrecurring items
g. Quarterly financial data Various nonrecurring items
Analyzing Business Earnings
41
The distinguishing feature of the multistep statement is that it provides
intermediate earnings subtotals that are designed to measure pretax operating
performance. In principle, operating income should be composed almost en-
tirely of recurring items of revenue and expense, which result from the main
operating activities of the firm. In practice, numerous material nonrecurring
items are commonly included in operating income. For example, “restructur-
ing” charges, one of the most common nonrecurring items of the past decade,
is virtually always included in operating income.
Shaw Industries’ single-step income statement does not partition results
into intermediate subtotals. For example, there are no line items identified as
either “gross profit” or “operating income.” Rather, all revenues and expenses
are separately listed and “income before income taxes” is computed in a single
step as total expenses are deducted from total revenues. However, the Toys “R”
Us multistep income statement provides both gross profit and operating in-
come/(loss) subtotals.
Note that Shaw Industries has a number of different nonrecurring items in
its income statements. While they vary in size, the following would normally be
considered to be nonrecurring: charges related to residential retail opera
tions,
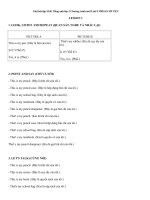
EXHIBIT 2.4 Consolidated single-step statements of income: Shaw
Industries Inc. (in thousands).
Year Ended
Jan. 3 Jan. 2 Jan. 1
1998 1999 2000
Net sales $3,575,774 $3,542,202 $4,107,736
Cost of sales $2,680,472 $2,642,453 $3,028,248
Selling, general and administrative 722,590 620,878 627,075
Charge to record loss on sale of residential
retail operations, store closing costs and
write-down of certain assets — 132,303 4,061
Charge to record plant closing costs — — 1,834
Pre-opening expenses 3,953 — —
Charge to record store closing costs 36,787 — —
Write-down of U.K. assets 47,952 — —
Interest, net 60,769 62,553 62,812
Loss on sale of equity securities — 22,247 —
Other expense (income), net (7,032) 4,676 1,319
Income before income taxes 30,283 57,092 382,387
Provision for income taxes 5,586 38,407 157,361
Income before equity in income of joint ventures 24,697 18,685 225,026
Equity in income of joint ventures 4,262 1,947 2,925
Net income $ 28,959 $ 20,632 $ 227,951
Note: Per share amounts omitted.
SOURCE
: Shaw Industries Inc., annual report, January 2000, 24.
42
Understanding the Numbers
plant closing costs, record-store closing costs, write-down of U.K. assets, the
loss on sale of equity investments, and the preopening expenses.
There will usually be other nonrecurring items lurking in other statements
or footnotes. Note the approximately $12-million change in the Other expense
(income) net balance for the year ending January 2, 1999, compared to the year
ending January 3, 1998. Also, there must be something unusual about income
taxes in the year ending January 3, 1998. The effective tax rate ($5,586,000 di-
vided by $30,283,000) is only about 18%, well below the 35% statutory federal
tax rate for large companies. By contrast, the effective tax rate ($38,407,000 di-
vided by $57,092,000) for the year ending January 2, 1999, is about 67%.
Nonrecurring Items Located in Income
from Continuing Operations
Whether a single- or multistep format is used, the composition of income from
continuing operations is the same. It includes all items of revenue, gain, ex-
pense, and loss except those (1) identified with discontinued operations, (2)
meeting the definition of extraordinary items, and (3) resulting from the cu-
mulative effect of changes in accounting principles. Because income from con-
tinuing operations excludes only these three items, it follows that all other
nonrecurring items of revenues or gains and expenses or losses are included in
this key profit subtotal.
EXHIBIT 2.5 Consolidated multi-step statements of earnings:
Toys “R” Us Inc. (in millions).
Year Ended
Jan. 31 Jan. 30 Jan. 29
1998 1999 2000
Net sales $11,038 $11,170 $11,862
Cost of sales 7,710 8,191 8,321
Gross Profit 3,328 2,979 3,541
Selling, general and administrative expenses 2,231 2,443 2,743
Depreciation, amortization and asset write-offs 253 255 278
Restructuring charge — 294 —
Total Operating Expenses 2,484 2,992 3,021
Operating Income/(Loss) 844 (13) 520
Interest expense 85 102 91
Interest and other income (13) (9) (11)
Interest Expense, Net 72 93 80
Earnings/(loss) before income taxes 772 (106) 440
Income taxes 282 26 161
Net earnings/(loss) $ 490 $ (132) $ 279
Note: Per share amounts omitted.
SOURCE
: Toys “R” Us Inc., annual report, January 2000, 25.