Introduction to geographic information systems 8th edition by chang solution manual
Bạn đang xem bản rút gọn của tài liệu. Xem và tải ngay bản đầy đủ của tài liệu tại đây (2.17 MB, 31 trang )
Introduction to Geographic Information Systems 8th edition by Kangtsung Chang Solution Manual
Link full download solution manual: />Link full download test bank: />
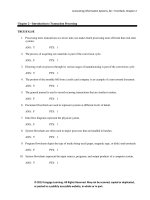
Chapter 2 Review Questions
1. Describe the three levels of approximation of the shape and size of the Earth
for GIS applications.
The simplest model for approximating the Earth is a sphere, which is typically used in
discussing map projections. But the Earth is wider along the equator than between the
poles. Therefore a better approximation to the shape of the Earth is a spheroid, also
called ellipsoid, an ellipse rotated about its minor axis. The geoid is an even closer
approximation of the Earth than a spheroid. The geoid has an irregular surface, which
is affected by irregularities in the density of the Earth’s crust and mantle.
2. Why is the datum important in GIS?
A datum is important in GIS because it serves as the reference or base for calculating
the geographic coordinates of a location.
3. Describe two common datums used in the United States.
The first common datum used in the United States is NAD27 (North American Datum
of 1927), which is a local datum based on the Clarke 1866 ellipsoid, a
ground-measured spheroid. The second common datum is NAD83 (North American
Datum of 1983), an Earth-centered or geocentered datum, based on the GRS80
(Geodetic Reference System 1980) ellipsoid.
4. Pick up a USGS quadrangle map of your area. Examine the information on
the map margin. If the datum is changed from NAD27 to NAD83, what is the
expected horizontal shift?
[The expected horizontal shift is listed on the lower margin of a USGS quadrangle
map.]
5. Go to the NGS-CORS website ( How many
continuously operating reference stations do you have in your state? Use the
links at the website to learn more about CORS.
[Go to the above website, click a state on the map, and see how many continuously
operating reference stations are within the state.] Surveyors, GIS professionals,
engineers, scientists, and others can apply CORS data to position points at which GPS
data have been collected. The CORS system enables positioning accuracies that
approach a few centimeters relative to the National Spatial Reference System, both
horizontally and vertically.
6. Explain the importance of map projection.
A map projection offers a couple of advantages. First, a map projection allows us to
use two-dimensional maps, either paper or digital, instead of a globe. Second, a map
projection allows us to work with plane or projected coordinates rather than longitude
and latitude values. Computations with geographic coordinates are more complex.
7. Describe the four types of map projections by the preserved property.
A conformal projection preserves local angles and shapes. An equivalent projection
represents areas in correct relative size. An equidistant projection maintains
consistency of scale along certain lines. And an azimuthal projection retains certain
accurate directions.
8. Describe the three types of map projections by the projection or developable
surface.
A cylindrical projection uses a cylinder as the projection or developable surface, a
conic projection uses a cone, and an azimuthal projection uses a plane.
9. Explain the difference between the standard line and the central line.
A standard line refers to the line of tangency between the projection surface and the
reference globe. In other words, there is no projection distortion along a standard line.
The central lines (i.e., the central parallel and meridian) define the center of a map
projection.
10. How is the scale factor related to the principal scale?
The scale factor is defined as the ratio of the local scale to the principal scale. In other
words, the scale factor is the normalized local scale.
11. Name two commonly used projected coordinate systems that are based on the
transverse Mercator projection.
They are the Universal Transverse Mercator (UTM) grid system and the State Plane
Coordinate (SPC) system.
12. Google the GIS data clearinghouse for your state. Go to the clearinghouse
website. Does the website use a common coordinate system for the statewide data
sets? If so, what is the coordinate system? What are the parameters values for
the coordinate system? And, is the coordinate system based on NAD27 or
NAD83?
[The coordinate system information is typically included on the clearinghouse page
for data download.]
13. Explain how a UTM zone is defined in terms of its central meridian, standard
meridian, and scale factor.
A UTM zone is mapped onto a secant case transverse Mercator projection, with a
scale factor of 0.9996 at the central meridian. The standard meridians are 180
kilometers to the east and west of the central meridian.
14. Which UTM zone are you in? Where is the central meridian of the UTM
zone?
[The answer can be found on the margin of a 1:24,000-scale USGS topographic map.
It may also be available in the download information of the clearinghouse for your
area. Figure 2.12 in the text can also provide the answer, but it is not as clear as on a
USGS topographic map.]
15. How many SPC zones does your state have? What map projections are the
SPC zones based on?
[Information on the SPC zones is available on the USGS topographic maps. It may
also be available in the download information of the clearinghouse for your area.]
16. Describe how on-the-fly projection works.
A GIS package, if it offers on-the-fly projection, can use the projection files available
with the data sets and automatically convert the data sets to a common coordinate
system. This common coordinate system is by default the coordinate system of the
first data set in display.
Chapter 2
Q1. Summarize in your own words the steps you have followed to complete Task 1.
Task 1 involves two steps. First, because idll.shp has an assumed coordinate system,
the Define Projection tool is used to define its geographic coordinate system. Second,
the Project tool is used to project idll.shp from a geographic coordinate system to a
projected coordinate system (IDTM).
Q2. Describe in your own words what you have done in Step 1.
Step 1 imported the coordinate system of idll.shp to be stationsll.shp’s coordinate
system.
Q3. You did not have to ask for a geographic transformation in Step 2. Why?
A geographic transformation was not necessary because in Step 1 snow.txt had already
been projected onto NAD83.
Q4. Can you use Import instead of Select in step 3? If yes, how?
Yes, Import can be used instead of Select. Import the coordinate system of
snowutm83.shp to be the coordinate system of idutm83.shp.
Chapter 2 Coordinate Systems
2.1 Geographic Coordinate System
2.1.1 Approximation of the Earth
2.1.2 Datum
Box 2.1 Datum Shift in Australia and New Zealand
2.2 Map Projections
2.2.1 Types of Map Projections
Box 2.2 How to Measure Distances on the Earth’s Surface
2.2.2 Map Projection Parameters
2.3 Commonly Used Map Projections
2.3.1 Transverse Mercator
2.3.2 Lambert Conformal Conic
2.3.3 Albers Equal-Area Conic
2.3.4 Equidistant Conic
2.3.5 Web Mercator
2.4 Projected Coordinate Systems
Box 2.3 Map Scale
2.4.1 The Universal Transverse Mercator (UTM) Grid System
2.4.2 The Universal Polar Stereographic (UPS) Grid System
2.4.3 The State Plane Coordinate (SPC) System
2.4.4 The Public Land Survey System (PLSS)
2.5 Working with Coordinate Systems in GIS
2.5.1 Projection File
2.5.2 Predefined Coordinate Systems
Box 2.4 A Projection File Example
2.5.3 On-the-Fly Projection
Box 2.5 GIS Tools for Working with Coordinate Systems
Key Concepts and Terms
Review Questions
Applications: Coordinate Systems
Task 1: Project from a Geographic to a Projected Coordinate System
Task 2: Import a Coordinate System
Task 3: Project by Using a Predefined Coordinate System
Task 4: Reproject a Coordinate System
Challenge Task
References
Coordinate System
Two map layers are not going to register
spatially unless they are based on the same
coordinate system.
Figure 2.1
The top map shows the
interstate highways in
Idaho and Montana based
on different coordinate
systems. The bottom map
shows the connected
interstate networks based
on the same coordinate
system.
Geographic Coordinate System
The geographic coordinate system is the location reference
system for locating spatial features on the Earth’s surface.
The geographic coordinate system is defined by longitude
and latitude.
Figure 2.2
The geographic coordinate system.
Figure 2.3
A longitude reading at X is represented by a on the left,
and a latitude reading at Y is represented by b on the
right. Both longitude and latitude readings are angular
measures.
Approximation of the Earth
The simplest model is a sphere, which is typically used in
discussing map projections.
But the Earth is not a perfect sphere: the Earth is wider along
the equator than between the poles. Therefore a better
approximation to the shape of the Earth is a spheroid, also called
ellipsoid, an ellipse rotated about its minor axis.
Figure 2.4
The flattening is based on the difference between
the semimajor axis a and the semiminor axis b.
Datum
A datum is a mathematical model of the Earth, which
serves as the reference or base for calculating the
geographic coordinates in the case of a horizontal
datum and for calculating elevations in the case of a
vertical datum.
A shift of the datum will result in the shift of positions
of points.
Figure 2.5
The isolines show the magnitudes of the horizontal shift from NAD27 to
NAD83 in meters. See text for the definition of the horizontal shift. (By
permission of the National Geodetic Survey.)
Map Projection
A map projection transforms the geographic coordinates on
an ellipsoid into locations on a plane. The outcome of this
transformation process is a systematic arrangement of
parallels and meridians on a flat surface.
Cartographers group map projections by the preserved
property into conformal, equal area or equivalent, equidistant,
and azimuthal or true direction.
Cartographers also use a geometric object (a cylinder, cone,
or plane) and a globe (i.e., a sphere) to illustrate how to
construct a map projection.
Figure 2.6
Case and projection.
Figure 2.7
Aspect and
projection.
Map Projection Parameters
A map projection is defined by its parameters.
Typically, a map projection has five or more
parameters, including standard lines (standard
parallels and standard meridians), principal scale,
scale factor, central lines, false easting, and false
northing.
Figure 2.8
The central meridian in this secant case transverse Mercator projection
has a scale factor of 0.9996. The two standard lines on either side of the
central meridian have a scale factor of 1.0.
Figure 2.9
The central parallel and the central meridian divide a map projection into four
quadrants. Points within the NE quadrant have positive x- and y-coordinates, points
within the NW quadrant have negative x-coordinates and positive y-coordinates,
points within the SE quadrant have positive x-coordinates and negative ycoordinates, and points within the SW quadrant have negative x- and y-coordinates.
The purpose of having a false origin is to place all points within the NE quadrant.
Commonly Used Map Projections
1. Transverse Mercator
2. Lambert conformal conic
3. Albers equal-area conic
4. Equidistant conic
5. Web Mercator
Figure 2.10
The Mercator and the transverse Mercator projection of the United States. For both
projections, the central meridian is 90°W and the latitude of true scale is the equator.
Figure 2.11
The Lambert conformal conic projection of the conterminous United States.
The central meridian is 96°W, the two standard parallels are 33°N and 45°N,
and the latitude of projection’s origin is 39°N.
Projected Coordinate Systems
The Universal Transverse Mercator (UTM)
grid system
The Universal Polar Stereographic (UPS)
grid system
The State Plane Coordinate (SPC) System
The Public Land Survey System (PLSS)