link full download test bank for statistics for business and economics student value edition 12th edition by mcclave
Bạn đang xem bản rút gọn của tài liệu. Xem và tải ngay bản đầy đủ của tài liệu tại đây (888.24 KB, 82 trang )
Test Bank for Statistics for Business and Economics
Student Value Edition 12th Edition by McClave
MULTIPLE CHOICE. Choose the one alternative that best completes the statement or answers the
question.
Solve the problem.
1) In an eye color study, 25 out of 50 people in the sample had brown eyes. In this situation, what
1)
does the number .50 represent?
A) a class relative frequency
B) a class
C) a class percentage
D) a class frequency
Answer: A
2) What class percentage corresponds to a class relative frequency of .37?
A) 63%
B) .63% C) .37%
2)
D) 37%
Answer: D
SHORT ANSWER. Write the word or phrase that best completes each statement or answers the question.
3) A sample of 100 e-mail users were asked whether their primary e-mail account was a free 3) account,
an institutional (school or work) account, or an account that they pay for
personally. Identify the classes for the resulting data.
Answer: free account, institutional account, account paid for personally
MULTIPLE CHOICE. Choose the one alternative that best completes the statement or answers the
question.
4) What number is missing from the table?
Grades
on Test
4)
Relative
Frequency
Frequency
A
6
.24
B
7
C
9
.36
D
2
.08
F
1
.04
A) .07
B) .72
C) .70
D) .28
Answer: D
5) What number is missing from the table?
Year in
College
5)
Relative
Frequency Frequency
Freshman
600
.30
Sophomore
560
.28
Junior
Senior
A) 440
.22
400
.20
B) 520
C) 480
Answer: A
1
D) 220
SHORT ANSWER. Write the word or phrase that best completes each statement or answers the question.
6) Complete the frequency table for the data shown below.
6)
green blue brown orange blue brown orange blue red
green blue brown green red brown blue brown blue blue
red
Color
Frequency
Green
Blue
Brown
Orange
Answer:
Color Frequency
Green
3
Blue
7
Brown
5
Orange
2
Red
3
MULTIPLE CHOICE. Choose the one alternative that best completes the statement or answers the question.
Answer the question True or False.
7) A frequency table displays the proportion of observations falling into each class.
A) True
B) False
Answer: B
2
7)
Solve the problem.
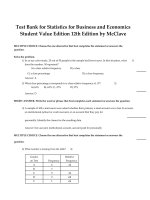
8) 260 randomly sampled college students were asked, among other things, to state their year in school
(freshman, sophomore, junior, or senior). The responses are shown in the bar graph below.
How many of the students who responded would be classified as upperclassmen (e.g.,
8)
juniors or seniors)?
A) Approximately 100
B) Approximately 125
C) Approximately 25
D) Approximately 10
Answer: B
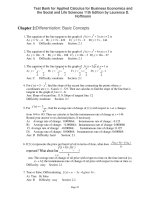
9)
9)
3
The manager of a store conducted a customer survey to determine why customers shopped at
the store. The results are shown in the figure. What proportion of customers responded that
merchandise was the reason they shopped at the store?
2
A)
1
B) 30
C)
7
3
D)
2
7
Answer: D
10)
10)
The bar graph shows the political affiliation of 1000 registered U.S. voters. What percentage of
the voters belonged to one of the traditional two parties (Democratic or Republican)?
A) 35%
B) 40%
C) 75%
Answer: C
4
D) 25%
SHORT ANSWER. Write the word or phrase that best completes each statement or answers the question.
The data
11)
below
show the
types of
medals
won by
athletes
represent
ing the
United
States in
11)
the Winter Olympics.
gold gold silver gold bronze silver silver bronze gold silver silver bronze
silver gold
gold
silver
silver
bronze
gold
gold
bronze
bronze
a.
bronze
gold
Construct a frequency table for the data.
b. Construct a relative frequency table for the data.
c.
Construct a frequency bar graph for the data.
Answer: a.
Medal
Frequency
Gold
9
Silver
9
Bronze
7
b.
Medal
Relative
Frequency
5
silver
Gold
.36
Silver
.36
Bronze
.28
c.
MULTIPLE
completes the
CHOICE. Choose the one alternative that best
statement or answers the question.
Answer the
question True or False.
12)
A) True
The bars
in a bar
graph
can be
arranged
by height
in
ascendin
g order
from left
to right.
12)
B) False
Answer: A
Either
vertical
or
horizonta
l bars can
be used
when
construct
ing a bar
graph.
13)
13)
A) True
B) False
Answer: A
6
Solve the problem.
14)
14)
The pie chart shows the classifications of students in a statistics class.
What percentage of the class consists of freshman, sophomores, and juniors?
A) 54%
B) 44%
C) 86%
Answer: C
15)
D) 14%
One of
the
questions
posed to
a sample
of 286
incoming
freshmen
at a large
public
university
was,
15)
"Do you have any tattoos?" Their responses are shown below in the pie chart. Please note that the
values shown represent the number of responses in each category.
7
Based on the responses shown in the pie chart, what percentage of the freshmen responded with
"Yes?"
A) 26.6%
B) 76
C) 73.4%
D) 76%
Answer: A
SHORT ANSWER. Write the word or phrase that best completes each statement or answers the question.
16)
The table
shows the
number
of each
type of
book
found at
an online
auction
site
during a
16)
recent search.
Type of Book
Number
Children's
51,033
Fiction
141,114
Nonfiction
253,074
Educational
67,252
8
a.
Construct a relative frequency table for the book data.
b. Construct a pie chart for the book data.
Answer: a.
Type of Book
Relative
Frequency
Children's
.10
Fiction
.28
Nonfiction
.49
Educational
.13
b.
MULTIPLE
alternative that
answers the
CHOICE. Choose the one
best completes the statement or
question.
Answer the
question True or False.
17)
If 25% of
your
statistics
class is
sophomo
res, then
in a pie
chart
represent
ing
classificat
ions of
the
17)
students in your statistics class the slice assigned to sophomores is 90°.
A) True
B) False
Answer: A
9
The slices
of a pie
chart
must be
arranged
from
largest to
smallest
in a
clockwis
e
direction.
18)
18)
A) True
B) False
Answer: B
SHORT ANSWER. Write the word or phrase that best completes each statement or answers the question.
Solve the problem.
What
19)
character
istic of a
Pareto
diagram
distingui
shes it
from
other bar
graphs?
19)
Answer: In a Pareto diagram, the bars are arranged by height in a descending order from left
to right.
20)
The table
shows the
number
of each
type of
car sold
in June.
20)
Car
Number
10
compact
7,204
sedan
9,089
small SUV
20,418
large SUV
13,691
minivan
15,837
truck
15,350
Total
81,589
the
a.
Construct a relative frequency table for the car sales.
b.
Construct a Pareto diagram for the car sales using the class percentages as
heights of the bars.
Answer: a.
Car
Relative
Frequency
compact
0.09
sedan
0.11
small SUV
0.25
large SUV
0.17
minivan
0.19
truck
0.19
b.
MULTIPLE
the one
best completes
answers the
CHOICE. Choose
alternative that
the statement or
question.
Answer the
False.
question True or
21)
11
Class
relative
frequenci
es must
be used,
rather
than
class
frequenci
es or
class
percenta
ges,
when
21)
constructing a Pareto diagram.
A) True
B) False
Answer: B
A Pareto
diagram
is a pie
chart
where
the slices
are
arranged
from
largest to
smallest
in a
22)
22)
counterclockwise direction.
A) True
B) False
Answer: B
SHORT ANSWER. Write the word or phrase that best completes each statement or answers the question.
Solve the problem.
23)
An
annual
survey
sent to
retail
store
manager
s
12
containe
d the
question
"Did
your
store
23)
suffer any losses due to employee theft?" The responses are summarized in the table for two
years. Compare the responses for the two years using side-by-side bar charts. What
inferences can be made from the charts?
Employee
Percentage Percentage
Theft
in year 1
in year 2
Yes
34
23
No
51
68
Don't
know
15
9
Totals
100
100
Answer:
Losses due to employee theft have decreased from year 1 to year 2.
MULTIPLE CHOICE. Choose the one alternative that best completes the statement or answers the question.
24)
The
payroll
amounts
for all
teams in
an
internatio
nal
hockey
league
13
are
shown
below
using a
24)
graphical technique from chapter 2 of the text. How many of the hockey team payrolls
exceeded $20 million (Note: Assume that no payroll was exactly $20 million)?
A) 23 teams
B) 10 teams
C) 8 teams
D) 18 teams
Answer: A
SHORT ANSWER. Write the word or phrase that best completes each statement or answers the question.
25)
The data
show the
total
number
of medals
(gold,
silver,
and
bronze)
won by
each
country
25)
winning at least one gold medal in the Winter Olympics.
1
2
3
3
4
9
11 14 14 19 22 23 24
a.
9
11 11
25 29
Complete the class frequency table for the data.
Total Medals
Frequency
14
1-5
6-10
11-15
16-20
21-25
26-30
b. Using the classes from the frequency table, construct a histogram for the data.
15
Answer: a.
25)
Total Medals
Frequency
1-5
5
6-10
2
11-15
5
16-20
1
21-25
4
26-30
1
b.
26)
The total
points
scored by
a
basketball
team for
each
game
during its
last
season
have been
26)
summariz
ed in the
table
below.
Score
Frequency
a.
41-60
3
61-80
8
81-100
12
101-120
7
Explain why you cannot use the information in the table to construct a stem-and-
leaf display for the data.
b. Construct a histogram for the scores.
Answer: a. The exact scores would be needed to construct a stem-and-leaf display but the exact
scores are not available in the table given.
b.
11
MULTIPLE
best completes
CHOICE. Choose the one alternative that
the statement or answers the question.
Answer the
question True or False.
27) All class intervals in a histogram have the same width.
A) True
B) False
Answer: A
27)
28) A histogram can be constructed using either class frequencies or class relative frequencies as the
heights of the bars.
A) True
B) False
Answer: A
28)
29) The bars in a histogram should be arranged by height in descending order from left to right.
A) True
B) False
Answer: B
29)
Solve the problem.
30) A survey was conducted to determine how people feel about the quality of programming available
on television. Respondents were asked to rate the overall quality from 0 (no quality at all) to 100
(extremely good quality). The stem-and-leaf display of the data is shown below.
17
30)
Stem Leaf
316
4 034
78999
5 011 2345
6 1256 6
7 14
8
9 5
as very
A) 4%
B) 5%
What percentage of the respondents rated overall television quality
good (regarded as
ratings of 80 and above)?
C) 20% D) 1%
Answer: A
31) 252 randomly sampled college students were asked, among other things, to estimate their college
31)
grade point average (GPA). The responses are shown in the stem-and-leaf plot shown below.
Notice
that a GPA of 3.65 would be indicated with a stem of 36 and a leaf of 5 in the plot. How
many
of the students who responded had GPA's that exceeded 3.55?
Stem and Leaf Plot of GPA
Leaf Digit Unit = 0.01
Minimum 1.9900
19 9 represents 1.99
Median 3.1050
Maximum 4.0000
1
Stem
19
5
20
0668
6
21
0
11 22
33 25
Leaves
9
05567
15 23
0113
20 24
0000000000067
46 26
0000005577789
61 27
000000134455578
79 28
000000000144667799
88 29
002356777
116 30
0000000000000000000011344559
(19) 31
0000000000112235666
117 32
0000000000000000345568
95 33
000000000025557
80 34
0000000000000000333444566677889
49 35
000003355566677899
31 36
000005
25 37
022235588899
13 38
00002579
5
39
7
4
40
0000
252 cases included
18
00005
A) 31
B) 19
C) 39
D) 49
Answer: C
SHORT ANSWER. Write the word or phrase that best completes each statement or answers the question.
32) The scores for a statistics test are as follows:
87 76 92 77 92
96 88 85
66 89
79 96 50 98 83
88 82 51
10 69
32)
Create a stem-and-leaf display for the data.
Answe r:
Stem
1
2
3
4
Leaf
0
5
6
7
8
9
01
69
679
23578
89
22668
MULTIPLE CHOICE. Choose the one alternative that best completes the statement or answers the question.
Answer the question True or False.
33)For large data sets, a stem-and-leaf display is a better choice than a histogram.
A) True
B) False
19
33)
Answer: B
Solve the problem.
34 A dot plot of the speeds of a sample of 50 cars passing a policeman with a radar gun is shown 34)
below.
What proportion
of the motorists
were driving
above the posted
speed limit of 55
miles per hour?
A) 0.64
B) 7
C) 0.50 D) 0.14
Answer: C
35 Which of the graphical techniques below can be used to summarize qualitative data? 35)
A) stem-and-leaf plot
B) dot plot
C) box plot
D) bar graph
36) Parking at a university has become a problem. University administrators are interested in
36)
determining the average time it takes a student to find a parking spot. An administrator
inconspicuously followed 90 students and recorded how long it took each of them to find a parking
spot. Which of the following types of graphs should not be used to display information concerning the
students parking times?
A) histogram
B) stem-and-leaf display
C) pie chart
D) box plot
Answer: C
37) Fill in the blank. One advantage of the __________ is that the actual data values are retained in the
37)
graphical summarization of the data.
A) pie chart
B) stem-and-leaf plot
C) histogram
Answer: B
38) The amount spent on textbooks for the fall term was recorded for a sample of five university
38)
students - $400, $350, $600, $525, and $450. Calculate the value of the sample mean for the data.
A) $465
B) $450 C) $400 D) $600
Answer: A
39) The amount spent on textbooks for the fall term was recorded for a sample of five university
39)
students - $400, $350, $600, $525, and $450. Calculate the value of the sample median for the data.
A) $600
B) $465 C) $400 D) $450
20
Answer: D
40) A sociologist recently conducted a survey of senior citizens who have net worths too high to qualify
40)
for Medicaid but have no private health insurance. The ages of the 25 uninsured senior citizens were
as follows:
72 77
70
80 90
73 96
80
66 85
67
72
85
74 77
64
91
79
68 86
78
65
C) 78
D) 77.5
93
Find the median of the observations.
A) 74
B) 77
Answer: B
41) The scores for a statistics test are as follows:
75 76 62 77 70 92 61 85 95 89
41)
79 67 50
60 85 65 85 73 18 82 Compute the mean
score.
A) 75.50
B) 72.30
C) 75
Answer: B
21
D) 63.25
69 94
42) A shoe retailer keeps track of all types of information about sales of newly released shoe styles. One 42)
newly released style was marketed to tall people. Listed below are the shoe sizes of 12 randomly selected
customers who purchased the new style. Find the mode of the shoe sizes.
1
911
12
11
2
1
2
1 8 10 8 11
2
10
11
910
A) 9
B) 10 C) 11
D) 10
Answer: C
SHORT ANSWER. Write the word or phrase that best completes each statement or answers the question.
43) Each year advertisers spend billions of dollars purchasing commercial time on network
television. In the first 6 months of one year, advertisers spent $1.1 billion. Who were the
largest spenders? In a recent article, the top 10 leading spenders and how much each spent
(in million of dollars) were listed:
Company A $71
Company B 63.7
Company C 54.5
Company D 54.1
Company E 28.5
Company F$25.9
Company G 24.6
Company H 23.1
Company I
23.6
Company J
19.8
Calculate the mean and median for the data.
Answer: The mean of the data is x =
x
n
71 + 63.7 + 54.5 + 54.1 + 28.5 + 25.9 + 24.6 + 23.1 + 23.6 + 19.8
10
= 388.810
= 38.88
$38.88 million
The median is the average of the middle two observations.
43)
28.5
+
M=
25.9
= 27.20
$27.20 million
16
44) The data show the total number of medals (gold, silver, and bronze) won by each country
least one gold medal in the Winter Olympics. Find the mean, median, and
mode of the numbers of
medals won by these countries.
1
2
3
3
4
9
9
11
11
11
14
14
19
22
23
24
25
29
Answer: The mean is the sum of the numbers divided by 18:
1 + 2 + 3 + 3 + 4 + 9 + 9 + 11 + 11 + 11 + 14 + 14 + 19 + 22 + 23 + 24 + 25 + 29
18
=
23418 = 13 medals.
11
The median is the mean of the two middle numbers:
+
11
= 11 medals.
The mode is the most frequent number of medals: 11 medals.
45) Calculate the mean of a sample for which x = 196 and n = 8.
Answer: The mean is divided by n:
x
= 196 = 24.5.
n
46) The calculator screens summarize a data set.
8
46)
23
45)
44) winning at
a. How many data items are in the set?
b. What is the sum of the data?
c. Identify the mean, median, and mode, if possible.
Answer: a. n = 21
b. x = 1679
c. mean: x 79.95; median: Med=82; mode: not possible
MULTIPLE CHOICE. Choose the one alternative that best completes the statement or answers the question.
47) At the U.S. Open Tennis Championship a statistician keeps track of every serve that a player hits
47)
during the tournament. The statistician reported that the mean serve speed of a particular player was
96 miles per hour. Suppose that the statistician indicated that the serve speed distribution was skewed
to the left. Which of the following values is most likely the value of the median serve
A) 91 mph
B) 96 mph
C) 101 mph
speed?
D) 86 mph
48) The amount spent on textbooks for the fall term was recorded for a sample of five hundred
48) university
students. The mean expenditure was calculated to be $500 and the median expenditure
was calculated to be $425. Which of the following interpretations of the mean is correct?
A) The average of the textbook costs sampled was $500
B) 50% of the students sampled had textbook costs equal to $500
C) The most frequently occurring textbook cost in the sample was $500
D) 50% of the students sampled had textbook costs that were less than $500
Answer: A
49) The amount spent on textbooks for the fall term was recorded for a sample of five hundred
49)
university students. The mean expenditure was calculated to be $500 and the median expenditure was
calculated to be $425. Which of the following interpretations of the median is correct?
A) 50% of the students sampled had textbook costs that were less than $425
B) The most frequently occurring textbook cost in the sample was $425
C) The average of
the textbook costs sampled was $425
D) 50% of the students sampled had textbook costs equal to $425
Answer: A
50)
D
ur
in
g
o
ne
re