Solutions manual for entrepreneurial finance 5th edition by leach and melicher
Bạn đang xem bản rút gọn của tài liệu. Xem và tải ngay bản đầy đủ của tài liệu tại đây (572.95 KB, 20 trang )
Solutions Manual for Entrepreneurial Finance 5th
Edition by J.Chris Leach and Ronald W.Melicher
Link full download Test Bank:
/>Link full download Solutions Manual:
/>
Chapter 2
DEVELOPING THE BUSINESS IDEA
FOCUS
In this chapter we examine how one can move from an idea to a determination of the feasibility
of the related business opportunity. We present an opportunity screening system to aid in
determining whether an idea should be discarded or pursued. We conclude the chapter with an
overview of a business plan.
LEARNING OBJECTIVES
1.
2.
3.
4.
5.
Describe the process of moving from an idea to a business model/plan.
Understand the components of a sound business model.
Identify some of the best practices for high growth, high performance firms.
Understand the importance of timing in venture success.
Describe the use of a Strength-Weakness-Opportunity-Threats (SWOT) analysis as an
initial “litmus test.”
6. Identify the types of questions that a reasonable feasibility assessment addresses.
7. Identify quantitative criteria that assist in assessing a new venture’s feasibility and its
ability to attract external financing.
8. Describe the primary components of a typical business plan.
CHAPTER OUTLINE
2.1 PROCESS FOR INDENTIFYING BUSINESS OPPORTUNITIES
2.2 TO BE SUCCESSFUL YOU MUST HAVE A SOUND BUSINESS MODEL
A. Component1: The Plan must Generate Revenues
B. Component 2: The Plan must Make Profits
C. Component 3: The Plan must Produce Free Cash Flows
2.3 LEARN FROM THE BEST PRACTICES OF SUCCESSFUL ENTREPRENEURIAL
VENTURES
A. Best Marketing Practices
B. Best Financial Practices
C. Best Management Practices
D. Best Production or Operations Practices are also Important
2.4 TIME-TO-MARKET AND OTHER TIMING IMPLICATIONS
2.5
2.6
INITIAL “LITMUS TEST” FOR EVALUATING THE BUSINESS FEASIBILITY OF
AN IDEA
SCREENING VENTURE OPPORTUNITIES
A. An Interview with the Founder (Entrepreneur) and Management Team: Qualitative
Screening
B. Scoring a Prospective New Venture: Quantitative Screening
C. Industry/Market Considerations
D. Pricing/Profitability Considerations
17
E. Financial/Harvest Considerations
F. Management Team Considerations
G. Opportunity-Screening Caveats
2.7 KEY ELEMENTS OF A BUSINESS PLAN
A. Cover Page, Confidentiality Statement, and Table of Contents
B. Executive Summary
C. Business Description
D. Marketing Plan and Strategy
E. Operations and Support
F. Management Team
G. Financial Plans and Projections
H. Risks and Opportunities
I. Business Plan Appendix
SUMMARY
APPENDIX A:
Applying the VOS IndicatorTM: An Example
CSC Profile
Market Opportunity
Products
Management Team
CSC Assessment
DISCUSSION QUESTIONS AND ANSWERS
1.
How do we know whether an idea has the potential to become a viable business
opportunity?
The answer is that we don’t know with absolute certainty. While there is no infallible
screening process, there are tools and techniques that can help examine similarities between a
new idea and previously successful ventures.
2.
Identify three types of startup firms.
Salary-replacement firms are firms that provide their owners with income levels comparable
to what they could have earned working for much larger firms.
Lifestyle firms are firms that allow owners to pursue specific lifestyles while being paid for
doing what they like to do.
Entrepreneurial ventures are entrepreneurial firms that are flows and performance oriented
as reflected in rapid value creation over time.
3.
Briefly describe the process involved in moving from an idea to a business plan.
Refer to Figure 2.1 “From Entrepreneurial Opportunities to New Businesses, Products, or
Services.” Start with “ideas,” then assess the “feasibility” (finding an unfilled need), and
then develop a “business plan.”
4.
What are the components of a sound business model?
The components of a sound business model are the abilities to generate revenues, create a
profit, and produce free cash flow. These components must be achieved within a reasonable
time frame as the venture progresses through the early stages of its life cycle.
5.
Describe the differences between entrepreneurial ventures and other entrepreneurial firms.
Entrepreneurial ventures are entrepreneurial firms that are flows and performance oriented as
reflected in rapid value creation over time. Such ventures strive for high growth in revenues,
profits, and cash flows. In contrast, some small businesses may have some of the trauma and
rewards of the entrepreneurial lifestyle, but remain centered on a small-scale format with
limited growth and employment opportunities.
6.
Identify some of the best marketing and management practices of high growth, high
performance firms.
Successful high-growth, high-performance firms typically sell high quality products or
provide high quality services. Such firms also generally develop and introduce new products
or services considered the top or best in their industries; they are product and service
innovation leaders. Their products typically command higher prices and profit margins. In
summary, these firms’ “marketing profiles” are characterized by high quality, innovative
leadership, and pricing power.
Best management practices include: (1) assemble a management team that is balanced in
both functional area coverage and industry/market knowledge, (2) employ a decision-making
style that is viewed as being collaborative, (3) identify and develop functional area managers
that support entrepreneurial endeavors, and (4) assemble a board of directors that is balanced
in terms of internal and external members.
7.
Describe and discuss some of the best financial practices of high growth, high performance
firms. Why is it also important to consider production or operations practices?
High-growth, high-performance firms consider their financial practices as important as their
marketing and operating functions. To this end, they plan for future growth and unexpected
contingencies that may develop as the firm operates. They prepare realistic monthly
financial plans for at least the coming year, and also may prepare annual financial plans for
the next three to five years. As rapid growth typically requires multiple rounds of financing,
successful ventures anticipate financing needs in advance and seek to obtain financing
commitments before the funds are actually needed. Financing sources that allow, whenever
possible, the entrepreneur to maintain control over the firm, are highly desirable. Successful
high growth firms devote the necessary resources and effort to manage the firm’s assets,
financial resources, and operating performance efficiently and effectively. They also
develop preliminary harvest or exit strategies and may indicate potential liquidity events in
their business plans.
It is the production or operations area that carries the responsibility of delivering high-quality
products or services on time. Customers want their products or services delivered when they are
promised. Thus, the production or operations area is equally important to successful high-growth,
high-performance firms.
8.
Time to market is generally important, but being first to market does not necessarily ensure
success. Explain.
“Time-to-market” is particularly critical when ideas involve information technology, as a few
months might determine success or failure. EBay’s rapid progression from concept to market
dominance provides an example of the advantages of acting quickly in a technology market.
“First to market,” does not always result in success, as quite often companies entering the
market later may achieve significant competitive advantages such as more efficient
production, distribution, and service, superior product design, and a more sound financial
position. The portable computer, first sold by Osborne, provides an example of a technology
product that failed to achieve success by being “first to market.”
9.
What is meant by a viable venture opportunity?
A
viable venture opportunity is one that creates or meets a customer need, provides an
initial competitive advantage, is timely in terms of time-to-market, and offers the expectation
of added value to investors.
10.
Describe how a SWOT analysis can be used to conduct a first-pass assessment of whether
an idea is likely to become a viable business opportunity.
A
SWOT analysis is an examination of strengths, weaknesses, opportunities, and threats
to determine the business opportunity viability of an idea. One typically “begins” by asking
whether there is an unfilled customer need. Other considerations that could be potential
strengths or weaknesses include: intellectual property rights, first mover, lower costs and/or
higher quality, experience/expertise, and reputation value. Areas to consider as potential
opportunities or threats include: existing competition, market size/market share potential,
substitute products or services, possibility of new technologies, recent or potential regulatory
changes, and international market possibilities.
11.
Describe the meaning of venture opportunity screening.
Venture opportunity screening is the assessment of an idea’s commercial potential to produce
revenue growth, financial performance, and value.
12.
An analogy used relating to venture opportunity screening makes reference to
“caterpillars”
and “butterflies.” Briefly describe the use of this analogy.
Caterpillars are ideas that are likely to become butterflies which are successful business or
venture opportunities.
13.
When conducting a qualitative screening of a venture opportunity, whom should you
interview? What topics should you cover?
It is most important to interview the entrepreneur or founder. You might also want to
interview the marketing manager, the operations manager, and the financial manager. In the
event that a management team is not in place at the time of the qualitative screening, the
entrepreneur or founder may have to play all of the roles.
The interviewing process with the entrepreneur should include questions aimed at
understanding the big picture. Information should be sought regarding the intended
customers, possible competition, intellectual property, challenges to be faced, etc.
The marketing manager interview seeks information on who makes the purchase decision for
the venture’s product or service, and who pays for the purchase. Others questions focus on
market size and growth, channel and distribution challenges, and marketing and promotion
needs.
The operations manager interview seeks information on the state of the idea in terms of
prototypes and whether they have been tested. One should also attempt to assess what risks
remain between now and successful market delivery and whether potential development or
production concerns exist.
The financial manager interview seeks information on what length of time is projected before
the venture will achieve breakeven, how will the venture be financed, and how much and
when will outside financing be needed?
14.
Describe the characteristics of a viable venture opportunity. What is a VOS Indicator?
A viable venture opportunity will meet a customer need, have a competitive advantage, be
able to be brought to market quickly, and offer attractive investment returns compared to the
risk associated with it. A VOS Indicator is a guide to help investors and entrepreneurs screen
business opportunities. It contains a checklist for indicating the potential attractiveness of a
proposed venture.
15.
Describe the factor categories used by venture capitalists and other venture investors when
they screen venture opportunities for the purpose of deciding to invest.
The categories used by venture investors to screen are the industry or market, pricing and
profitability, the management team, and financial harvest indicators. The market size of the
industry, now or expected in the future, is a critical factor in the likelihood that a venture can
become high growth, with potential sales or revenues of more than $100 million being
required to scoring a “high” in terms of potential attractiveness.
Profitability, indicated by the gross profit margin, is one of the most important metrics for
judging the potential for a viable business opportunity, with a large gross profit margin
providing a cushion for covering related business expenses while still providing sufficient
return for investors. In general, a gross profit margin greater than 50 percent indicates that a
venture has the potential to be a high growth, high performance opportunity. The net profit
margin may also be used to evaluate ventures, with after-tax greater margins greater than 20
percent suggesting the potential for a high growth, high performance venture.
Venture screening usually begins with an assessment of the management team’s experience
and expertise, with a high score being given to a management team having both expertise and
experience in the proposed business opportunity’s industry or market. Finally, venture
investors give high scores to entrepreneurs who have given some thought in relation to
providing investors with an exit from their venture investment.
Financial harvest indicators such as operating cash flow breakeven, free cash flow to
equity, and internal rate of return (IRR) provide indications that a venture will be able to
achieve an exit strategy, and returns to investors, in an acceptably short period of time.
16.
Describe ROA. Describe the two major ratio components that comprise the venture’s ROA
model.
The return on assets is a metric calculated by dividing the venture’s net after-tax profit by
its venture total assets and it represents a measure of the firm’s performance relative to its
invested assets. The return on assets measure can also be viewed in terms of the return on
assets (ROA) model that expresses the return on assets as the product of the net profit
margin and the assets turnover metrics or ratios. This relationship is depicted as follows:
Return on Assets = Net Profit Margin x Assets Turnover
This also can be represented as:
Net Profit/Total Assets = Net Profit/Revenues x Revenues/Total Assets.
Thus, the ROA of a venture is equal to its profit margin times its asset intensity.
17.
How do the concepts operating cash flow and free cash flow to equity differ?
Operating cash flow is a measure of the cash generated by the daily operations of selling the
company’s product or service; it represents the figure that remains after the cost of goods
sold and other business expenses (primarily general and administrative expenses along with
marketing expenses or “SG&A”) are subtracted from revenues. It approximates the
operating cash flows over a specified time period, such as a year.
Free cash flow to equity is the cash available to the entrepreneur and venture investors after
operating cash outflows, financing and tax cash flows, required investment in assets needed
to sustain the venture’s growth, and net increases in debt capital. Free cash flow to equity is
calculated as the venture’s revenues minus operating expenses, minus financing costs and tax
payments, after adjustment for changes in net working capital (NWC), physical capital
expenditures (CAPEX) needed to sustain and grow the venture, and net additional debt issues
to support the venture’s growth. In short: Free cash flow to equity = net profit
+ depreciation charges - NWC – CAPEX + net new debt.
18.
What is a business plan? Why is it important to prepare a business plan?
A business plan is a written document that describes the proposed venture in terms of the
product or service opportunity, current resources, and financial projections. More formal
business plan development is common in ventures moving from the development stage to the
startup stage. The process of business planning is beneficial to the entrepreneur, who must be
the first to believe the plan is reasonable. The entrepreneur must be convinced that starting
this business is the right thing to do personally and professionally; the business plan reflects
the excitement, opportunity, and reasonableness of the business idea to the members of the
management team, potential investors, and other stakeholders.
19.
What are the major elements of a typical business plan?
A typical business plan contains, in its Introduction, a cover page, confidentiality statement, table
of contents, and executive summary. The Business Description section presents some of the
considerations related to the venture opportunity-screening phase on industry/market factors.
The Marketing Plan and Strategy section addresses the target market and customers,
competition and market share, pricing strategy, and promotion and distribution. The
Operations and Support section discusses how production methods or services will be
delivered. The Management Team section presents the experience and expertise
characteristics of the management team. In the Financial Plans and Projections, the business
plan typically includes financial projections in the form of income statements, balance sheets,
and statements of cash flows. These projections provide the basis for how the venture is
expected to start up and operate over the next several years. The business plan should include
a discussion of possible Problems or Risks.
The Appendix should contain the detailed assumptions underlying the projected financial
statements in the Financial Plans and Projections section. It should also include a timeline
with milestones indicating the amount and size of expected financing needs.
20.
What are real options? What types of real option opportunities are available to
entrepreneurs?
Real options are real or non-financial options available to a venture’s managers as the
venture progresses through its life cycle. Examples of real options include growth options,
flexibility options, learning options, and even exit options. Growth options represent the
possibility that, if the venture’s market begins to grow rapidly, an initial toehold position in a
scalable technology or service may provide a platform for quick expansion to capture market
share. Flexibility or learning options may develop when an investment in new technology
has multiple potential applications and revenue streams. Exit options relate to the venture’s
ability to provide a return in a variety of ways other than remaining as a free-standing
venture. The venture’s intellectual property can be licensed or purchased by other firms, the
venture can be absorbed into another public or private entity or the venture can remain
independent and use its cash flow to provide a return for the investors.
21.
From the Headlines--Brooklyn Brew Shop: briefly describe how the idea of a small square
footage apartment-based brewing device became a startup enterprise.
Answers will vary: Stephen Valand and Erica Shea, after noting that home brewing in high
rent apartments would require a reduced footprint and equipment that would most likely be
visible to guests, designed their own home brewing kits and started to sell them at the
Brooklyn Flea Market. As demand grew, they introduced a higher volume kit and
established a presence in stores and on the internet. They used $10,000 in personal savings
and the revenue from the flea market sales to cover costs and growth reinvestments while
seeking startup assistance where they could find it, including a local university’s law clinic.
INTERNET ACTIVITIES
1. Access the Inc. magazine Web site at www.inc.com. Identify a list of recent articles that
relate to how business opportunities are evaluated by venture investors and/or articles
discussing why venture investors chose not to invest in potential business opportunities.
Web-researched results vary due to constant updating of the related web sites.
2. Access the Center for Business Planning Web site at www.businessplans.org. The site
provides examples of business plans prepared by MBA students from top business schools
and presented to panels of investors at recent Moot Corp. competitions hosted by the
University of Texas at Austin. Review one of the business plans. Write a brief summary
comparing the segments or elements included in the business plan to the key elements of a
typical business plan presented in the chapter.
Web-researched results vary due to constant updating of the related web sites.
3. Access the Center for business Planning Web site at: www.businessplans.org. Find the
reference to PlanWrite which is designed to help an entrepreneur to create a business plan.
Identify and briefly describe what this software product provides.
Web-researched results vary due to constant updating of the related web sites.
EXERCISES/PROBLEMS AND ANSWERS
1. [Basic Financial Ratios] A venture recorded revenues of $1 million last year and net
profit of $100,000. Total assets were $800,000 at the end of last year.
A. Calculate the venture’s net profit margin.
Net Profit Margin: net profit/revenues = $100,000/$1,000,000 = 10.0%
B. Calculate the venture’s asset turnover.
Asset Turnover: revenues/total assets = $1,000,000/$800,000 = 1.25 times
C. Calculate the venture’s return on total assets.
Return on Total Assets: net profit/total assets = $100,000/$800,000 = 12.5%
2. [Financial Ratios and Performance] Following is financial information for three ventures:
Venture XX
Venture YY
After-tax Profit Margins
5%
15%
Asset Turnover 2.0 times 1.0 times
3.0 times
A. Calculate the return on assets (ROA) for each firm.
Venture ZZ
25%
Venture XX: 5% x 2.0 = 10%
Venture YY: 15% x 1.0 = 15%
Venture ZZ: 25% x 3.0 = 75%
B. Which venture is indicative of a strong entrepreneurial venture opportunity?
Venture ZZ seems to represent a strong entrepreneurial venture opportunity based on a
very high return on assets financial measure.
C. Which venture seems to be more of a commodity type business?
Venture XX seems to be more of a commodity type of business as indicated by a
relatively low return on assets.
D. How would you place these three ventures on a graph similar to Figure 2.10?
Venture ZZ would be a Case 1 type of venture opportunity (very high profit margin).
However, Venture ZZ’s also high turnover would place the venture above the ROA curve
(with an ROA of 75% as calculated in Part A.). Venture XX would be a Case 2 type of
venture opportunity (low profit margin with a moderate asset turnover) resulting in a ROA
of 10% (see Part A). Venture YY would fall between the other two ventures (a relatively
high profit margin and a low asset turnover ratio) resulting in an ROA of 15% (see Part A).
E. Use the information in Figure 2.9 relating to pricing/profitability, and “score” each
venture in terms of potential attractiveness.
Pricing/Profitability
Gross margins
After-tax margins
Asset intensity
Return on assets
Total points
Venture XX
NA
1
2
2
5
Venture YY
NA
2
2
2
6
Venture ZZ
NA
3
2
3
8
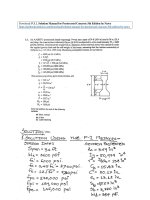
3. [Revenues, Costs, and Profits] In early 2013, Jennifer (Jen) Liu and Larry Mestas founded
Jen and Larry’s Frozen Yogurt Company, which was based on the idea of applying the
microbrew or microbatch strategy to the production and sale of frozen yogurt. They began
producing small quantities of unique flavors and blends in limited editions. Revenues were
$600,000 in 2013 and were estimated at $1.2 million in 2014. Because Jen and Larry were
selling premium frozen yogurt containing premium ingredients, each small cup of yogurt sold
for $3 and the cost of producing the frozen yogurt averaged $1.50 per cup. Other expenses
plus taxes averaged an additional $1 per cup of frozen yogurt in 2013 and were estimated at
$1.20 per cup in 2014.
A. Determine the number of cups of frozen yogurt sold each year.
Revenue = Price per unit x units sold, and Revenue / Price per unit = units sold:
Units Sold for 2013 = 600,000/3 = 200,000 units
Units Sold for 2014 = 1,200,000/3 = 400,000 units
B. Estimate the dollar amounts of gross profit and net profit for Jen and Larry’s venture in
2013 and 2014.
2013
Revenue
COGS (Units x COGS per Unit)
Gross Profit
OE + Tax
Net Profit
$ 600,000
300,000
300,000
200,000
$100,000
2014
$ 1,200,000
600,000
600,000
480,000
$120,000
C. Calculate the gross profit margins and net profit margins in 2013 and 2014.
Gross Profit Margin = Gross Profit/Revenues
Net Profit Margin = Net Profit/Revenues
Gross Profit Margin in 2013 = Gross Profit/Sales = 300,000/600,000 = 50% Net
Profit Margin in 2013 = Net Profit/Sales = 100,000/600,000 = 16.7%
Gross Profit Margin in 2014 = Gross Profit/Sales = 600,000/1,200,000 = 50% Net
Profit Margin in 2014 = Net Profit/Sales = 120,000/1,200,000 = 10%
D. Briefly describe what has occurred between the two years.
The gross profit margins are the same in the two years because the “cost of goods sold
per unit” stays the same. However, 2014’s net profit margin declines because of the
increase in the other expenses category.
4.
[Returns on Assets] Jen and Larry’s frozen yogurt venture described in Problem 3 required
some investment in bricks and mortar. Initial specialty equipment and the renovation of an old
warehouse building in Lower Downtown, referred to as LoDo, cost $450,000 at the beginning
of 2013. At the same time, $50,000 was invested in inventories. In early 2014, an additional
$100,000 was spent on equipment to support the increased frozen yogurt sales in 2014. Use
information from Problem 3 and this problem to answer the following questions.
A. Calculate the return on assets in both 2013 and 2014.
Total Assets 2013 = Warehouse + Inventory = $450,000 + $50,000 = $500,000
Total Assets 2014 = Warehouse + Inventory + Additional Capital Expenditure
= $450,000 + $50,000 + $100,000 = $600,000
Return on Assets (ROA) = Net Profit/Total Assets
ROA for 2013 = 100,000/500,000 = 20%
ROA for 2014 = 120,000/600,000 = 20%
B. Calculate the asset intensity or asset turnover ratios for 2010 and 2011.
Asset Intensity = Assets Turnover = Revenues/Total Assets
Asset Turnover Ratio for 2013 = 600,000/500,000 = 1.20
Asset Turnover Ratio for 2014 = 1,200,000/600,000 = 2.00
C. Apply the ROA Business Model to Jen and Larry’s frozen yogurt venture.
ROA Business Model = Net Profit Margin x Asset Turnover Ratio
ROA for 2013 = 16.67% x 1.2 = 20%
ROA for 2014 = 10% x 2.0 = 20%
D. Briefly describe what has occurred between the two years.
The Returns on Assets were the same in the two years because the company’s Net Profit
Margins went down due to the increased operation expenses while Asset Intensity went
up due to additional capital expenditure on equipment.
E. Show how you would position Jen and Larry’s frozen yogurt venture in terms of the
relationship between net profit margins and asset turnovers depicted in Figure 2.10.
In relation to Figure 2.10, one should position Jen and Larry’s frozen yogurt venture in
Case 1 where the company has high profit margin and low assets turnover.
In Case 2, companies compete on price, have very low profit margin and high assets turnover.
If the company is incapable of becoming a market leader, it will be squeezed out as the industry
grows.
5.
[VOS IndicatorTM Screening] Jen Liu and Larry Mestas are seeking venture investors to help
fund the expected growth in their Frozen Yogurt venture described in Problems 3 and 4. Use
the VOS Indicator guidelines presented in Figures 2.8 and 2.9 to score Jen and Larry’s frozen
yogurt venture in terms of the items in the pricing/profitability factor category. Comment on
the likely attractiveness of this business opportunity to venture investors.
Gross Margin: 50%, 50% (“High”)
After-Tax Margin: 16.7%, 10% (“Average”)
Asset Intensity: 1.2, 2 (“Average”)
ROA: 20%, 20% (“Average”)
This is an “Average” opportunity.
6.
[Ethical Issues] Assume that you have just “run-out-of-money” and are unable to move your
“idea” from its development stage to production and the startup stage. However, you remain
convinced that with a reasonable amount of additional financial capital you will be a successful
entrepreneur. While your expectations are low, you are meeting with a loan officer of the local
bank in the hope that you can get a personal loan in order to continue your venture.
A. As you are about to enter the bank, you see a bank money bag lying on the street. No one
is
around to claim the bag. What would you do?
Many entrepreneurs state that high ethical standards are one of a venture’s most important
assets and are critical to long-term success and value. High ethical standards involve
following laws, regulations, and treating others honestly and fairly. The money, if any, in the
money bag does not belong to you—it is someone else’s property. Most people would agree
that you should turn the money bag in to the bank immediately.
It is possible, but should not be expected and thus should not be part of your decision, that
your high ethical standards might have an indirect impact on your being able to obtain a
personal loan from the bank to continue your venture.
B. Now, let’s assume that what you found lying on the street was a $100 bill. The thought
crosses your mind that it would be nice to take your significant other out for a nice
dinner— something that you have not had for several months. What would you do?
Unless you see someone drop the $100 bill it will be very difficult to identify the owner of
the bill. However, the money does not belong to you. Most people would agree that you
should not just “pocket” the $100 bill but should make an attempt to find its owner. Since
you are outside the bank, you might enter the bank, indicate that you found a $100 bill
outside the bank, and enquire whether someone has reported losing a $100 bill.
C. Now, instead of $100 you “find” a $1 bill on the street. The thought crosses your mind
that you could buy a lottery ticket with the dollar. Winning the lottery would certainly
solve all your financing needs to start and run your venture. What would you do?
When the amount of money “found” is very small, such as $1, people often behave
differently than when the amount of money is large. First, it is virtually impossible to
identify the owner unless you saw a specific person drop the $1 bill. Second, the time and
energy involved in trying to find the rightful owner likely will outweigh the value of the
money. Again, the money is not rightfully yours. Most people would probably say that if
you can’t immediately identify the rightful owner, the $1 becomes “yours.”
It is up to you to decide whether keeping the $1 bill jeopardizes your own personal high
ethical standards. Purchasing a lottery ticket with the dollar represents another personal
decision.
SUPPLEMENTAL EXERCISES/PROBLEMS AND ANSWERS
[Note: These activities are for readers with an existing understanding of financial statements (i.e.,
income statements and balance sheets). For other readers, these exercises/problems can be
worked after covering Chapter 4.]
7. [Revenues, Profits, and Assets] Refer to the information on the three ventures in Problem 2.
A. If each venture had net sales of $10 million, calculate the dollar amount of net profit and
total assets for Venture XX, Venture YY, and Venture ZZ.
Venture XX
Venture YY
Venture ZZ
Net Profit
$10,000,000 x .05 = $500,000
$10,000,000 x .25 = $2,500,000
$10,000,000 x .15 = $1,500,000
Total Assets
$10,000,000/2.0 = $5,000,000
$10,000,000/3.0 = $3,333,333
$10,000,000/1.0 = $10,000,000
B. Which venture would have the largest dollar amount of net profit?
Venture YY would have the largest net profit at $2,500,000.
C. Which venture would have to largest dollar amount of total assets?
Venture ZZ would have the largest total assets at $10,000,000.
8. [Ratio Calculations from Financial Statements] Ricardo Martinez has prepared the
following financial statement projections as part of his business plan for starting the
Martinez Products Corporation. The venture is to manufacture and sell electronic
components that make standard overhead projectors “smart.” In essence, through voice
commands a projector can be turned on or off, and the brightness of the projection altered.
This will allow the user to avoid audience annoyances associated with a bright projection
light during periods when no overhead transparency is being used. Venture investors
usually screen prospective venture opportunities in terms of projected profitability and
financial performance.
A. Use the following projected financial statements for Martinez Products and calculate
financial ratios showing the venture’s projected: (a) gross profit margin, (b) net profit
margin, (c) asset intensity, and (d) return on assets.
Gross Profit Margin = Gross Profit/Sales = 100,000/200,000 = 50%
Net Profit Margin = Net Income/Sales = 15,000/200,000 = 7.5%
Asset Intensity = Sales/Total Assets 200,000/100,000 = 2.0
Return on Assets = Net Income/Total Assets = 15,000/100,000 = 15%
B. The ratios calculated in Part A are found in the venture opportunity screening guide
discussed in the chapter. Rate the potential attractiveness of the Martinez Products
venture using the guidelines for the pricing/profitability factor category for the VOS
Indicator.
The VOS Indicator shows that three of the pricing/profitability indicators are average
while after-tax margins are low in attractiveness. The scoring suggests a low-to-average
appraisal of this venture opportunity.
__________________________________
Martinez Products Corporation
Projected Income Statement for Year 1
__________________________________
Sales
$200,000
Cost of goods sold
-100,000
Gross profit
100,000
Operating expenses
-75,000
Depreciation
-4,000
Earnings before interest & taxes
21,000
Interest
-1000
Earnings before taxes
20,000
Taxes (25%)
-5,000
Net income
$15,000
Martinez Products Corporation
Projected Balance Sheet for End of Year 1
Cash
$ 10,000
Accounts receivable
20,000
Inventories
20,000
Total current assets
50,000
Gross fixed assets
54,000
Accumulated depreciation
4000
Net fixed assets
50,000
Total assets
100,000
Accounts payable
Accrued liabilities
Bank loan
Total current liabilities
Common stock
Retained earnings
Total equity
Total liabilities & equity
$ 15,000
10,000
10,000
35,000
53,000
12,000
65,000
$100,000
9. [Ratio Calculations] Ricardo Martinez, the founder of the Martinez Products Corporation
(see Problem 8), projects sales to double to $400,000 in the second year of operation.
A. If the financial ratios calculated for Year 1 in Problem 8 remain the same in Year 2, what
would be Martinez’s dollar amount projections in his business plan for: (a) gross profit,
(b) net profit or income, and (c) total assets?
Gross Profit = Gross Profit Margin x Revenue = 50% x 400,000 = 200,000
Net Profit = Net Profit Margin x Revenue = 7.5% x 400,000 = 30,000
Total Assets = Total Revenue/Asset Intensity = 400,000/2.00 = 200,000
B. How would your answers change in Part A if the gross profit margin in the second year
is projected to be 60%, the net profit margin 25%, and the asset intensity at a 5 times
turnover?
Gross Profit = 400,000 x 60% = 240,000
Net Profit = 400,000 x 25% = 100,000
Total Assets = 400,000/5.00 = 80,000
C. Use the projected ratio information in Part B in the return on assets (ROA) model to
determine the projected percentage rate of return on assets.
ROA = Net Profit Margin x Assets Turnover = 25% x 5.00 = 125%
(Note that 125% is an unusually high ROA, but not necessarily uncommon given the
optimism in many business plans).
MINI CASE: LEARNRITE.COM CORPORATION
LearnRite.com offers e-commerce service for children’s “edutainment” products and
services. The word edutainment is used to describe software that combines “educational” and
“entertainment” components. Valuable product information and detailed editorial comments are
combined with a wide selection of products for purchase to help families make their kids’
edutainment decisions. A team of leading educators and journalists provide editorial comments
on the products sold by the firm. LearnRite targets highly educated, convenience oriented, and
value conscience families with children under the age of 12, estimated to be about 35 percent of
Internet users.
The firm’s warehouse-distribution model results in higher net margins, as well as greater
selection and convenience for customers, when compared to traditional retailers. Gross profit
margins are expected to average about 30 percent each year. Because of relatively high
marketing expenditures aimed at gaining market share, the firm is expected to suffer net losses
for two years. Marketing and other operating expenses are estimated to be $3 million in 2014
and $5 million in 2015, respectively. However, during the third year operating cash flow
breakeven should be reached. Net profit margins are expected to average 10 percent per year
beginning in year 3. Investment in bricks and mortar is largely in the form of warehouse
facilities and a computer system to handle orders and facilitate the distribution of inventories.
After considering the investment in inventories, the asset intensity or turnover is expected to
average about two times per year.
LearnRite estimates that venture investors should earn about a 40 percent average annual
compound rate of return and sees an opportunity for a possible initial public offering in about six
years. If industry consolidation occurs, a merger might occur even sooner.
The management team is headed by Srikant Kapoor who serves as President of
LearnRite.com and who personally controls about 35 percent of the ownership of the firm. Mr.
Kapoor has more than twelve years experience in high-tech industries including previous
positions with US West and Microsoft. He holds a B.S. degree in electrical engineering from an
Indian technology institute and an MBA from a major U.S. university. Sean Davidson, Director
of Technology has more than ten years of experience in software development and integration.
Walter Vu has almost ten years of experience in sales and business development in the software
industry including positions at Claris and Maxis. Mitch Feldman, Director of Marketing, was
responsible for six years for the marketing communications function and the Internet operations
of a large software company. Management strives for continual improvement in ease of user
interface, personalized services, and amount of information supplied to customers. The total
market for children’s entertainment is estimated to be $35 billion annually. Toys account for
about $20 billion in annual spending. Summer camps are estimated to generate $6 billion
annually. This is followed by children’s videos and video games at $4 billion each. Children’s
software sales currently generates about $1 billion per year in revenues and industry sales are
expected to grow at a 30 percent annual rate over the next several years. LearnRite has made
the following five-year revenue projections:
Year
Revenues ($M)
A.
2014
$1.0
2015
$9.6
2016 2017 2018
$30.1 $67.8 $121.4
Project industry sales for children’s software through the year 2018 (not 2015) based on
the information provided above.
2014
Market for Children’s Entertainment:
Toys
$20 billion
Summer camps
6 billion
Children’s videos/games 4 billion
Children’s software sales 1 billion
Miscellaneous
4 billion
Total Market
$35 billion
Children’s Software Sales Growing at 30% annually:
Year 2015 Sales = Year 2014 Sales x 1.30; and so forth.
Year
2014
2015
2016
2017
2018
B.
Industry
Forecasted Sales
$1.00 billion
1.30 billion
1.69 billion
2.20 billion
2.86 billion
Calculate the year-to-year annual sales growth rates for LearnRite. [Optional: Estimate
the compound growth rate over the 2014 through 2018 time period using a financial
calculator or computer software program.]
Growth Rate = [(Next Year Sales – Current Year Sales)/Current Year Sales] x 100
LearnRite
Year
Forecasted Sales
Sales Growth Rate
2014
$1.00 million
2015
9.60 million
860%
2016
30.10 million 214%
2017
67.80 million 125%
2018
121.40 million 79%
Arithmetic average = (860% + 214% + 125% + 79%)/4 = 320%
Compound average (using a financial calculator and point-to-point estimate
between 2014 and 2018) = 232%
[Enter: present value = -1.00; future value = 121.40; number of periods = 4;
then
solve for %i]
Geometric average = [(1 + 860) x (1 + 214) x (1 + 125) x (1 + 79)]1/4 = 208%
C.
Estimate LearnRite’s expected market share in each year based on the above data.
Note: use data for the kid’s software industry from (A) and for LearnRite from (B).
Percent of
Year
Industry Sales
2014
0.1%
2015
0.7%
2016
1.8%
2017
3.1%
2018
4.2%
D.
Estimate the firm’s net income (loss) in each of the five years.
Year
Net Income (Loss)
2014
2015
2016
2017
2018
$-2.70 million
-2.12 million
3.01 million
6.78 million
12.14 million
Year 2014: Gross profit is $0.30 million ($1.0 million sales x .30 margin) less
marketing expenses of $3 million produces a loss of $2.70 million
Year 2015: Gross profit is $2.88 million ($9.6 million sales x .30 margin) less
marketing expenses of $5 million produces a loss of $2.12 million Years
2016-2018: Net profit is 10% of that year’s forecasted sales
E.
Estimate the firm’s return on assets beginning when the net or after-tax income is
expected to be positive.
Year
2014
2015
2016
2017
2018
Millions of Dollars:
Net Income / Forecasted Assets
$-2.70
/ $0.50
=
-2.12
/
4.80
=
3.01
/
15.05
=
6.78
/
33.90
=
12.14
/
60.70
=
Return
= on Assets
-540.0%
-44.2%
20.0%
20.0%
20.0%
Note: Since the asset intensity or turnover is 2.00, total assets will be one-half of
forecasted sales. Alternatively, return on assets = net profit margin (10.0%) times
asset turnover (2.0 times) = 20.0%
F.
Score LearnRite’s venture investor attractiveness in terms of the Industry/Market Factor
Category using the VOS Indicator guide and criteria set out in Figures 2.8 and 2.9. If
you believe there are insufficient data, indicate that decision with an “N/A.”
Industry/Market
Market Size Potential: kid’s software sales = $1 billion
Venture Growth Rate: greater than 30% annually
Market Share (Year 3): 1.8% of industry sales
Entry Barriers: possible timing barriers
G.
Score
High
High
Low
Average
Score LearnRite’s venture investor attractiveness in terms of pricing/profitability factors.
Follow the instructions in Part F.
Pricing/Profitability
Gross Margins: 30% margins are estimated
After-Tax Margins: 10% margins are estimated
Asset Intensity: 2.0 asset turnovers are estimated
Return on Assets: 20% returns are estimated
Score
Average
Average
Average
Average
H.
Score LearnRite’s venture investor attractiveness in terms of financial/harvest factors.
Follow the instructions in Part F.
Financial/Harvest
Cash Flow Breakeven: estimated to occur in Year 3
Rates of Return: 20% investor returns are estimated
IPO Potential: estimated in Year 6
Founder’s Control: 35% ownership by founder
I.
Score
Average
Average
Low
Average
“Score” LearnRite’s venture investor attractiveness in terms of management team
factors. Follow the instructions in Part F.
Management Team
Experience/Expertise: very good in software/tech industries
Functional Areas: good except for finance
Flexibility/Adaptability: experience suggests flexibility
Entrepreneurial Focus: startup risks accepted by founder/team
J.
Score
High
Average
Average
Average
Determine overall total points and an average score for LearnRite as was done for the
Companion Systems Corporation in the Appendix. Items where information is judged to
be lacking and an NA is used should be excluded when calculating an average score.
The “labels” assigned in (F) through (I) for LearnRite can be summarized as follows:
Category
High
Average
Low
Totals
Number x
3
11
2
16
Points Per
3
2
1
=
Total Points
9
22
2
33
Average score = 33/16 = 2.06
K.
Provide a brief written summary indicating how you feel about LearnRite.com as a
business opportunity.
We have “scored” each of the 16 items. Of course, it could be argued that adequate
information might be lacking for one or more of the items and an NA could have been
assigned until the information was acquired. However, even after substantial due
diligence efforts are completed, scoring “judgments” will still have to be made. [We
note that differences in industry knowledge, attitudes towards risk preferences, etc.
might lead individual instructors and/or students to “score” certain items differently
than we have. Such differences in opinion should help enliven the discussion of the
mini case and provide recognition that deciding to become an entrepreneur is not for
everyone.]
We have assigned “average” scores to about two-thirds of the items, which accounts
for a score around 2. Of course, it is important we recognize that the venture
opportunity-screening guide we are employing is very demanding due to its focus on
venture investor expectations. While an idea/opportunity with an average score (1.67
to 2.33) may find it somewhat difficult to attract venture capital, it may still constitute
a viable business opportunity. The risks associated with the LearnRite venture are
potentially high, but the rewards are also potentially large. As a result, LearnRite
could be very successful and generate substantial wealth for the founder and the
management team.