Solution manual for economics 12th edition by arnold
Bạn đang xem bản rút gọn của tài liệu. Xem và tải ngay bản đầy đủ của tài liệu tại đây (514.16 KB, 23 trang )
CHAPTER 1
What Economics Is About
Download Full Solution Manual for Economics 12th Edition by Arnold
/>Chapter 1 provides students with an overview of what economics is and of some of the key
concepts in economics. It also introduces students to the market-versus-government debate
over economic problems. There are two appendices to this chapter. Appendix A covers working
with graphs—teaching the student how to read a graph, how to derive the slope of both a line
and a curve, and introducing the student to bar graphs, pie charts, and line graphs. Appendix B
discusses economics as a major and careers for economics majors.
KEY IDEAS
1.
2.
3.
4.
5.
6.
Economics is the science of scarcity.
Economists think in terms of key concepts.
The market-versus-government debate is an important one to know about, but it takes
time to learn the particulars.
Economics is sometimes broken down into different categories.
[Appendix A] Economists work with diagrams.
[Appendix B] Economics can be a viable major.
CHAPTER OUTLINE
I.
YOUR LIFE, 2016–2026
The study of economics is relevant to everyone’s lives today and tomorrow. With the
help of economics, one can find specific answers to questions such as “How much will
one earn as salary after college?” “What is one’s life going to be like during 2016-2026?”
etc.
Formatted: Indent: Left: 1,27 cm
Formatted: Font: Not Bold
III.
A DEFINITION OF ECONOMICS
A.
Goods and Bads
Economists talk about goods (anything that gives a person utility) and bads
(anything that gives a person disutility). People want goods and they do not want
bads.
B.
Resources
1
© 2016 Cengage Learning. All Rights Reserved. May not be copied, scanned, or duplicated, in whole or in part, except for use as permitted in a
license distributed with a certain product or service or otherwise on a password-protected website for classroom use.© 2016 Cengage Learning. All
Rights Reserved. May not be scanned, copied or duplicated,
or posted to a publicly accessible website, in whole or in part, except for use as permitted in a license distributed with a certain product or service or
otherwise on a password-protected website for classroom use.© 20146 Cengage Learning. All Rights Reserved. May not be scanned, copied or
duplicated,
or posted to a publicly accessible website, in whole or in part.
2
Chapter 1
It takes resources to produce goods. Economists divide resources into four broad
categories: land, labor, capital, and entrepreneurship.
C.
Scarcity and a Definition of Economics
Scarcity is the condition where our wants are greater than the limited resources
available to satisfy them. Scarcity is the basic economic problem confronting all
individuals and societies. For this reason, economics is defined as the science of
how individuals and societies deal with the fact that wants are greater than the
limited resources available to satisfy those wants. Scarcity affects everyone;
even billionaires.
Three effects of scarcity are (1) the need to make choices, (2) the need for a
rationing device, and (3) competition. Competition occurs because of scarcity,
and takes the form of people trying to get more of the rationing device.
D.
The Counterintuitive in Economics
The economic and political institutions under which a country operates play a
very important role in determining the outcomes that the country faces while
dealing with scarcity. These institutions are different in various countries and it is
the difference here that matters to poverty and wealth.
Scarcity affects everyone. Three effects of scarcity are (1) the need to make
choices, (2) the need for a rationing device, and (3) competition. Competition
occurs because of scarcity, and takes the form of people trying to get more of the
rationing device.
Formatted: Indent: Left: 0 cm
III.
KEY CONCEPTS IN ECONOMICS
A.
Opportunity Cost
The opportunity cost of anything is the most highly valued opportunity or
alternative forfeited when a choice is made. Opportunity costs are incurred
whenever choices are made because the resources used for those choices could
have been used in other ways.
B.
Opportunity Cost and Behavior
The higher the opportunity cost of doing something, the less likely it will be done.
C.
Benefits and Costs
Economists are careful to think in terms of both costs and benefits.
D.
Decisions Made at the Margin
© 2016 Cengage Learning. All Rights Reserved. May not be copied, scanned, or duplicated, in whole or in part, except for use as permitted in a
license distributed with a certain product or service or otherwise on a password-protected website for classroom use.© 2016 Cengage Learning. All
Rights Reserved. May not be scanned, copied or duplicated,
or posted to a publicly accessible website, in whole or in part, except for use as permitted in a license distributed with a certain product or service or
otherwise on a password-protected website for classroom use.© 2014 2016 Cengage Learning. All Rights Reserved. May not be scanned, copied or
duplicated,
or posted to a publicly accessible website, in whole or in part.
What Economics Is About
3
Decision making at the margin is characterized by weighing additional (marginal)
benefits of a change against the additional (marginal) costs of a change with
respect to current conditions.
E.
Efficiency
The right amount of anything is the optimal or efficient amount: the amount for
which the marginal benefits equal the marginal costs. Net benefits are maximized
when efficiency is achieved.
F.
Economics is About Incentives
An incentive is something that encourages or motivates a person to undertake an
action. Individuals have an incentive to undertake actions for which the benefits
are greater than the costs or, stated differently, for which they expect to receive
net benefits (benefits greater than costs).
G.
Unintended Effects
Economists try to look at the unintended effects of an action.
H.
Exchange
Exchange or trade is the process of giving up one thing for something else.
People enter into exchanges in order to make themselves better off.
IVII.
THE MARKET AND GOVERNMENT
When it comes to economic problems, the national debate usually proceeds along these
lines: first, the problem is identified and defined or described, second, individuals attempt
to identify the cause of the problem, and third, individuals propose solutions to the
problem. Most of the debate focuses on the cause(s) of the problem and the proposed
solutions. With respect to both the cause and the solution, we often hear two words
mentioned: the “market” and “government.” The market-versus-government debate is an
important one to know about, but it takes time to learn the particulars. Much of this book
will help you learn those particulars.
AV.
CETERIS PARIBUS AND THEORY
B.
Ceteris Paribus ThinkingThinking
Formatted: Font: Italic
Ceteris paribus means “all other things held constant”, or “nothing else changes.”
Invoking this assumption allows us to clearly designate what we believe is the
correct relationship between two variables.
© 2016 Cengage Learning. All Rights Reserved. May not be copied, scanned, or duplicated, in whole or in part, exce pt for use as permitted in a
license distributed with a certain product or service or otherwise on a password-protected website for classroom use.© 2016 Cengage Learning. All
Rights Reserved. May not be scanned, copied or duplicated,
or posted to a publicly accessible website, in whole or in part, except for use as permitted in a license distributed with a certain product or service or
otherwise on a password-protected website for classroom use.© 201463 Cengage Learning. All Rights Reserved. May not be scanned, copied or
duplicated,
or posted to a publicly accessible website, in whole or in part.
4
Chapter 1
B.
What is a Theory?
Economists build theories to answer questions that do not have obvious
answers. To an economist, a theory is an abstract representation of the world.
When they build a theory they leave out certain things and focus on the major
factors or variables that they believe will explain the phenomenon they are trying
to understand. A theory emphasizes only the variables that the theorist believes
are the main or critical ones that explain an activity or event.
IVVI.
ECONOMIC CATEGORIES
A.
Positive and Normative Economics
Positive economics addresses what is, while normative economics attempts to
determine what should be. This book mainly deals with positive economics.
B.
Microeconomics and Macroeconomics
Microeconomics is the study of human behavior and choices as they relate to
relatively small units, such as an individual, a firm, an industry, or a single
market. Macroeconomics is the study of human behavior and choices as they
relate to an entire economy.
VII.
APPENDIX A: WORKING WITH DIAGRAMS
A.
Two-Variable Diagrams
A two variable diagram represents a relationship between two variables. Variables may
be directly related (when one changes, the other changes in the same way) or inversely
related (when one changes, the other changes in the opposite way). Variables can also
be independent of each other. This condition exists if as one variable changes, the other
does not.
BA.
Slope of a Line
The slope of a line is the ratio of the change in the variable on the vertical axis to
the change in the variable on the horizontal axis, and is used to learn how much
one variable changes as the other variable changes.
CB.
The Slope of a Line is Constant
The slope between any two points on a straight line is always the same as the
slope between any other two points on that line.
DC.
Slope of a Curve
© 2016 Cengage Learning. All Rights Reserved. May not be copied, scanned, or duplicated, in whole or in part, except for use as permitted in a
license distributed with a certain product or service or otherwise on a password-protected website for classroom use.© 2016 Cengage Learning. All
Rights Reserved. May not be scanned, copied or duplicated,
or posted to a publicly accessible website, in whole or in part, except for use as permitted in a license distributed with a certain product or service or
otherwise on a password-protected website for classroom use.© 2014 2016 Cengage Learning. All Rights Reserved. May not be scanned, copied or
duplicated,
or posted to a publicly accessible website, in whole or in part.
What Economics Is About
5
The slope of a curved line at any given point is equal to the slope of a straight
line tangent to the curve at that point.
ED.
The 45-Degree Line
The 45-degree line is a straight line that bisects the right angle formed by the
intersection of the vertical and horizontal axes.
FE.
Pie Charts
Pie charts are used to demonstrate how the parts of a whole are distributed.
GF.
Bar Graphs
Bar graphs are used to convey relative relationships.
HG.
Line Graphs
Line graphs are useful for illustrating changes in a variable over some time
period, but convey different messages depending on the measurement scale
used. Sometimes two line graphs are shown on the same axes to draw attention
to the relationship or the difference between the two variables.
VIII.
APPENDIX B: SHOULD YOU MAJOR IN ECONOMICS?
Students often consider the dollars at the end of the college degree. When
choosing a major, students often consider 1) how much they enjoy studying a
particular subject, 2) what they would like to see themselves doing in the future,
and 3) what their income prospects are.
A.
Five Myths about Economics and Being an Economics Major
Some things that people think about an economics major and about a career in
economics are not true. The five myths about economics are:
Myth 1: Economics Is All Mathematics and Statistics.
Myth 2: Economics Is Only About Inflation, Interest Rates, Unemployment, and
Other Such Things.
Myth 3: People Become Economists Only If They Want to “Make Money.”
Myth 4: Economics Wasn’t Very Interesting in High School, So It’s Not Going to
Be Very Interesting in College.
Myth 5: An Economics Degree Is a Lot Like a Business Degree, But a Business
Degree Is More Marketable.
B.
What Awaits You as an Economics Major?
Economics majors learn quantitative skills, writing skills, and thinking skills.
© 2016 Cengage Learning. All Rights Reserved. May not be copied, scanned, or duplicated, in whole or in part, exce pt for use as permitted in a
license distributed with a certain product or service or otherwise on a password-protected website for classroom use.© 2016 Cengage Learning. All
Rights Reserved. May not be scanned, copied or duplicated,
or posted to a publicly accessible website, in whole or in part, except for use as permitted in a license distributed with a certain product or service or
otherwise on a password-protected website for classroom use.© 201463 Cengage Learning. All Rights Reserved. May not be scanned, copied or
duplicated,
or posted to a publicly accessible website, in whole or in part.
6
Chapter 1
C.
What Do Economists Do?
Economists work in many varied fields and do a myriad of things.
TEACHING ADVICE
1.
Go to to see a clock that purports to show how much
debt the U.S. government has outstanding. Compare this figure with the one found at the
U.S. Treasury’s website at www.treasurydirect.gov/NP/BPDLogin?application=np. Use
this as a springboard for discussing positive economic statements such as “the figure
shown here is accurate” and “the figure shown here is inaccurate,” versus normative
economic statements such as “the federal debt is growing too rapidly” and “the federal
debt is too large.”
2.
Have students consider scarcity in the context of the Deepwater Horizon Oil Spill.
Discuss the use of rationing devices to decide which beaches to clean first.
Formatted: Indent: Left: 0 cm, First line: 0 cm
3.
The Arnold text web site at www.cengage.com/economics/arnold presents teaching
resources and on-line quizzes that your students can take (the results can be e-mailed
to you), and a variety of other topical material.
4.
The National Association of Business Economists has a Business Economics Career
Center, available online at which provides useful
information for students interested in majoring in economics.
Field Code Changed
Formatted: Hyperlink, Font: 11 pt
ASSIGNMENTS FOR MASTERING KEY IDEAS
Assignment 1.1
Key Idea: Economics is the science of scarcity.
1.
Define economics.
2.
Define scarcity.
3.
List three effects of scarcity.
4.
Define utility and disutility.
5.
State how economists divide resources.
6.
State the function of a rationing device and give an example.
7.
Explain why competition exists.
Assignment 1.2
Key Idea: Economists think in terms of key concepts.
1.
List the concepts that economists think in terms of.
2.
Define opportunity cost.
3.
Use the concept of opportunity cost to explain why some things are not done.
4.
Explain why economists consider costs and benefits, instead of only benefits.
© 2016 Cengage Learning. All Rights Reserved. May not be copied, scanned, or duplicated, in whole or in part, except for use as permitted in a
license distributed with a certain product or service or otherwise on a password-protected website for classroom use.© 2016 Cengage Learning. All
Rights Reserved. May not be scanned, copied or duplicated,
or posted to a publicly accessible website, in whole or in part, except for use as permitted in a license distributed with a certain product or service or
otherwise on a password-protected website for classroom use.© 2014 2016 Cengage Learning. All Rights Reserved. May not be scanned, copied or
duplicated,
or posted to a publicly accessible website, in whole or in part.
What Economics Is About
5.
6.
7
Give an example from your life where you have considered both costs and benefits.
Explain why it is important to consider unintended effects.
Assignment 1.3
Key Idea: The market-versus-government debate is an important one to know about, but it takes
time to learn the particulars.
1.
When it comes to economic problems, how does the national debate usually proceed?
2.
Explain why economists use the ceteris paribus assumption.
Assignment 1.4
Key Idea: Economics is sometimes broken down into different categories.
1.
Define positive and normative economics.
2.
Write your own example of a positive economic statement.
3.
Write your own example of a normative economic statement.
4.
Define microeconomics and macroeconomics.
5.
Categorize the following as microeconomic or macroeconomic questions:
a.
What are the differences between the dairy industry and the airline industry?
b.
Why are unemployment rates for teenagers rising?
c.
Why are prices falling in the digital camera industry?
d.
Why is the U.S. experiencing low rates of inflation?
e.
How large is McDonald’s share of the fast food industry?
f.
How will minimum wage rate changes affect your 17 year old brother’s budget?
g.
Why are interest rates rising?
h.
How will the elimination of the capital gains tax affect the level of investment in
the US economy?
i.
Why are economic growth rates different in the U.S. and China?
Assignment 1.5
Key Idea: Economists work with diagrams.
1.
Explain what it means for two variables to be directly related, inversely related, or
independent.
2.
Explain what the slope of a line is used to show.
3.
Compare the slope of a straight line with the slope of a curve.
4.
List some of the types of charts and graphs that economists use.
Assignment 1.6
Key Idea: Economics can be a viable major.
1.
Describe five myths about economics and an economics major.
2.
List the skills that economic majors learn.
3.
List a few of the things that economists do.
ANSWERS TO ASSIGNMENTS FOR MASTERING KEY IDEAS
Assignment 1.1 Answers
1.
Economics is the science of how individuals and societies deal with the fact that wants
are greater than the limited resources available to satisfy those wants.
© 2016 Cengage Learning. All Rights Reserved. May not be copied, scanned, or duplicated, in whole or in part, exce pt for use as permitted in a
license distributed with a certain product or service or otherwise on a password-protected website for classroom use.© 2016 Cengage Learning. All
Rights Reserved. May not be scanned, copied or duplicated,
or posted to a publicly accessible website, in whole or in part, except for use as permitted in a license distributed with a certain product or service or
otherwise on a password-protected website for classroom use.© 201463 Cengage Learning. All Rights Reserved. May not be scanned, copied or
duplicated,
or posted to a publicly accessible website, in whole or in part.
8
2.
3.
4.
5.
6.
7.
Chapter 1
Scarcity is the condition where our wants are greater than the limited resources available
to satisfy them.
Three effects of scarcity are (1) the need to make choices, (2) the need for a rationing
device, and (3) competition.
Utility is the satisfaction received from a good. Disutility is the dissatisfaction received
from a bad.
Economists divide resources into four broad categories: land, labor, capital, and
entrepreneurship.
Rationing devices are used to decide who gets a good. Examples vary.
Competition exists because of scarcity—there aren’t enough resources to satisfy our
wants.
Assignment 1.2 Answers
1.
Economists think in terms of opportunity cost and behavior, benefits and costs, decisions
made at the margin, efficiency, incentives, unintended effects, and exchange.
2.
Opportunity cost is the most highly valued opportunity or an alternative forfeited when a
choice is made.
3.
The higher the opportunity cost of something is, the less likely it is to be done.
4.
Economists consider costs and benefits, instead of only benefits, in order to make better
choices.
5.
Answers will vary.
6.
It is important to consider unintended effects since knowing about unintended effects
leads to better decisions.
Assignment 1.3 Answers
1.
First, the problem is identified and defined or described. Second, individuals attempt to
identify the cause of the problem. Third, individuals propose solutions to the problem.
2.
Economists use the ceteris paribus assumption to clearly designate what they believe is
the correct relationship between two variables.
Assignment 1.4 Answers
1.
Positive economics addresses what is, while normative economics attempts to
determine what should be. This book mainly deals with positive economics.
2.
Answers will vary.
3.
Answers will vary.
4.
Microeconomics is the study of human behavior and choices as they relate to relatively
small units, such as an individual, a firm, an industry, or a single market.
Macroeconomics is the study of human behavior and choices as they relate to an entire
economy.
5.
a.
Microeconomics.
b.
Macroeconomics.
c.
Microeconomics.
d.
Macroeconomics.
e.
Microeconomics.
f.
Microeconomics.
g.
Macroeconomics.
h.
Macroeconomics.
© 2016 Cengage Learning. All Rights Reserved. May not be copied, scanned, or duplicated, in whole or in part, except for use as permitted in a
license distributed with a certain product or service or otherwise on a password-protected website for classroom use.© 2016 Cengage Learning. All
Rights Reserved. May not be scanned, copied or duplicated,
or posted to a publicly accessible website, in whole or in part, except for use as permitted in a license distributed with a certain product or service or
otherwise on a password-protected website for classroom use.© 2014 2016 Cengage Learning. All Rights Reserved. May not be scanned, copied or
duplicated,
or posted to a publicly accessible website, in whole or in part.
What Economics Is About
i.
9
Macroeconomics.
Assignment 1.5 Answers
1.
Two variables are directly related if they change in the same way, are inversely related if
they change in opposite ways, and are independent if one changes and the other one
does not.
2.
The slope of a line is used to show how much one variable changes as the other
variable changes.
3.
The slope of a straight line is constant, while the slope of a curve changes.varies from
one point to another.
4.
Economists use pie charts, bar graphs, and line graphs.
Formatted: Indent: Left: 0 cm, Hanging: 1,27 cm
Assignment 1.6 Answers
1.
Myths about economics include that it is all mathematics and statistics, that it is only
about inflation, interest rates, unemployment and other such things, that people become
economists only if they want to make money, that economics isn’t very interesting, and
that an economics degree is a lot like a business degree, only less marketable.
2.
Economics majors learn many of the skills that employers highly value: quantitative
skills, writing skills, and thinking skills.
3.
Answers will vary.
ANSWERS TO VIDEO QUESTIONS AND PROBLEMS
1.
There are 30 students in an Economics class. Is the opportunity cost of attending
the class the same for each of the 30 students? Why or why not.
It is very unlikely that the opportunity costs will be the same for all the 30 students. Opportunity
cost is the most highly valued opportunity or an alternative forfeited when a choice is made. The
alternative forfeited by one student may not be the same as the opportunity forfeited by another
student. By attending an economics class, one student may be giving up reading a novel and
another may be giving up working at a part-time job. So, the opportunity will not be the same for
all 30 students.
2.
Scarcity is the condition in which peoples’ wants (for goods and services) are
unlimited or infinite. Do you agree or disagree? Explain your answer.
Scarcity is the condition in which peoples' wants are greater than the limited resources available
to satisfy them. It implies that the wants are unlimited or infinite in relation to the limited
resources available.
3.
Explain what it means to make a decision at the margin.
Marginal benefits and costs are not the same as total benefits and costs. When deciding
whether to eat some more food, an individual would not consider the total benefits and total
costs of eating food. Instead, the person would compare only the marginal benefits (additional
benefits) of eating some more to the marginal costs (additional costs) of eating some more.
© 2016 Cengage Learning. All Rights Reserved. May not be copied, scanned, or duplicated, in whole or in part, exce pt for use as permitted in a
license distributed with a certain product or service or otherwise on a password-protected website for classroom use.© 2016 Cengage Learning. All
Rights Reserved. May not be scanned, copied or duplicated,
or posted to a publicly accessible website, in whole or in part, except for use as permitted in a license distributed with a certain product or service or
otherwise on a password-protected website for classroom use.© 201463 Cengage Learning. All Rights Reserved. May not be scanned, copied or
duplicated,
or posted to a publicly accessible website, in whole or in part.
10
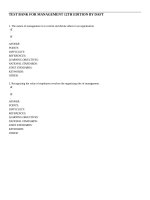
4.
Chapter 1
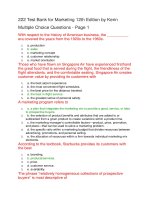
Can a person exercise “too much”? Explain your answer.
MC of exercising
MC and MB
MC = MB
MC < MB
A
MC > MB
MB of exercising
0
30
Time spent exercising
In the above figure, MB refers to the marginal benefits of exercising and MC refers to the
marginal costs of exercising. The MB curve is downward sloping and the MC curve is upward
sloping. As long as MB MC, the person will exercise. The efficient amount of exercise when
MB = MC, at 30 hours. The person stops exercising when MB MC. This is the efficient amount
of exercise. If the person exercises when MC > MB, then he/e or she will be exercising too
much.
5.
Formatted: Font: Arial
Formatted: Font: Arial
Formatted: Font: Not Italic
All theories are abstractions from reality. What does this mean?
A theory emphasizes only the variables that the theorist believes are the main or critical ones
that explain an activity or event. All theories are abstractions from reality. But it doesn’t follow
that (abstract) theories cannot explain reality. The objective in theory building is to ignore the
variables that are essentially irrelevant to the case at hand, making it easier to isolate the
important variables that the an untrained observer would probably miss.
ANSWERS TO CHAPTER QUESTIONS AND PROBLEMS
1.
The United States is considered a rich country because Americans can choose
from an abundance of goods and services. How can there be scarcity in a land of
abundance?
Abundance does not imply unlimited resources. No one has unlimited money and time, so everyone
must constantly make choices. This is the fundamental basis of scarcity. Even in a land of
abundance, wants exceed the resources available to meet those wants.
© 2016 Cengage Learning. All Rights Reserved. May not be copied, scanned, or duplicated, in whole or in part, except for use as permitted in a
license distributed with a certain product or service or otherwise on a password-protected website for classroom use.© 2016 Cengage Learning. All
Rights Reserved. May not be scanned, copied or duplicated,
or posted to a publicly accessible website, in whole or in part, except for use as permitted in a license distributed with a certain product or service or
otherwise on a password-protected website for classroom use.© 2014 2016 Cengage Learning. All Rights Reserved. May not be scanned, copied or
duplicated,
or posted to a publicly accessible website, in whole or in part.
What Economics Is About
2.
11
Give two examples for each of the following: (a) an intangible good, (b) a tangible
good, (c) a bad.
Answers will vary.
(a)
Intangible goods are those that have no concrete existence, such as friendship or an
economics lecture.
(b)
Tangible goods are concrete goods that can be exchanged and reproduced more easily
than intangible goods, such as a videotape of an economics lecture or a cell phone.
(c)
Bads are goods that provide disutility. Examples might beare pollution, the noise
produced by planes taking off at an airport, or the smell a skunk produces etc.
3.
Give an example of something that is a good for one person and a bad for another
person.
Answers will vary. The example in the textbook is smoking aa cigarette.
4.
What do economists mean when they say that “institutions matter”?
The wealth of a nation strictly depends on the quality and efficiency of economic and political
institutions under which the nation operates. These institutions determine the outcomes of
production and growth processes. Scarcity exists everywhere. But the way a country deals with it is
important to shape its prosperity, and that is where the “institutions matter”.
5.
What is the difference between the resource labor and the resource
entrepreneurship?
Labor consists of the physical and mental talents people contribute to the existing production
process, while entrepreneurship refers to creatively seeking new business opportunities and new
ways to organize production, and developing new ways of doing things.
6.
Can either scarcity or one of the effects of scarcity be found in a car dealership?
Explain your answer.
Answers will vary. One example is that the resources used to produce a car sold in the dealership
found there could have been used to produce a different good.
7.
Explain the link between scarcity and each of the following: (a) choice, (b)
opportunity cost, (c) the need for a rationing device, (d) competition.
(a)
Because there is scarcity, individuals have to choose between the different goods that
they have the opportunity to consume.
In choosing between different goods, individuals face an opportunity cost. When they
decide to choose one good (go to a baseball game), they give up the opportunity to
consume another good (see a movie).
Because wants exceed resources, some method for allocating scarce resources is
necessary. Although there are many rationing devices, the most common one used in
(b)
(c)
© 2016 Cengage Learning. All Rights Reserved. May not be copied, scanned, or duplicated, in whole or in part, exce pt for use as permitted in a
license distributed with a certain product or service or otherwise on a password-protected website for classroom use.© 2016 Cengage Learning. All
Rights Reserved. May not be scanned, copied or duplicated,
or posted to a publicly accessible website, in whole or in part, except for use as permitted in a license distributed with a certain product or service or
otherwise on a password-protected website for classroom use.© 201463 Cengage Learning. All Rights Reserved. May not be scanned, copied or
duplicated,
or posted to a publicly accessible website, in whole or in part.
12
Chapter 1
(d)
economic transactions is the price mechanism, which defines how much of one resource
(money) an individual must give up in order to obtain another resource.
Because resources are limited, people compete with one another both to obtain the
resources they need to purchase the limited resources, and to get the resources that are
available. This process is called competition.
8.
Is it possible for a person to incur an opportunity cost without spending any
money? Explain.
Yes. An opportunity cost occurs when an individual gives up any resource when making a choice.
An example would be leisure time. When students study for an exam, the opportunity cost is the
time they could have spent watching a movie or listening to a Sheryl Crow CD. Of course, not
studying for the exam could also have an opportunity cost—flunking the course.
9.
Discuss the opportunity costs of attending college for four years. Is college more
or less costly than you thought it was? Explain.
Answers will vary. Students should include the cost of tuition, fees, and supplies that they
purchase only because they are enrolled in college. They should also include that portion of
room and board that they would not have spent had they not matriculated, remembering that,
had they not enrolled in college, they would still have to eat and sleep somewhere. Finally, they
should consider the opportunity cost of the time they spend in college. For example, suppose
that Suzie has the following choices: she can go to college for the year, she can spend the
entire year relaxing in leisure, she can take a job paying $25,000 a year as a legal secretary
for a hometown law firm, or she can take a job with the Peace Corps in Africa, earning
$17,000. If she decides that the best alternative use of her time would be to take a job
paying $25,000 a year as a legal secretary, the opportunity cost of going to college will
include the $25,000 that Susie foregoes. Once students include their opportunity costs, they
find that college is considerable more expensive than they thought it was when they only
considered out-of-pocket expenses.
10.
Explain the relationship between changes in opportunity costs and changes in
behavior.
To the extent that opportunity costs determine behavior by identifying those activities and
goods that are “worth” making “sacrifices” for and those that aren’t, as opportunity costs
change so will a rational consumer’s assessment of various options. For example, suppose
that Becky, a high school graduate, is currently working as a model and is earning $25,000
per year. In order to go to college she would have to cut back on her modeling, reducing her
annual income to $10,000. Further, suppose that tuition, books, and fees at the college of
Becky’s choice total $15,000 per year. In deciding whether to quit modeling full -time and go
to college, Becky is faced with balancing a present opportunity cost of $30,000, ceteris
paribus, against the future benefits of a college education. Now, suppose that Becky earns a
scholarship that will reduce her tuition, books, and fees bill to $5,000 per year, thus reducing
her present opportunity cost to $20,000. While this may not change Becky’s mind (she may
have already decided to accept the present burden for the future benefit), such a change in
opportunity cost would certainly weigh in favor of going to college.
© 2016 Cengage Learning. All Rights Reserved. May not be copied, scanned, or duplicated, in whole or in part, except for use as permitted in a
license distributed with a certain product or service or otherwise on a password-protected website for classroom use.© 2016 Cengage Learning. All
Rights Reserved. May not be scanned, copied or duplicated,
or posted to a publicly accessible website, in whole or in part, except for use as permitted in a license distributed with a certain product or service or
otherwise on a password-protected website for classroom use.© 2014 2016 Cengage Learning. All Rights Reserved. May not be scanned, copied or
duplicated,
or posted to a publicly accessible website, in whole or in part.
What Economics Is About
11.
13
Smith says that we should eliminate all pollution in the world. Jones disagrees.
Who is more likely to be an economist, Smith or Jones? Explain your answer.
Jones is more likely to be the economist. Smith is advocating the elimination of pollution by only
considering the obvious benefits and not considering the serious costs of eliminating all pollution
(such as costs incurred from finding an alternative to fossil fuels). Jones probably determined
that the costs of eliminating all pollution are higher than the benefits from eliminating it.
12.
A friend pays for your lunch. Is this an example of a “free lunch”? Why or why
not?.
This is not an example of a free lunch, since your friend could have bought something else with
the money she used to buy your lunch.
13.
A layperson says that a proposed government project simply costs too much and
therefore shouldn’t be undertaken. How might an economist’s evaluation be
different?
The layperson may only be looking at the cost of the project and not considering the benefits.
An economist would consider both the marginal costs and the marginal benefits of the project.
For example, the interstate highway system in the United States has cost a lot of money, but it
has also provided a lot of benefits. Consequently, the United States has introduced an interstate
highway system because the benefits of the system exceed the costs. On the other hand, the
Apollo project that sent men to the Moon was suspended after a handful of flights because
many people perceived that the marginal costs of sending men to the Moon was exceeding the
marginal benefits. The individual may also be making a proper economic evaluation. The project
might create large benefits to society, but none to that person. So while most people might see
benefits exceeding costs, to some there are only costs and no benefits.
14.
Economists say that individuals make decisions at the margin. What does this
mean?
When economists say that individuals make decisions at the margin, they are referring to the
fact that individuals consider the additional (marginal) benefits of their actions and the additional
(marginal) costs of their actions. If the marginal benefits exceed the marginal costs, they
proceed with the action. If the marginal costs are greater than the marginal benefits, then they
do not carry out the action. For example, we decide whether or not to eat another piece of pizza
by comparing the benefits and costs of that piece, not the benefits and costs of all the pieces we
have already eaten.
15.
How would an economist define the efficient amount of time spent playing tennis?
Economists state that efficiency occurs when the marginal benefits (MB) of an activity equal the
marginal costs (MC) of that activity. The efficient level of time spent playing tennis would exist
where the MB of playing tennis equals the MC of playing tennis.
© 2016 Cengage Learning. All Rights Reserved. May not be copied, scanned, or duplicated, in whole or in part, exce pt for use as permitted in a
license distributed with a certain product or service or otherwise on a password-protected website for classroom use.© 2016 Cengage Learning. All
Rights Reserved. May not be scanned, copied or duplicated,
or posted to a publicly accessible website, in whole or in part, except for use as permitted in a license distributed with a certain product or service or
otherwise on a password-protected website for classroom use.© 201463 Cengage Learning. All Rights Reserved. May not be scanned, copied or
duplicated,
or posted to a publicly accessible website, in whole or in part.
14
16.
Chapter 1
Ivan stops studying before the point at which his marginal benefits of studying
equal his marginal costs. Is Ivan forfeiting any net benefits? Explain your answer.
Ivan is forfeiting net benefits because net benefits are maximized when marginal benefits equal
marginal costs.
17.
What does an economist mean if she says that there are no $10 bills on the
sidewalk?
She means that people try to maximize their net benefits.
18.
A change in X will lead to a change in Y; the predicted change is desirable, so we
should change X. Do you agree or disagree? Explain.
Assuming that the relationship between X and Y had been accurately measured, and that the
relationship did not change, then the change in X would be desirable; however, several caveats
should be recognized. First, the relationship could have been misspecified. Important factors that
also influence Y, perhaps more strongly than X, could have been ignored in the analysis. It might
be more efficient to change these other factors rather than X. Some logical explanation of why the
relationship between X and Y occurs should be developed before proceeding. Second, the
relationship between X and Y can change over time. You don’t want to commit the fallacy of
confusing correlation with causation. You can reduce the probability of this error by developing a
logical explanation of why X will lead to a change in Y.
19.
Why do people enter into exchanges?
People enter into exchanges in order to make themselves better off.
20.
When two individuals enter into an exchange, you can be sure that one person
benefits and that the other person loses. Do you agree or disagree with this
statement? Explain your answer.
Disagree. The two individuals would not have voluntarily entered into the exchange if they did not
both expect to benefit from it.
21.
What is the difference between positive economics and normative economics?
Between microeconomics and macroeconomics?
Positive economics addresses what is, while normative economics attempts to determine what
should be. Microeconomics is the study of human behavior and choices as they relate to
relatively small units, such as an individual or a firm, while macroeconomics is the study of
human behavior and choices as they relate to an entire economy.
22.
Would there be a need for a rationing device if scarcity did not exist? Explain your
answer.
© 2016 Cengage Learning. All Rights Reserved. May not be copied, scanned, or duplicated, in whole or in part, except for use as permitted in a
license distributed with a certain product or service or otherwise on a password-protected website for classroom use.© 2016 Cengage Learning. All
Rights Reserved. May not be scanned, copied or duplicated,
or posted to a publicly accessible website, in whole or in part, except for use as permitted in a license distributed with a certain product or service or
otherwise on a password-protected website for classroom use.© 2014 2016 Cengage Learning. All Rights Reserved. May not be scanned, copied or
duplicated,
or posted to a publicly accessible website, in whole or in part.
What Economics Is About
15
A rationing device is a means for deciding who gets what; therefore, if there were enough
resources and goods for everyone, there would not be a need for a rationing device.
23.
Jackie’s alarm clock buzzes. She reaches over to the small table next to her bed
and turns it off. As she pulls the covers back up, Jackie thinks about her 8:30
American history class. Should she go to the class today or sleep a little longer?
She worked late last night and really hasn’t had enough sleep. Besides, she’s fairly
sure her professor will be discussing a subject she already knows well. Maybe it
would be okay to miss class today. Is Jackie more likely to miss some classes than
she is to miss other classes? What determines which classes Jackie will attend and
which classes she won’t?
Jackie should sleep a little longer. Jackie is more likely to miss some classes than she is to miss
other classes since the cost of missing class is higher on some days. Jackie will decide which
classes to attend by comparing the benefit from attending with the cost of attending.
24.
If you found $10 bills on the sidewalk regularly, we might conclude that individuals
don’t try to maximize net benefits. Do you agree or disagree with this statement?
Explain your answer.
Disagree. We would conclude that the cost of picking up a $10 bill exceeds the benefit from
picking up a $10 bill.
25.
The person who smokes cigarettes cannot possibly be thinking in terms of costs
and benefits because it has been proven that cigarette smoking increases one’s
chances of getting lung cancer. Do you agree or disagree with the part of the
statement that reads “the person who smokes cigarettes cannot possibly be
thinking in terms of costs and benefits”? Explain your answer.
Disagree. The person who smokes has decided that the benefits outweigh the costs of smoking
(including the chances of getting lung cancer).
26.
Janice decides to go out on a date with Kyle instead of Robert. Do you think Janice
is using some kind of “rationing device” to decide who she dates? If so, what might
that rationing device be?
Assuming that Janice does not have time to date them both, she must decide which man gets the
pleasure of her company. In this case she would use a rationing device to decide who gets the
date. Depending on her preferences, this rationing device may be their intelligence, their looks,
their earning potential, or their ability to make her laugh.
27.
A theory is an abstraction from reality. What does this mean?
This means that certain things are left out in order to focus on the main variables that will
explain an activity or event.
ANSWERS TO PROBLEMS IN THE WORKING WITH NUMBERS AND
© 2016 Cengage Learning. All Rights Reserved. May not be copied, scanned, or duplicated, in whole or in part, exce pt for use as permitted in a
license distributed with a certain product or service or otherwise on a password-protected website for classroom use.© 2016 Cengage Learning. All
Rights Reserved. May not be scanned, copied or duplicated,
or posted to a publicly accessible website, in whole or in part, except for use as permitted in a license distributed with a certain product or service or
otherwise on a password-protected website for classroom use.© 201463 Cengage Learning. All Rights Reserved. May not be scanned, copied or
duplicated,
or posted to a publicly accessible website, in whole or in part.
16
Chapter 1
GRAPHS SECTION
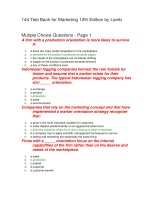
1.
Suppose the marginal costs of reading are constant and the marginal benefits of
reading decline (over time). Initially, the marginal benefits of reading are greater than the
marginal costs. Draw the marginal benefit curve and marginal cost curve of reading and
identify the efficient amount of reading. Next, explain why the efficient point is the point
at which the net benefits of reading are maximized.
Marginal costs,
marginal benefits
a4
a3
A
B
a2
MC
C
a1
MB
0
q1
q2
q3
Quantity
In the graph shown above, the vertical axis measures the marginal costs and benefits of
reading, while the horizontal axis measures quantity, i.e., the time spent on reading. The
horizontal MC curve shows the constant marginal cost of reading. The downward sloping
marginal benefit (MB) curve shows that the marginal benefit of reading declines over time.
Initially, at point A, the marginal benefits of reading are greater than the marginal costs; MB >
MC. So, there are net benefits from reading further. In the figure, the marginal benefits of
studying equal the marginal costs at q2, which is the efficient length of time to read in this
situation. If the time spent on reading is more than q2, the marginal costs of reading are greater
than the marginal benefits, and so therefore reading beyond q2 is not worthwhile. At q2, net
benefits are maximized. In short, efficiency, which is consistent with MB = MC, is also consistent
with maximizing net benefits.
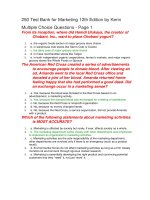
2.
Using the diagram you drew in question 1, lower the marginal costs of reading
and identify the new efficient amount of reading. Also, identify the additional net benefits
derived as a result of the lower marginal cost of reading.
© 2016 Cengage Learning. All Rights Reserved. May not be copied, scanned, or duplicated, in whole or in part, except for use as permitted in a
license distributed with a certain product or service or otherwise on a password-protected website for classroom use.© 2016 Cengage Learning. All
Rights Reserved. May not be scanned, copied or duplicated,
or posted to a publicly accessible website, in whole or in part, except for use as permitted in a license distributed with a certain product or service or
otherwise on a password-protected website for classroom use.© 2014 2016 Cengage Learning. All Rights Reserved. May not be scanned, copied or
duplicated,
or posted to a publicly accessible website, in whole or in part.
What Economics Is About
17
Marginal costs,
marginal benefits
a4
A
a1
a2
MC1
B
MC2
C
MB
0
q1
q2
Quantity
With a lower cost of reading, the marginal cost curve shifts downward from MC 1 to MC2. The
new marginal cost curve intersects the marginal benefit (MB) curve at B. At point B, net benefit
is maximized. The total net benefit derived at point A (at the higher cost of reading) was is
represented by the area of ∆Aa4a1 and the total net benefit derived at point B (at the lower cost
of reading) is represented by ∆Ba4a2. So, the additional benefits derived as a result of the lower
marginal cost of reading = the area given by (∆Ba4a2 – ∆Aa4a1) = area of the trapezium BAa1a2.
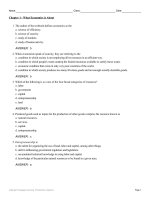
3.
Jim could undertake activity X, but chooses not to. Draw the marginal benefit and
cost curves for activity X from Jim’s perspective. [Draw the marginal cost curve as
upward-sloping or horizontal, but definitely above a declining marginal benefit curve.]
© 2016 Cengage Learning. All Rights Reserved. May not be copied, scanned, or duplicated, in whole or in part, exce pt for use as permitted in a
license distributed with a certain product or service or otherwise on a password-protected website for classroom use.© 2016 Cengage Learning. All
Rights Reserved. May not be scanned, copied or duplicated,
or posted to a publicly accessible website, in whole or in part, except for use as permitted in a license distributed with a certain product or service or
otherwise on a password-protected website for classroom use.© 201463 Cengage Learning. All Rights Reserved. May not be scanned, copied or
duplicated,
or posted to a publicly accessible website, in whole or in part.
18
Chapter 1
Marginal costs,
marginal benefits
MC
MB
0
Quantity
If Jim could undertake activity X but chose not to, this means that the marginal cost of
undertaking a unit of activity X is higher than the marginal benefit. From Jim’s perspective, the
marginal cost curve will always lie above the marginal benefit curve for all units of activity X.
ANSWERS TO APPENDIX A QUESTIONS
1.
For each of the following, wWhat type of relationship would you expect between
the followingvariables?: (a) Ssales of hot dogs and sales of hot dog buns, (b) Tthe
price of winter coats and sales of winter coats, (c) Tthe price of personal
computers and the production of personal computers, (d) Ssales of toothbrushes
and sales of cat food, (e) The nnumber of children in a family and the number of
toys in a family.
(a)
Hot dogs and hot dog buns are complementary goods, a concept discussed in Chapter
3. One would expect the quantity of hot dog buns to be directly related to the quantity of
hot dogs, ceteris paribus.
Quantity demanded is inversely related to price, another concept from Chapter 3. One
would expect the quantity of winter coats sold to be inversely related to the price of
winter coats, ceteris paribus.
Quantity supplied is positively related to price, again from Chapter 3. One would expect
the production of personal computers to be directly related to the price of personal
computers, ceteris paribus.
One would expect sales of cat food to be independent of sales of toothbrushes since
they are unrelated goods.
Ceteris paribus, one would expect that the more children in a family, the more toys—that
is, the two should be directly related.
(b)
(c)
(d)
(e)
© 2016 Cengage Learning. All Rights Reserved. May not be copied, scanned, or duplicated, in whole or in part, except for use as permitted in a
license distributed with a certain product or service or otherwise on a password-protected website for classroom use.© 2016 Cengage Learning. All
Rights Reserved. May not be scanned, copied or duplicated,
or posted to a publicly accessible website, in whole or in part, except for use as permitted in a license distributed with a certain product or service or
otherwise on a password-protected website for classroom use.© 2014 2016 Cengage Learning. All Rights Reserved. May not be scanned, copied or
duplicated,
or posted to a publicly accessible website, in whole or in part.
What Economics Is About
2.
19
Represent the following data in bar graph form:.
Year
20085
20096
201007
201108
201209
U.S. Money Supply
(billions of dollars)
1,604374
1,695365
1,836373
2,1601,595
2,4401,689
U.S. Money Supply
© 2016 Cengage Learning. All Rights Reserved. May not be copied, scanned, or duplicated, in whole or in part, exce pt for use as permitted in a
license distributed with a certain product or service or otherwise on a password-protected website for classroom use.© 2016 Cengage Learning. All
Rights Reserved. May not be scanned, copied or duplicated,
or posted to a publicly accessible website, in whole or in part, except for use as permitted in a license distributed with a certain product or service or
otherwise on a password-protected website for classroom use.© 201463 Cengage Learning. All Rights Reserved. May not be scanned, copied or
duplicated,
or posted to a publicly accessible website, in whole or in part.
20
Chapter 1
1800
1600
Billions of Dollars
1400
1200
1000
800
600
400
200
0
2005
3.
2006
2007
2008
2009
Plot the following data and specify the type of relationship between the two
variables. (Place “Price” on the vertical axis and “Quantity Demanded” on the
horizontal axis.)
Price of
Quantity Demanded
Apples ($)
of Apples
0.25
1,000
© 2016 Cengage Learning. All Rights Reserved. May not be copied, scanned, or duplicated, in whole or in part, except for use as permitted in a
license distributed with a certain product or service or otherwise on a password-protected website for classroom use.© 2016 Cengage Learning. All
Rights Reserved. May not be scanned, copied or duplicated,
or posted to a publicly accessible website, in whole or in part, except for use as permitted in a license distributed with a certain product or service or
otherwise on a password-protected website for classroom use.© 2014 2016 Cengage Learning. All Rights Reserved. May not be scanned, copied or
duplicated,
or posted to a publicly accessible website, in whole or in part.
What Economics Is About
21
0.50
0.70
0.95
1.00
1.10
800
700
500
400
350
The two variables are inversely related—that is, the higher the price of apples, the lower the
quantity of apples demanded.
300
400
500
600
700
800
900 1000
Quantity Demanded of Apples
4.
In Exhibit 4(a), determine the slope between points C and D.
The slope of a line on a graph is the ratio of the change in the variable on the vertical axis (the
“rise”) to the change in the variable on the horizontal axis (the “run”), or slope = ΔY/ΔX. In
Exhibit 4(a), the value of X at point C is 30, and at point D is 40; thus, from C to D, X increases
by 10. The value of Y at point C is 20, and at point D, Y = 10; therefore, from C to D, Y
decreases by 10. The slope of the line between points C and D is –10/10, or –1.
5.
In Exhibit 4(b), determine the slope between points A and D.
Using the same methodology as described above, the slope between points A and D = +2.
6.
What is the special characteristic of a 45-degree line?
© 2016 Cengage Learning. All Rights Reserved. May not be copied, scanned, or duplicated, in whole or in part, exce pt for use as permitted in a
license distributed with a certain product or service or otherwise on a password-protected website for classroom use.© 2016 Cengage Learning. All
Rights Reserved. May not be scanned, copied or duplicated,
or posted to a publicly accessible website, in whole or in part, except for use as permitted in a license distributed with a certain product or service or
otherwise on a password-protected website for classroom use.© 201463 Cengage Learning. All Rights Reserved. May not be scanned, copied or
duplicated,
or posted to a publicly accessible website, in whole or in part.
22
Chapter 1
The special characteristic of a 45-degree line is that any point on it is equidistant from both the
horizontal and vertical axeis—or, in layperson’s terms, at any point on the 45° line, the values of
X and Y are equal.
7.
What is the slope of a 45-degree line?
The slope of a 45-degree line is always +1.
8.
When is a pie chart better than a bar chart for illustrating data?
A pie chart is a convenient way to illustrate values that, when added together, equal a whole.
Thus, while both pie charts and bar graphs can be used to show magnitudes, pie charts are
preferable when the values being graphed are percentages—such as the allocation of the
federal budget or the location of world oil reserves.
9.
Plot the following data and specify the type of relationship between the two
variables. (Place “Price” on the vertical axis and “Quantity Supplied” on the
horizontal axis.)
Price of Apples ($) Quantity Supplied of Apples
0.25
350
0.50
400
0.70
500
0.95
700
1.00
800
1.10
1,000
The variables are positively, or directly, related—that is, when the price of apples rises, the
quantity of apples supplied also rises.
300
400
500
600
700
800
900 1000
Quantity Supplied of Apples
© 2016 Cengage Learning. All Rights Reserved. May not be copied, scanned, or duplicated, in whole or in part, except for use as permitted in a
license distributed with a certain product or service or otherwise on a password-protected website for classroom use.© 2016 Cengage Learning. All
Rights Reserved. May not be scanned, copied or duplicated,
or posted to a publicly accessible website, in whole or in part, except for use as permitted in a license distributed with a certain product or service or
otherwise on a password-protected website for classroom use.© 2014 2016 Cengage Learning. All Rights Reserved. May not be scanned, copied or
duplicated,
or posted to a publicly accessible website, in whole or in part.
What Economics Is About
23
© 2016 Cengage Learning. All Rights Reserved. May not be copied, scanned, or duplicated, in whole or in part, exce pt for use as permitted in a
license distributed with a certain product or service or otherwise on a password-protected website for classroom use.© 2016 Cengage Learning. All
Rights Reserved. May not be scanned, copied or duplicated,
or posted to a publicly accessible website, in whole or in part, except for use as permitted in a license distributed with a certain product or service or
otherwise on a password-protected website for classroom use.© 201463 Cengage Learning. All Rights Reserved. May not be scanned, copied or
duplicated,
or posted to a publicly accessible website, in whole or in part.