Test bank for analyzing inequalities an introduction to race class gender and sexuality using the general social survey 1st edition by harnois
Bạn đang xem bản rút gọn của tài liệu. Xem và tải ngay bản đầy đủ của tài liệu tại đây (308.2 KB, 5 trang )
Instructor Resource
Harnois, Analyzing Inequalities
SAGE Publishing, 2018
Test Bank for Analyzing Inequalities: An Introduction to Race, Class, Gender, and Sexuality
Using the General Social Survey 1st edition by Catherine E. Harnois
Link full download test bank: />Link full download solution manual: />Chapter 2: Understanding Data: Critical Concepts
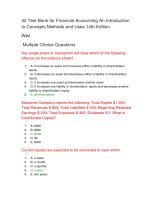
Figure 2.1
HAPMAR
HAPPINESS OF MARRIAGE
Description of the Variable
158. Taking all things together, how would you describe your
marriage?
Percent
63.4
33.7
3.0
100.0
N
17,971
9,549
842
31,041
49
147
59,599
Value
1
2
3
0
8
9
Label
VERY HAPPY
PRETTY HAPPY
NOT TOO HAPPY
IAP
DK
NA
Total
Use Figure 2.1 to answer the following 3 questions.
1. Which of the following best describes the modal category for the variable,
HAPMAR?
*a. Very happy
b. Pretty happy
c. Not too happy
2. The variable, HAPMAR, is best described as what type of variable?
Instructor Resource
Harnois, Analyzing Inequalities
SAGE Publishing, 2018
a. A dummy variable.
*b. An ordinal-level variable.
c. An interval-ratio level variable.
3. The number 31,041 in Figure 2.1 indicates that:
a. 31,041 respondents refused to answer when questioned about their level of
marital happiness
*b. 31,041 respondents were not asked about their level of marital happiness
c. 31,041 respondents provided valid responses when asked about their level
of marital happiness
d. 31,041 respondents were married.
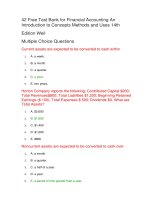
Use Figure 2.2 to answer the following 3 questions.
Figure 2.2
VOLMONTH
VOLUNTEER IN LAST MONTH
Description of the Variable
In the past month, did you do any volunteer activity through organizations,
that is donate your time and energy not for pay?
Percent
34.9
65.1
100.0
N
895
1,668
57,017
5
14
59,599
Value
1
2
0
8
9
Label
Yes
No
IAP
DON'T KNOW
No answer
Total
4. The variable, VOLMONTH, is best described as what type of variable?
Instructor Resource
Harnois, Analyzing Inequalities
SAGE Publishing, 2018
*a. A dummy variable.
b. An ordinal-level variable.
c. An interval-ratio level variable.
5. How many respondents indicated that they had done volunteer activity through an
organization, in the past month?
*a. 895
b. 1668
c. 57,017
d. 59,599
6. Of those who provided valid responses, what percent of respondents indicated
they did NOT participate in volunteer activity through an organization, in the past
month?
a. 34.9%
*b. 65.1%
c. 100%
d. This information is not provided in the table.
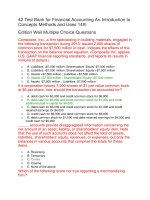
Use Figure 2.3 to answer the following questions.
7. The variable EDUC, SHOWN IN FIGURE 2.3, corresponds to the number of
years of formal education that a respondent has. This variable is best described as
a(n):
a. Nominal-level variable.
b. Dummy variable.
Instructor Resource
Harnois, Analyzing Inequalities
SAGE Publishing, 2018
c. Ordinal-level variable.
*d. Interval-ratio-level variable.
Figure 2.3
EDUC
HIGHEST YEAR OF SCHOOL COMPLETED
Description of the Variable
15. What is the highest grade of school you completed?
Percent
0.3
0.1
0.2
0.4
0.5
0.7
1.3
1.4
4.4
3.3
4.6
5.9
30.6
8.3
10.9
4.5
12.5
3.0
3.6
1.4
2.1
100.0
N
159
42
145
244
312
395
777
853
2,641
1,973
2,725
3,530
18,182
4,935
6,488
2,646
7,440
1,762
2,116
812
1,257
70
95
59,599
Value
0
1
2
3
4
5
6
7
8
9
10
11
12
13
14
15
16
17
18
19
20
98
99
Properties
Data type:
numeric
Label
DK
NA
Total
Instructor Resource
Harnois, Analyzing Inequalities
SAGE Publishing, 2018
Missing-data codes: 97,98,99
Mean:
12.79
Std Dev:
3.18
Record/columns: 1/144-145
8. Using the information presented in Figure 2.3, approximately what percentage of
GSS respondents indicated that they have16 years of education?
a. 7.4%
*b. 12.5%
c. 30.6%
d. 50%
9. Using the information presented in Figure 2.3, what is the average number of
years of education that respondents report having?
a. 3.18
b. 12.0
* c. 12.79
d. 97
10. Which of the following statements is NOT correct, according to Figure 2.3?
a. Among the GSS respondents, the category with the highest number of responses is
“12 years of education”
b. Most respondents have fewer than 16 years of education
*c. 70 respondents report having 98 years of formal education.
d. All of the above are true, based on the information presented in Figure 2.3