Complex network analysis in python recognize, construct, visualize, analyze, interpret
Bạn đang xem bản rút gọn của tài liệu. Xem và tải ngay bản đầy đủ của tài liệu tại đây (16.73 MB, 243 trang )
Early Praise for Complex Network Analysis in Python
This book is an excellent read for anyone who wants to learn the fundamentals
of complex network analysis with a focus on application. The case studies cover
a variety of topics and help readers link concepts to applications, providing readers
with a clear, well-structured, hands-on experience that deepens their understanding of the concepts without requiring Python programming experience.
➤ Kate Li, PhD
Associate Professor, Sawyer Business School, Suffolk University
As a social scientist interested in network analysis but having limited knowledge
of Python, I found the book very useful. The author explains technical problems
in a way that is easy to understand for non–computer scientists. It is a great introduction for those interested in network analysis seeking to apply the method
in their research.
➤ Weiqi Zhang
Associate Professor of Government, Suffolk University
Complex Network Analysis in Python is a thorough introduction to the tools and
techniques needed for complex network analysis. Real-world case studies
demonstrate how one can easily use powerful Python packages to analyze large
networks and derive meaningful analytic insights.
➤ Mike Lin
Senior Software Engineer, Fugue, Inc.
Having a deep understanding of complex network analysis is hard; however, this
book will help you learn the basics to start mastering the skills you need to analyze
complex networks, not only at a conceptual level, but also at a practical level, by
putting the theory into action using the Python programming language.
➤ Jose Arturo Mora
Head of Information Technology and Innovation, BNN Mexico
Complex networks have diverse applications in various fields, including health
care, social networks, and machine learning. I found this book to be an excellent
and comprehensive resource guide for researchers, students, and professionals
interested in applying complex networks.
➤ Rajesh Kumar Pandey
Graduate Student, IIT Hyderabad
Complex Network Analysis in Python
Recognize → Construct → Visualize → Analyze → Interpret
Dmitry Zinoviev
The Pragmatic Bookshelf
Raleigh, North Carolina
Many of the designations used by manufacturers and sellers to distinguish their products
are claimed as trademarks. Where those designations appear in this book, and The Pragmatic
Programmers, LLC was aware of a trademark claim, the designations have been printed in
initial capital letters or in all capitals. The Pragmatic Starter Kit, The Pragmatic Programmer,
Pragmatic Programming, Pragmatic Bookshelf, PragProg and the linking g device are trademarks of The Pragmatic Programmers, LLC.
Every precaution was taken in the preparation of this book. However, the publisher assumes
no responsibility for errors or omissions, or for damages that may result from the use of
information (including program listings) contained herein.
Our Pragmatic books, screencasts, and audio books can help you and your team create
better software and have more fun. Visit us at .
The team that produced this book includes:
Publisher: Andy Hunt
VP of Operations: Janet Furlow
Managing Editor: Brian MacDonald
Supervising Editor: Jacquelyn Carter
Development Editor: Adaobi Obi Tulton
Copy Editor: Nicole Abramowitz
Indexing: Potomac Indexing, LLC
Layout: Gilson Graphics
For sales, volume licensing, and support, please contact
For international rights, please contact
Copyright © 2018 The Pragmatic Programmers, LLC.
All rights reserved.
No part of this publication may be reproduced, stored in a retrieval system, or transmitted,
in any form, or by any means, electronic, mechanical, photocopying, recording, or otherwise,
without the prior consent of the publisher.
Printed in the United States of America.
ISBN-13: 978-1-68050-269-5
Encoded using the finest acid-free high-entropy binary digits.
Book version: P1.0—January 2018
To my beautiful and most intelligent wife,
Anna, and to our children: graceful ballerina,
Eugenia, and romantic gamer, Roman.
Contents
Acknowledgments
Preface .
.
.
1.
.
.
.
.
.
.
.
.
.
.
.
.
.
.
.
.
.
.
The Art of Seeing Networks
.
.
.
.
.
Know Thy Networks
Enter Complex Network Analysis
Draw Your First Network with Paper and Pencil
.
.
.
.
xi
xiii
.
1
2
5
6
.
.
.
Part I — Elementary Networks and Tools
2.
Surveying the Tools of the Craft .
Do Not Weave Your Own Networks
Glance at iGraph
Appreciate the Power of graph-tool
Accept NetworkX
Keep in Mind NetworKit
Compare the Toolkits
.
.
.
.
.
.
.
11
11
12
13
15
15
16
3.
Introducing NetworkX
.
.
.
.
.
Construct a Simple Network with NetworkX
Add Attributes
Visualize a Network with Matplotlib
Share and Preserve Networks
.
.
.
.
.
17
17
23
25
29
4.
Introducing Gephi
.
.
.
.
.
.
.
.
Worth 1,000 Words
Import and Modify a Simple Network with Gephi
Explore the Network
Sketch the Network
.
.
.
31
31
32
34
36
Contents
Prepare a Presentation-Quality Image
Combine Gephi and NetworkX
5.
• viii
38
40
Case Study: Constructing a Network of Wikipedia Pages .
Get the Data, Build the Network
Eliminate Duplicates
Truncate the Network
Explore the Network
.
41
42
45
46
47
Part II — Networks Based on Explicit Relationships
6.
Understanding Social Networks .
.
.
.
.
Understand Egocentric and Sociocentric Networks
Recognize Communication Networks
Appreciate Synthetic Networks
Distinguish Strong and Weak Ties
.
.
53
53
61
63
66
7.
Mastering Advanced Network Construction .
.
.
.
Create Networks from Adjacency and Incidence Matrices
Work with Edge Lists and Node Dictionaries
Generate Synthetic Networks
Slice Weighted Networks
.
69
69
76
78
79
8.
Measuring Networks .
.
.
.
.
.
.
.
Start with Global Measures
Explore Neighborhoods
Think in Terms of Paths
Choose the Right Centralities
Estimate Network Uniformity Through Assortativity
.
83
83
84
88
92
97
9.
Case Study: Panama Papers
.
.
.
Create a Network of Entities and Officers
Draw the Network
Analyze the Network
Build a “Panama” Network with Pandas
.
.
.
.
.
.
.
.
101
101
104
105
108
.
.
115
116
120
Part III — Networks Based on Co-Occurrences
10. Constructing Semantic and Product Networks
Semantic Networks
Product Networks
.
.
Contents
11. Unearthing the Network Structure .
.
.
Locate Isolates
Split Networks into Connected Components
Separate Cores, Shells, Coronas, and Crusts
Extract Cliques
Recognize Clique Communities
Outline Modularity-Based Communities
Perform Blockmodeling
Name Extracted Blocks
.
• ix
.
.
.
125
125
126
129
131
134
136
138
139
12. Case Study: Performing Cultural Domain Analysis
Get the Terms
Build the Term Network
Slice the Network
Extract and Name Term Communities
Interpret the Results
.
.
.
141
142
146
147
148
150
13. Case Study: Going from Products to Projects
Read Data
Analyze the Networks
Name the Components
.
.
.
.
153
153
155
157
Part IV — Unleashing Similarity
14. Similarity-Based Networks .
Understand Similarity
Choose the Right Distance
.
.
.
.
.
.
.
.
163
163
167
.
.
.
.
.
.
175
176
178
181
16. Case Study: Building a Network of Trauma Types
Embark on Psychological Trauma
Read the Data, Build a Bipartite Network
Build Four Weighted Networks
Plot and Compare the Networks
.
.
.
185
185
186
188
191
15. Harnessing Bipartite Networks .
.
Work with Bipartite Networks Directly
Project Bipartite Networks
Compute Generalized Similarity
Contents
•x
Part V — When Order Makes a Difference
17. Directed Networks .
.
.
.
.
.
.
.
Discover Asymmetric Relationships
Explore Directed Networks
Apply Topological Sort to Directed Acyclic Graphs
Master “toposort”
.
.
.
197
197
199
203
204
A1. Network Construction, Five Ways
Pure Python
iGraph
graph-tool
NetworkX
NetworKit
.
.
.
.
.
.
.
209
209
210
211
212
212
A2. NetworkX 2.0
Bibliography
Index .
.
.
.
.
.
.
.
.
.
.
.
.
.
213
.
.
.
.
.
.
.
.
.
.
.
.
.
.
.
.
.
.
.
.
.
.
.
.
215
219
Acknowledgments
This book would not be possible without my editor, Adaobi Obi Tulton. She had
the courage to learn the dark inner secrets of complex network analysis and
guided me through the minefields of manuscript preparation, from the fuzzy
ideas at the onset to this very book in flesh and blood. Thank you, Adaobi.
I am grateful to my reviewers (in alphabetical order): Cody Buntain (University
of Maryland), Remy Cazabet (Lyon University), Mark Chu-Carroll (Imagen
Technologies), Raphaël Fournier-S’niehotta (CÉDRIC), Michael Lin (Fugue
Inc.), Jason Montojo (University of Toronto), Jose Arturo Mora (EY, BNN
Mexico), Prasham Ojha (University of Koblenz-Landau), Talha Oz (George
Mason University), and Rajesh Kumar Pandey (Gade Autonomous Systems).
Your reviews were indispensable. They profoundly affected the book’s style,
structure, and usability. Thank you, my reviewers.
My wife, Anna; my children, Eugenia and Roman; and my friends and colleagues from Suffolk University provided much-needed emotional support.
Writing a book is a quest. It feels good to be well supported. Thank you, my
supporters.
Last but not least, the early readers of the beta book provided the errata
requests. Errare humanum est, but the book is better without errors. Thank
you, my early readers.
report erratum • discuss
Thou wilt set forth at once because the journey is far and lasts for many hours; but
the hours on the velvet spaces are the hours of the gods, and we may not say what
time such an hour may be if reckoned in mortal years.
➤ Lord Dunsany, Anglo-Irish writer and dramatist
Preface
In science, technology, and mathematics, a network is a system of interconnected objects. Complex network analysis (CNA) is a discipline of exploring
quantitative relationships in the networks with non-trivial, irregular structure.
The actual nature of the networks (social, semantic, transportation, communication, economic, and the like) doesn’t matter, as long as their organization
doesn’t reveal any specific patterns. This book was inspired by a decade of
CNA practice and research.
Being a professor of mathematics and computer science at Suffolk University
in Boston, I have experimented with complex networks of various sizes, purposes, and origins. I developed my first CNA software in an ad hoc manner
in the C language—the language venerable yet ill-suited for CNA projects.
The price of explicit memory management, cumbersome file input/output,
and lack of advanced built-in data structures (such as maps and lists) was
simply too high to justify a further commitment to C. At the moment I realized
that there were affordable alternatives to C that did not require low-level
programming (such as Pajek [NMB11] and Mathematica1), off I went.
Both systems that I mentioned had significant restrictions. Mathematica was
proprietary (and, frankly, quite costly). My inner open source advocate
demanded that I cease and desist using it, especially given that earlier versions
of Mathematica didn’t provide dedicated CNA support and failed to handle
big networks. Pajek was proprietary, too, and not programmable. It took a
joint effort of my inner open source advocate and inner programmer to push
it to the periphery. (I still occasionally use Pajek, and I believe it’s a great
system for solving non-recurring problems.)
I felt delighted when, in search of open source, free, scalable, reliable, and
programmable CNA software, I ran into NetworkX, a Python library still in its
infancy. For the next several years, it became my tool of choice when it came
to CNA simulation, analysis, or visualization.
1.
www.wolfram.com/mathematica
report erratum • discuss
Preface
• xiv
About the Reader
This book is intended for graduate and undergraduate students, complex
data analysis (CNA) or social network analysis (SNA) instructors, and CNA/SNA
researchers and practitioners. The book assumes that you have some background in computer programming—namely, in Python programming. It expects
from you no more than common sense knowledge of complex networks. The
intention is to build up your CNA programming skills and at the same time
educate you about the elements of CNA itself. If you’re an experienced Python
programmer, you can devote more attention to the CNA techniques. On the
contrary, if you’re a network analyst with less than an excellent background
in Python programming, your plan should be to move slowly through the dark
woods of data frames and list comprehensions and use your CNA intuition
to grasp programming concepts.
About the Book
This book covers construction, exploration, analysis, and visualization of
complex networks using NetworkX (a Python library), as well as several other
Python modules, and Gephi, an interactive environment for network analysts.
The book is not an introduction to Python. I assume that you already know
the language, at least at the level of a freshman programming course.
The book consists of five parts, each covering specific aspects of complex
networks. Each part comes with one or more detailed case studies.
Part I presents an overview of the main Python CNA modules: NetworkX, iGraph,
graph-tool, and networkit. It then goes over the construction of very simple networks both programmatically (using NetworkX) and interactively (in Gephi), and
it concludes by presenting a network of Wikipedia pages related to complex
networks.
In Part II, you’ll look into networks based on explicit relationships (such as
social networks and communication networks). This part addresses advanced
network construction and measurement techniques. The capstone case study
—a network of “Panama papers”—illustrates possible money-laundering patterns in Central Asia.
Networks based on spatial and temporal co-occurrences—such as semantic
and product networks—are the subject of Part III. The third part also explores
macroscopic and mesoscopic complex network structure. It paves the way to
network-based cultural domain analysis and a marketing study of Sephora
cosmetic products.
report erratum • discuss
About the Software
• xv
If you cannot find any direct or indirect relationships between the items, but
still would like to build a network of them, the contents of Part IV come to
the rescue. You will learn how to find out if items are similar, and you will
convert quantitative similarities into network edges. A network of psychological trauma types is one of the outcomes of the fourth part.
The book concludes with Part V: directed networks with plenty of examples,
including a network of qualitative adjectives that you could use in computer
games or fiction.
When you finish your journey, you’ll be able to identify, sketch (both by hand,
in Gephi, and programmatically), transform, analyze, and visualize several
types of complex networks. You’ll be able to interpret network measures and
structure. The book doesn’t aim to be a comprehensive CNA reference. Many
discipline-specific aspects, such as triadic census, exponential random graph
models (ERGMs), and network flows, as well as the whole story of network
dynamics (evolution and contagion), have been intentionally left uncharted.
The bibliography on page 215 will take you to more destinations of your choice,
whether they be economic networks, web scrapping, or classical social network
analysis.
About the Software
This book uses Python 3.x and networkx 1.11. All Python examples in this book
are known to work for the modules mentioned in the following table. All of these
modules are included in the Anaconda distribution, with the exception of commu2
3
4
5
nity, toposort, wikipedia, and generalized, which must be installed separately.
Anaconda is provided by Continuum Analytics and is available for free.6
Package
Used version
Package
Used version
python
3.4.5
networkx
1.11
matplotlib
1.5.1
community
0.9
nltk
3.2.2
numpy
1.11.3
pandas
0.19.2
pygraphviz
1.3.1
wikipedia
1.4
scipy
0.18.1
toposort
1.5
2.
3.
4.
5.
6.
pypi.python.org/pypi/python-louvain
pypi.python.org/pypi/toposort
pypi.python.org/pypi/wikipedia
pragprog.com/titles/dzcnapy/source_code
www.continuum.io
report erratum • discuss
Preface
• xvi
The easiest way to install the missing modules is by running pip on your
operating system shell command line.
➾
➾
➾
➾
pip
pip
pip
pip
install
install
install
install
toposort
wikipedia
python-louvain
pygraphviz
If you want to use module pygraphviz to layout networks, you first need to install
7
Graphviz (including the developers add-on graphviz-dev).
In September 2017, a new version of NetworkX was released, NetworkX 2.0.
Appendix 2, NetworkX 2.0, on page 213 provides useful information about
converting your CNA scripts to the new version.
About the Notation
The following covers the specific notation used in this book.
Program Output
The book uses a left-pointed gray arrow in the left margin of a page to indicate
program outputs. In the following scenario, print(1 + 2) is a Python statement,
and 3 is the visual output of the statement.
print(1 + 2)
❮ 3
“This Chapter Uses X”
“This chapter/section uses X” informs you that the material
This chapter uses X
in the chapter or section goes beyond the core Python and
NetworkX. If you’re unfamiliar with X, you’ll probably understand the content
but may experience difficulties with comprehending the included code snippets. You’re advised to refresh your knowledge of the listed modules.
Directed Edges
NetworkX uses module Matplotlib for network visualization. You would expect
directed edges to have an arrow at the head end, and Matplotlib fully supports
arrows. However, NetworkX draws thick rectangular stubs instead. This is just
something you’ll have to get used to. If you need a publication-quality network
image with arrows, consider using Gephi.
7.
www.graphviz.org/
report erratum • discuss
Online Resources
• xvii
Online Resources
This book has its own web page8 where you can find all the code for this book.
There you’ll also find the community forum, where you can ask questions,
post comments, and submit errata.
Two other great community-operated resources for questions and answers
are the Stack Overflow forum9 and NetworkX Google discussion group.10
Now, let’s get started!
Dmitry Zinoviev
January 2018
8. pragprog.com/book/dzcnapy
9. stackoverflow.com/questions/tagged/networkx
10. groups.google.com/forum/#!forum/networkx-discuss
report erratum • discuss
When all you have is a hammer, everything looks like a nail.
➤ Proverb
CHAPTER 1
The Art of Seeing Networks
Complex network analysis (CNA) is a rapidly expanding discipline that studies
how to recognize, describe, analyze, and visualize complex networks. The
Python library NetworkX provides a collection of functions for constructing,
measuring, and drawing complex networks. We’ll see in this book how CNA
and NetworkX work together to automate mundane and tedious CNA tasks and
make it possible to study complex networks of varying sizes and at varying
levels of detail.
At this point, you may be wondering what a network is, why some networks
are complex, why it is important to recognize, describe, analyze, and visualize
them, and why the discipline is expanding right now instead of having
expanded, say, a hundred years ago. If you’re not, then you’re probably a
seasoned complex network researcher, and you may want to skip the rest of
this chapter and proceed to the CNA and Python technicalities (Chapter 2,
Surveying the Tools of the Craft, on page 11). Otherwise, stay with us!
Complex networks, like mathematics, physics, and biology, have been in existence for at least as long as we humans have. Biological complex networks, in
fact, predate humankind. However, intensive studies of complex networks did
not start until the late 1800s to early 1900s, mostly because of the lack of
proper mathematical apparatus (graph theory, in the first place) and adequate
computational tools. The reason for the explosion of CNA research and applications in the late 1900s–early 2000s is two-fold. On the “supply” side, it is the
availability of cheap and powerful computers and the abundance of researchers
with advanced training in mathematics, physics, and social sciences. On the
“demand” side, it is the ever increasing complexity of social, behavioral, biological, financial, and technological (to name a few) aspects of humanity.
In this chapter, you will see different types and kinds of networks (including
complex networks) and learn why networks are important and why it is worth
report erratum • discuss
Chapter 1. The Art of Seeing Networks
•2
seeing them around. You will be able to spot complex networks, capture them
—so far, without any software—and get some sense about their useful properties (again, with no software necessary). When you see the limitations of
the paper-and-pencil method, you will be ready to dive into the computerized
proper complex network analysis.
Know Thy Networks
In general, a network is yet another—relational—form of organization and
representation of discrete data. (The other one being tabular, with the data
organized in rows and columns.) Two important network concepts are entities
and the relationships between them. Depending on a researcher’s background,
entities are known as nodes (the term we’ll use in this book), actors, or vertices. Relationships are known as edges (preferred in this book), links, arcs,
or connections. We will casually refer to networks as “graphs” (in the graphtheoretical meaning of the word), even though graphs are not the only way
to describe networks.
Graphs and Graphs
When it comes to mathematics, the word “graph” has at least two
different meanings. In algebra and calculus, a graph of a function
is a continuous line chart or surface plot. In graph theory, a graph
is a set of discrete objects (vertices, depicted diagrammatically as
dots), possibly joined by edges (depicted as lines or arcs). We will
always use the latter definition unless explicitly stated.
Network nodes and edges are high-level abstractions. For many types of network analysis, their true nature is not essential. (When it is, we decorate
nodes and edges by adding properties, also known as attributes.) What matters
is the discreteness of the entities and the binarity of the relationships. A discrete entity must be separable from all other entities—otherwise, it is not
clear how to represent it as a node. A relationship typically involves two discrete entities; in other words, any two entities either are in a relationship or
not. (An entity can be in a relationship with itself. Such a relationship is called
reflexive.) It is not directly possible to use networks to model relationships
that involve more than two entities, but if such modeling is really necessary,
then you can use hypergraphs, which are beyond the scope of this book.
Once all of the above conditions are met, you can graphically represent and
visualize a node as a point or circle and an edge as a line or arc segment. You
can further express node and edge attributes by adding line thickness, color,
different shapes and sizes, and the like.
report erratum • discuss
Know Thy Networks
•3
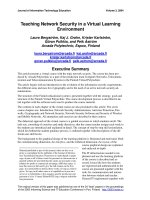
Let’s have a look at some really basic—so-called “classic”—networks.
In a checkerboard, each field is an entity (node) with three attributes: “color”
(“black” or white”), “column” (“A” through “H”), and “row” (1 through 8).
“Being next to” is the relationship between two entities. There is an edge
connecting two nodes if the nodes “are next to” each other. As a matter
of fact, “being next to” is one of the foundational relationships that leads
to spatial networks. You can see a “checkerboard” network, also known
as a mesh or grid, in the following figure.
A1
C3
C2
C1
E3
E2
E1
G3
G2
G1
H1
G4
H2
H3
H4
H5
G8
G7
G6
G5
F8
F7
F6
F5
F4
F3
F2
F1
E4
E8
E7
E6
E5
D8
D7
D6
D5
D4
D3
D2
D1
C4
C8
C7
C6
C5
B8
B7
B6
B5
B4
B3
B2
B1
A4
A3
A2
A6
A5
A8
A7
H6
H7
H8
In a timeline of our life, each life event (such as “birth,” “high school graduation,”
“marriage,” and eventually “death”) is an entity with at least one attribute:
“time.” “Happening immediately after” is the relationship: an edge connects
two events if one event occurs immediately after the other, leading to a
network of events. Unlike “being next to,” “happening immediately after”
is not symmetric: if A happened immediately after B (there is an edge from
A to B), then B did not happen after A (there is no reverse edge).
In a family tree, each person in the tree is an entity, and the relationship could
be either being “a descendant of” or “an ancestor of” (asymmetric). A
family tree network is neither spatial nor strictly temporal: the nodes are
not intrinsically arranged in space or time.
report erratum • discuss
Chapter 1. The Art of Seeing Networks
•4
In a hierarchical system that consists of parts, sub-parts, and sub-sub-parts
(such as this book), a part at any level of the hierarchy is an entity. The
relationship between the entities is “a part of”: a paragraph is “a part of”
a subsection, which is “a part of” a section, which is “a part of” a chapter,
which is “a part of” a book.
All the networks listed previously are simple because they have a regular or
almost regular structure. A checkerboard is a rectangular grid. A timeline is a
linear network. A family tree is a tree, and such is a network of a hierarchical
system (a special case of a tree with just one level of branches is called a star).
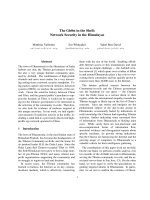
The following figure shows more simple networks: a linear timeline of Abraham
Lincoln (A.L.), his family tree, and a ring of months in a year. (A ring is another
simple network, which is essentially a linear network, wrapped around.)
Robert Todd L.Mary
Beckwith
L. Beckwith
Jessie Harlan L.
DecemberNovember
October
January
September
February
August
March
July
April
May June
L. Isham Mary L.
Robert ToddWilliam
L.
Wallace L.
A.L. II
A.L. Thomas L. III
Edward Baker L.
Thomas L.
Sarah L. Grigsby
Thomas L. Jr.
Died 1865
Elected President 1861
Elected Representative 1847
Married 1842
Born 1809
Make no mistake: a simple network is simple not because it is small, but
because it is regular. For example, any ring node always has two neighbors;
any tree node (except for the root) has exactly one antecedent; any inner grid
node has exactly four neighbors, two of which are in the same row and the
other two in the same column. The complete world timeline has billions of
events. The humankind “family tree” has billions of individuals. We still consider these networks simple.
What is a complex network, then?
report erratum • discuss
Enter Complex Network Analysis
•5
A complex network has a non-trivial structure. It is not a grid, not a tree, not a
ring—but it is not entirely random, either. Complex networks emerge in nature
and the man-made world as a result of decentralized processes with no global
control. One of the most common mechanisms is the preferential attachment
(Emergence of Scaling in Random Networks [BA99]), whereby nodes with more
edges get even more edges, forming gigantic hubs in the core, surrounded by
the poorly connected periphery. Another evolutionary mechanism is transitive
closure, which connects two nodes together if they are already connected to a
common neighbor, leading to densely interconnected network neighborhoods.
Let’s glance at some complex networks. The following table shows the major
classes of complex networks and some representatives from each class.
Technological networks
Communication systems; transportation; the
Internet; electric grid; water mains
Biological/ecological
networks
Food webs; gene/protein interactions; neural
system; disease epidemics
Economic networks
Financial transactions; corporate partnerships;
international trade; market basket analysis
Social networks
Families and friends; email/SMS exchanges;
professional groups
Cultural networks
Language families; semantic networks; literature,
art, history, religion networks (emerging fields)
The networks in the table pertain to diverse physical, social, and informational
aspects of human life. They consist of various nodes and edges, some material
and some purely abstract. However, all of them have common properties and
behaviors that can be found in complex networks and only in complex networks, such as community structure, evolution by preferential attachment,
and power law degree distribution.
Enter Complex Network Analysis
Complex network analysis (CNA), which is the study of complex networks—
their structure, properties, and dynamics—is a relatively new discipline, but
with a rich history.
You can think of CNA as a generalization of social network analysis (SNA) to
include non-social networks.
Social networks—descriptors of social structures through interactions—have
been known as “social groups” since the late 1890s. Their systematic exploration began in the 1930s. In 1934, J.L. Moreno (Who Shall Survive? [Mor34])
report erratum • discuss
Chapter 1. The Art of Seeing Networks
•6
developed sociograms—graph drawings of social networks. Eventually,
sociograms became the de facto standard of complex network visualization.
John Barnes coined the term “SNA” in 1954 (Class and Committees in a
Norwegian Island Parish [Bar54]). Around the same time, rapid penetration
of mathematical methods into social sciences began, leading to the emergence
of SNA as one of the leading paradigms in contemporary sociology.
Social network analysis addresses social networks at three levels: microscopic,
mesoscopic, and macroscopic. At the microscopic level, we view a network as
an assembly of individual nodes, dyads (pairs of connected nodes; essentially,
edges), triads (triples of nodes, connected in a triangular way), and subsets
(tightly knit groups of nodes). A mesoscopic view focuses on exponential random
graph models (ERGMs), scale-free and small-world networks, and network
evolution. Finally, at the macroscopic level, the more general complex network
analysis fully absorbs SNA, abstracting from the social origins of social networks
and concentrating on the properties of very large real-world graphs, such as
degree distribution, assortativity, and hierarchical structure (Exploring Complex
Networks [Str01]). You will see the definitions and explanations of some of
these properties and the Python ways of calculating them later in the book.
But first, let’s get your hands dirty (possibly physically dirty) and sketch a
real complex network on a sheet of paper.
Draw Your First Network with Paper and Pencil
Just like networks with regular topology, complex networks are not necessarily large. In fact, they are not even “complex” in the colloquial meaning of the
word. We can easily spot them without any specialized hardware or software;
a pair of inquisitive eyes, a sheet of paper, and a pencil often suffice.
As a proof of concept, let’s do an exercise in network construction (just construction, no analysis so far!). We are deeply convinced that complex networks
are everywhere; rephrasing the quote, incorrectly attributed to Michelangelo,
“all we have to do is to chip away everything that is not a complex network.”
All people on Earth, including current and prospective complex network
analysts, deserve healthy nutrition. To help them build a balanced diet in
an utterly networked way, you will use a list of foods that provide naturally
occurring nutrients.1 The data on the website is somewhat contradictory,
1.
The document was originally found at www.sharecare.com/health/nutrition-diet/which-foods-naturallyoccurring-nutrients but does not seem to be there anymore; it is cached as nutrients.txt at
pragprog.com/book/dzcnapy.
report erratum • discuss
Draw Your First Network with Paper and Pencil
•7
as is often the case with real-world data. For example, in one list item, the
authors refer to “shellfish,” and in another, to “seafood.” It is not clear if
freshwater crayfish is meant to be “seafood” or not, but let us not worry about
the strict biological taxonomy and make reasonable assumptions, whenever
necessary.
Your first step is to identify discrete entities. The dataset has two potential
candidates for entities (and, therefore, network nodes): foods (such as fish
and eggs) and nutrients (such as vitamins A and C). You could construct a
network of foods or a network of nutrients. However, you can shoot two birds
with one stone and create a network of both nutrients and foods (a so-called
bipartite network—more on them in Chapter 15, Harnessing Bipartite Networks, on page 175). The nodes will be of two types, but don’t worry about this
heterogeneity now.
The relationship between digestive items is described by the verb “provides”
or “is provided”: certain food X provides nutrients Y1, Y2, and so on, and
certain nutrient Y is provided by certain foods X1, X2, and so on.
Now, take a sheet of paper and a pencil and transcribe the list of food and
nutrient items into a network, as follows:
1. Choose the first nutrient from the list—say, it is vitamin D. Draw a circle
that represents vitamin D and label it “D.”
2. Vitamin D is provided by fatty fish; draw a circle that represents fatty
fish, label it “fatty fish,” and connect to the “D” node.
3. Vitamin D is also provided by mushrooms; draw a circle that represents
mushrooms, label it “mushrooms,” and connect to the “D” node.
4. Repeat the previous steps for each combination of food types and nutrients. Do not duplicate nodes! If a nutrient is provided by the food type
that already has a node, connect the nutrient to the existing node.
The method of starting with a “seed” node and following the edges to discover
other nodes is called snowball sampling (“snowballing”). Your network starts
as a single snowflake and grows over time until either you are happy with its
size or there is no more “snow” to add. Beware: snowballing may overlook
small and medium-size network chunks if you choose an improper seed. To
mitigate potential problems in networks that consist of several disjointed
parts (so-called unconnected graphs), it might be best to select several seeds
and follow all edges originating from them.
report erratum • discuss