Data science on the google cloud platform implementing real time data pipelines, from ingest to machine learning
Bạn đang xem bản rút gọn của tài liệu. Xem và tải ngay bản đầy đủ của tài liệu tại đây (14.62 MB, 409 trang )
Data Science on the Google Cloud
Platform
Implementing End-to-End Real-Time Data Pipelines: From Ingest to
Machine Learning
Valliappa Lakshmanan
Data Science on the Google Cloud Platform
by Valliappa Lakshmanan
Copyright © 2018 Google Inc. All rights reserved.
Printed in the United States of America.
Published by O’Reilly Media, Inc., 1005 Gravenstein Highway North, Sebastopol, CA 95472.
O’Reilly books may be purchased for educational, business, or sales promotional use. Online
editions are also available for most titles ( For more information, contact
our corporate/institutional sales department: 800-998-9938 or
Editor: Tim McGovern
Production Editor: Kristen Brown
Copyeditor: Octal Publishing, Inc.
Proofreader: Rachel Monaghan
Indexer: Judith McConville
Interior Designer: David Futato
Cover Designer: Karen Montgomery
Illustrator: Rebecca Demarest
January 2018: First Edition
Revision History for the First Edition
2017-12-12: First Release
See for release details.
The O’Reilly logo is a registered trademark of O’Reilly Media, Inc. Data Science on the Google
Cloud Platform, the cover image, and related trade dress are trademarks of O’Reilly Media, Inc.
While the publisher and the author have used good faith efforts to ensure that the information and
instructions contained in this work are accurate, the publisher and the author disclaim all
responsibility for errors or omissions, including without limitation responsibility for damages
resulting from the use of or reliance on this work. Use of the information and instructions contained in
this work is at your own risk. If any code samples or other technology this work contains or describes
is subject to open source licenses or the intellectual property rights of others, it is your responsibility
to ensure that your use thereof complies with such licenses and/or rights.
978-1-491-97456-8
[LSI]
Preface
In my current role at Google, I get to work alongside data scientists and data engineers in a variety of
industries as they move their data processing and analysis methods to the public cloud. Some try to do
the same things they do on-premises, the same way they do them, just on rented computing resources.
The visionary users, though, rethink their systems, transform how they work with data, and thereby are
able to innovate faster.
As early as 2011, an article in Harvard Business Review recognized that some of cloud computing’s
greatest successes come from allowing groups and communities to work together in ways that were
not previously possible. This is now much more widely recognized—an MIT survey in 2017 found
that more respondents (45%) cited increased agility rather than cost savings (34%) as the reason to
move to the public cloud.
In this book, we walk through an example of this new transformative, more collaborative way of
doing data science. You will learn how to implement an end-to-end data pipeline—we will begin
with ingesting the data in a serverless way and work our way through data exploration, dashboards,
relational databases, and streaming data all the way to training and making operational a machine
learning model. I cover all these aspects of data-based services because data engineers will be
involved in designing the services, developing the statistical and machine learning models and
implementing them in large-scale production and in real time.
Who This Book Is For
If you use computers to work with data, this book is for you. You might go by the title of data analyst,
database administrator, data engineer, data scientist, or systems programmer today. Although your
role might be narrower today (perhaps you do only data analysis, or only model building, or only
DevOps), you want to stretch your wings a bit—you want to learn how to create data science models
as well as how to implement them at scale in production systems.
Google Cloud Platform is designed to make you forget about infrastructure. The marquee data
services—Google BigQuery, Cloud Dataflow, Cloud Pub/Sub, and Cloud ML Engine—are all
serverless and autoscaling. When you submit a query to BigQuery, it is run on thousands of nodes, and
you get your result back; you don’t spin up a cluster or install any software. Similarly, in Cloud
Dataflow, when you submit a data pipeline, and in Cloud Machine Learning Engine, when you submit
a machine learning job, you can process data at scale and train models at scale without worrying
about cluster management or failure recovery. Cloud Pub/Sub is a global messaging service that
autoscales to the throughput and number of subscribers and publishers without any work on your part.
Even when you’re running open source software like Apache Spark that’s designed to operate on a
cluster, Google Cloud Platform makes it easy. Leave your data on Google Cloud Storage, not in
HDFS, and spin up a job-specific cluster to run the Spark job. After the job completes, you can safely
delete the cluster. Because of this job-specific infrastructure, there’s no need to fear overprovisioning
hardware or running out of capacity to run a job when you need it. Plus, data is encrypted, both at rest
and in transit, and kept secure. As a data scientist, not having to manage infrastructure is incredibly
liberating.
The reason that you can afford to forget about virtual machines and clusters when running on Google
Cloud Platform comes down to networking. The network bisection bandwidth within a Google Cloud
Platform datacenter is 1 PBps, and so sustained reads off Cloud Storage are extremely fast. What this
means is that you don’t need to shard your data as you would with traditional MapReduce jobs.
Instead, Google Cloud Platform can autoscale your compute jobs by shuffling the data onto new
compute nodes as needed. Hence, you’re liberated from cluster management when doing data science
on Google Cloud Platform.
These autoscaled, fully managed services make it easier to implement data science models at scale—
which is why data scientists no longer need to hand off their models to data engineers. Instead, they
can write a data science workload, submit it to the cloud, and have that workload executed
automatically in an autoscaled manner. At the same time, data science packages are becoming simpler
and simpler. So, it has become extremely easy for an engineer to slurp in data and use a canned model
to get an initial (and often very good) model up and running. With well-designed packages and easyto-consume APIs, you don’t need to know the esoteric details of data science algorithms—only what
each algorithm does, and how to link algorithms together to solve realistic problems. This
convergence between data science and data engineering is why you can stretch your wings beyond
your current role.
Rather than simply read this book cover-to-cover, I strongly encourage you to follow along with me
by also trying out the code. The full source code for the end-to-end pipeline I build in this book is on
GitHub. Create a Google Cloud Platform project and after reading each chapter, try to repeat what I
did by referring to the code and to the README.md1 file in each folder of the GitHub repository.
Conventions Used in This Book
The following typographical conventions are used in this book:
Italic
Indicates new terms, URLs, email addresses, filenames, and file extensions.
Constant width
Used for program listings, as well as within paragraphs to refer to program elements such as
variable or function names, databases, data types, environment variables, statements, and
keywords.
Constant width bold
Shows commands or other text that should be typed literally by the user.
Constant width italic
Shows text that should be replaced with user-supplied values or by values determined by context.
TIP
This element signifies a tip or suggestion.
NOTE
This element signifies a general note.
WARNING
This element indicates a warning or caution.
Using Code Examples
Supplemental material (code examples, exercises, etc.) is available for download at
/>This book is here to help you get your job done. In general, if example code is offered with this book,
you may use it in your programs and documentation. You do not need to contact us for permission
unless you’re reproducing a significant portion of the code. For example, writing a program that uses
several chunks of code from this book does not require permission. Selling or distributing a CDROM of examples from O’Reilly books does require permission. Answering a question by citing this
book and quoting example code does not require permission. Incorporating a significant amount of
example code from this book into your product’s documentation does require permission.
We appreciate, but do not require, attribution. An attribution usually includes the title, author,
publisher, and ISBN. For example: “Data Science on the Google Cloud Platform by Valliappa
Lakshmanan (O’Reilly). Copyright 2018 Google Inc., 978-1-491-97456-8.”
If you feel your use of code examples falls outside fair use or the permission given above, feel free to
contact us at
O’Reilly Safari
Safari (formerly Safari Books Online) is a membership-based training and reference platform for
enterprise, government, educators, and individuals.
Members have access to thousands of books, training videos, Learning Paths, interactive tutorials,
and curated playlists from over 250 publishers, including O’Reilly Media, Harvard Business
Review, Prentice Hall Professional, Addison-Wesley Professional, Microsoft Press, Sams, Que,
Peachpit Press, Adobe, Focal Press, Cisco Press, John Wiley & Sons, Syngress, Morgan Kaufmann,
IBM Redbooks, Packt, Adobe Press, FT Press, Apress, Manning, New Riders, McGraw-Hill, Jones
& Bartlett, and Course Technology, among others.
For more information, please visit />
How to Contact Us
Please address comments and questions concerning this book to the publisher:
O’Reilly Media, Inc.
1005 Gravenstein Highway North
Sebastopol, CA 95472
800-998-9938 (in the United States or Canada)
707-829-0515 (international or local)
707-829-0104 (fax)
We have a web page for this book, where we list errata, examples, and any additional information.
You can access this page at />To comment or ask technical questions about this book, send email to
For more information about our books, courses, conferences, and news, see our website at
.
Find us on Facebook: />Follow us on Twitter: />Watch us on YouTube: />
Acknowledgments
When I took the job at Google about a year ago, I had used the public cloud simply as a way to rent
infrastructure—so I was spinning up virtual machines, installing the software I needed on those
machines, and then running my data processing jobs using my usual workflow. Fortunately, I realized
that Google’s big data stack was different, and so I set out to learn how to take full advantage of all
the data and machine learning tools on Google Cloud Platform.
The way I learn best is to write code, and so that’s what I did. When a Python meetup group asked me
to talk about Google Cloud Platform, I did a show-and-tell of the code that I had written. It turned out
that a walk-through of the code to build an end-to-end system while contrasting different approaches
to a data science problem was quite educational for the attendees. I wrote up the essence of my talk as
a book proposal and sent it to O’Reilly Media.
A book, of course, needs to have a lot more depth than a 60-minute code walk-through. Imagine that
you come to work one day to find an email from a new employee at your company, someone who’s
been at the company less than six months. Somehow, he’s decided he’s going to write a book on the
pretty sophisticated platform that you’ve had a hand in building and is asking for your help. He is not
part of your team, helping him is not part of your job, and he is not even located in the same office as
you. What is your response? Would you volunteer?
What makes Google such a great place to work is the people who work here. It is a testament to the
company’s culture that so many people—engineers, technical leads, product managers, solutions
architects, data scientists, legal counsel, directors—across so many different teams happily gave of
their expertise to someone they had never met (in fact, I still haven’t met many of these people in
person). This book, thus, is immeasurably better because of (in alphabetical order) William
Brockman, Mike Dahlin, Tony Diloreto, Bob Evans, Roland Hess, Brett Hesterberg, Dennis Huo,
Chad Jennings, Puneith Kaul, Dinesh Kulkarni, Manish Kurse, Reuven Lax, Jonathan Liu, James
Malone, Dave Oleson, Mosha Pasumansky, Kevin Peterson, Olivia Puerta, Reza Rokni, Karn Seth,
Sergei Sokolenko, and Amy Unruh. In particular, thanks to Mike Dahlin, Manish Kurse, and Olivia
Puerta for reviewing every single chapter. When the book was in early access, I received valuable
error reports from Anthonios Partheniou and David Schwantner. Needless to say, I am responsible
for any errors that remain.
A few times during the writing of the book, I found myself completely stuck. Sometimes, the problems
were technical. Thanks to (in alphabetical order) Ahmet Altay, Eli Bixby, Ben Chambers, Slava
Chernyak, Marian Dvorsky, Robbie Haertel, Felipe Hoffa, Amir Hormati, Qi-ming (Bradley) Jiang,
Kenneth Knowles, Nikhil Kothari, and Chris Meyers for showing me the way forward. At other times,
the problems were related to figuring out company policy or getting access to the right team,
document, or statistic. This book would have been a lot poorer had these colleagues not unblocked
me at critical points (again in alphabetical order): Louise Byrne, Apurva Desai, Rochana Golani,
Fausto Ibarra, Jason Martin, Neal Mueller, Philippe Poutonnet, Brad Svee, Jordan Tigani, William
Vampenebe, and Miles Ward. Thank you all for your help and encouragement.
Thanks also to the O’Reilly team—Marie Beaugureau, Kristen Brown, Ben Lorica, Tim McGovern,
Rachel Roumeliotis, and Heather Scherer for believing in me and making the process of moving from
draft to published book painless.
Finally, and most important, thanks to Abirami, Sidharth, and Sarada for your understanding and
patience even as I became engrossed in writing and coding. You make it all worthwhile.
1 For
example, see />
Chapter 1. Making Better Decisions Based
on Data
The primary purpose of data analysis is to make better decisions. There is rarely any need for us to
spend time analyzing data if we aren’t under pressure to make a decision based on the results of that
analysis. When you are purchasing a car, you might ask the seller what year the car was manufactured
and the odometer reading. Knowing the age of the car allows you to estimate the potential value of the
car. Dividing the odometer reading by the age of the car allows you to discern how hard the car has
been driven, and whether it is likely to last the five years you plan to keep it. Had you not cared about
purchasing the car, there would have been no need for you to do this data analysis.
In fact, we can go further—the purpose of collecting data is, in many cases, only so that you can later
perform data analysis and make decisions based on that analysis. When you asked the seller the age of
the car and its mileage, you were collecting data to carry out your data analysis. But it goes beyond
your data collection. The car has an odometer in the first place because many people, not just
potential buyers, will need to make decisions based on the mileage of the car. The odometer reading
needs to support many decisions—should the manufacturer pay for a failed transmission? Is it time for
an oil change? The analysis for each of these decisions is different, but they all rely on the fact that the
mileage data has been collected.
Collecting data in a form that enables decisions to be made often places requirements on the
collecting infrastructure and the security of such infrastructure. How does the insurance company that
receives an accident claim and needs to pay its customer the car’s value know that the odometer
reading is accurate? How are odometers calibrated? What kinds of safeguards are in place to ensure
that the odometer has not been tampered with? What happens if the tampering is inadvertent, such as
installing tires whose size is different from what was used to calibrate the odometer? The auditability
of data is important whenever there are multiple parties involved, and ownership and use of the data
are separate. When data is unverifiable, markets fail, optimal decisions cannot be made, and the
parties involved need to resort to signaling and screening.1
Not all data is as expensive to collect and secure as the odometer reading of a car.2 The cost of
sensors has dropped dramatically in recent decades, and many of our daily processes throw off so
much data that we find ourselves in possession of data that we had no intention of explicitly
collecting. As the hardware to collect, ingest, and store the data has become cheaper, we default to
retaining the data indefinitely, keeping it around for no discernable reason. However, we still need a
purpose to perform analysis on all of this data that we somehow managed to collect and store. Labor
remains expensive.
The purpose that triggers data analysis is a decision that needs to be made. To move into a market or
not? To pay a commission or not? How high to bid up the price? How many bags to purchase?
Whether to buy now or wait a week? The decisions keep multiplying, and because data is so
ubiquitous now, we no longer need to make those decisions based on heuristic rules of thumb. We can
now make those decisions in a data-driven manner.
Of course, we don’t need to make every data-driven decision ourselves. The use case of estimating
the value of a car that has been driven a certain distance is common enough that there are several
companies that provide this as a service—they will verify that an odometer is accurate, confirm that
the car hasn’t been in an accident, and compare the asking price against the typical selling price of
cars in your market. The real value, therefore, comes not in making a data-driven decision once, but
in being able to do it systematically and provide it as a service. This also allows companies to
specialize, and continuously improve the accuracy of the decisions that can be made.
Many Similar Decisions
Because of the lower costs associated with sensors and storage, there are many more industries and
use cases that now have the potential to support data-driven decision making. If you are working in
such an industry, or you want to start a company that will address such a use case, the possibilities for
supporting data-driven decision making have just become wider. In some cases, you will need to
collect the data. In others, you will have access to data that was already collected, and, in many
cases, you will need to supplement the data you have with other datasets that you will need to hunt
down for which you’ll need to create proxies. In all these cases, being able to carry out data analysis
to support decision making systematically on behalf of users is a good skill to possess.
In this book, I will take a decision that needs to be made and apply different statistical and machine
learning methods to gain insight into making that decision. However, we don’t want to make that
decision just once, even though we might occasionally pose it that way. Instead, we will look at how
to make the decision in a systematic manner. Our ultimate goal will be to provide this decisionmaking capability as a service to our customers—they will tell us the things they reasonably can be
expected to know, and we will either know or infer the rest (because we have been systematically
collecting data).
When we are collecting the data, we will need to look at how to make the data secure. This will
include how to ensure not only that the data has not been tampered with, but also that users’ private
information is not compromised—for example, if we are systematically collecting odometer mileage
and know the precise mileage of the car at any point in time, this knowledge becomes extremely
sensitive information. Given enough other information about the customer (such as the home address
and traffic patterns in the city in which the customer lives), the mileage is enough to be able to infer
that person’s location at all times. So, the privacy implications of hosting something as seemingly
innocuous as the mileage of a car can become enormous. Security implies that we need to control
access to the data, and we need to maintain immutable audit logs on who has viewed or changed the
data.
It is not enough to simply collect the data or use it as is. We must understand the data. Just as we
needed to know the kinds of problems associated with odometer tampering to understand the factors
that go into estimating a vehicle’s value based on mileage, our analysis methods will need to consider
how the data was collected in real time, and the kinds of errors that could be associated with that
data. Intimate knowledge of the data and its quirks is invaluable when it comes to doing data science
—often the difference between a data-science startup idea that works and one that doesn’t is whether
the appropriate nuances have all been thoroughly evaluated and taken into account.
When it comes to providing the decision-support capability as a service, it is not enough to simply
have a way to do it in some offline system somewhere. Enabling it as a service implies a whole host
of other concerns. The first set of concerns is about the quality of the decision itself—how accurate is
it typically? What are the typical sources of errors? In what situations should this system not be used?
The next set of concerns, however, is about the quality of service. How reliable is it? How many
queries per second can it support? What is the latency between some piece of data being available,
and it being incorporated into the model that is used to provide systematic decision making? In short,
we will use this single use case as a way to explore many different facets of practical data science.
The Role of Data Engineers
“Wait a second,” I imagine you saying, “I never signed up for queries-per-second of a web service.
We have people who do that kind of stuff. My job is to write SQL queries and create reports. I don’t
recognize this thing you are talking about. It’s not what I do at all.” Or perhaps the first part of the
discussion was what has you puzzled. “Decision making? That’s for the business people. Me? What I
do is to design data processing systems. I can provision infrastructure, tell you what our systems are
doing right now, and keep it all secure. Data science sure sounds fancy, but I do engineering. When
you said Data Science on the Google Cloud Platform, I was thinking that you were going to talk
about how to keep the systems humming and how to offload bursts of activity to the cloud.” A third set
of people are wondering, “How is any of this data science? Where’s the discussion of different types
of models and of how to make statistical inferences and evaluate them? Where’s the math? Why are
you talking to data analysts and engineers? Talk to me, I’ve got a PhD.” This is a fair point—I seem to
be mixing up the jobs done by different sets of people in your organization.
In other words, you might agree with the following:
Data analysis is there to support decision making
Decision making in a data-driven manner can be superior to heuristics
The accuracy of the decision models depends on your choice of the right statistical or
machine learning approach
Nuances in the data can completely invalidate your modeling, so understanding the data and
its quirks is crucial
There are large market opportunities in supporting decision making systematically and
providing it as a service
Such services require ongoing data collection and model updates
Ongoing data collection implies robust security and auditing
Customers of the service require reliability, accuracy, and latency assurances
What you might not agree with is whether these aspects are all things that you, personally and
professionally, need to be concerned about.
At Google,3 we look on the role a little more expansively. Just as we refer to all our technical staff as
engineers, we look at data engineers as an inclusive term for anyone who can “shape business
outcomes by performing data analysis”. To perform data analysis, you begin by building statistical
models that support smart (not heuristic) decision making in a data-driven way. It is not enough to
simply count and sum and graph the results using SQL queries and charting software—you must
understand the statistical framework within which you are interpreting the results, and go beyond
simple graphs to deriving the insight toward answering the original problem. Thus, we are talking
about two domains: (a) the statistical setting in which a particular aggregate you are computing makes
sense, and (b) understanding how the analysis can lead to the business outcome we are shooting for.
This ability to carry out statistically valid data analysis to solve specific business problems is of
paramount importance—the queries, the reports, the graphs are not the end goal. A verifiably accurate
decision is.
Of course, it is not enough to do one-off data analysis. That data analysis needs to scale. In other
words, the accurate decision-making process must be repeatable and be capable of being carried out
by many users, not just you. The way to scale up one-off data analysis is to make it automated. After a
data engineer has devised the algorithm, she should be able to make it systematic and repeatable. Just
as it is a lot easier when the folks in charge of systems reliability can make code changes themselves,
it is considerably easier when people who understand statistics and machine learning can code those
models themselves. A data engineer, Google believes, should be able to go from building statistical
and machine learning models to automating them. They can do this only if they are capable of
designing, building, and troubleshooting data processing systems that are secure, reliable, faulttolerant, scalable, and efficient.
This desire to have engineers who know data science and data scientists who can code is not
Google’s alone—it’s across the industry. Jake Stein, founder of startup Stitch, concludes after looking
at job ads that data engineers are the most in-demand skill in the world of big data. Carrying out
analysis similar to Stein’s on Indeed job data in San Francisco and accounting for jobs that listed
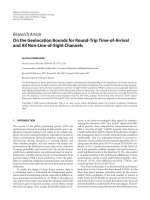
multiple roles, I found that the number of data engineer listings was higher than those for data analysts
and data scientists combined, as illustrated in Figure 1-1.
Figure 1-1. Analysis of Indeed job data in San Francisco shows that data engineers are the most in-demand skill in the world of
big data
Even if you don’t live in San Francisco and do not work in high-tech, this is the direction that all
data-focused industries in other cities are headed. The trend is accentuated by the increasing need to
make repeatable, scalable decisions on the basis of data. When companies look for data engineers,
what they are looking for is a person who can combine all three roles.
How realistic is it for companies to expect a Renaissance man, a virtuoso in different fields? Can
they reasonably expect to hire data engineers? How likely is it that they will find someone who can
design a database schema, write SQL queries, train machine learning models, code up a data
processing pipeline, and figure out how to scale it all up? Surprisingly, this is a very reasonable
expectation, because the amount of knowledge you need in order to do these jobs has become a lot
less than what you needed a few years ago.
The Cloud Makes Data Engineers Possible
Because of the ongoing movement to the cloud, data engineers can do the job that used to be done by
four people with four different sets of skills. With the advent of autoscaling, serverless, managed
infrastructure that is easy to program, there are more and more people who can build scalable
systems. Therefore, it is now reasonable to expect to be able to hire data engineers who are capable
of creating holistic data-driven solutions to your thorniest problems. You don’t need to be a polymath
to be a data engineer—you simply need to learn how to do data science on the cloud.
Saying that the cloud is what makes data engineers possible seems like a very tall claim. This hinges
on what I mean by “cloud”—I don’t mean simply migrating workloads that run on-premises to
infrastructure that is owned by a public cloud vendor. I’m talking, instead, about truly autoscaling,
managed services that automate a lot of the infrastructure provisioning, monitoring, and management
—services such as Google BigQuery, Cloud Dataflow, and Cloud Machine Learning Engine on
Google Cloud Platform. When you consider that the scaling and fault-tolerance of many data analysis
and processing workloads can be effectively automated, provided the right set of tools is being used,
it is clear that the amount of IT support that a data scientist needs dramatically reduces with a
migration to the cloud.
At the same time, data science tools are becoming simpler and simpler to use. The wide availability
of frameworks like Spark, scikit-learn, and Pandas has made data science and data science tools
extremely accessible to the average developer—no longer do you need to be a specialist in data
science to create a statistical model or train a random forest. This has opened up the field of data
science to people in more traditional IT roles.
Similarly, data analysts and database administrators today can have completely different backgrounds
and skillsets because data analysis has usually involved serious SQL wizardry, and database
administration has typically involved deep knowledge of database indices and tuning. With the
introduction of tools like BigQuery, in which tables are denormalized and the administration
overhead is minimal, the role of a database administrator is considerably diminished. The growing
availability of turnkey visualization tools like Tableau that connect to all the data stores within an
enterprise makes it possible for a wider range of people to directly interact with enterprise
warehouses and pull together compelling reports and insights.
The reason that all these data-related roles are merging together, then, is because the infrastructure
problem is becoming less intense and the data analysis and modeling domain is becoming more
democratized.
If you think of yourself today as a data scientist, or a data analyst, or a database administrator, or a
systems programmer, this is either totally exhilarating or totally unrealistic. It is exhilarating if you
can’t wait to do all the other tasks that you’ve considered beyond your ken if the barriers to entry
have fallen as low as I claim they have. If you are excited and raring to learn the things you will need
to know in this new world of data, welcome! This book is for you.
If my vision of a blend of roles strikes you as an unlikely dystopian future, hear me out. The vision of
autoscaling services that require very little in the form of infrastructure management might be
completely alien to your experience if you are in an enterprise environment that is notoriously slow
moving—there is no way, you might think, that data roles are going to change as dramatically as all
that by the time you retire.
Well, maybe. I don’t know where you work, and how open to change your organization is. What I
believe, though, is that more and more organizations and more and more industries are going be like
the tech industry in San Francisco. There will be increasingly more data engineer openings than
openings for data analysts and data scientists, and data engineers will be as sought after as data
scientists are today. This is because data engineers will be people who can do data science and know
enough about infrastructure so as to be able to run their data science workloads on the public cloud. It
will be worthwhile for you to learn data science terminology and data science frameworks, and make
yourself more valuable for the next decade.
Growing automation and ease-of-use leading to widespread use is well trodden in technology. It used
to be the case that if you wanted vehicular transport, you needed a horse-drawn carriage. This
required people to drive you around and people to tend to your horses because driving carriages and
tending to horses were such difficult things to do. But then automobiles came along, and feeding
automobiles got to be as simple as pumping gas into a tank. Just as stable boys were no longer needed
to take care of horses, the role of carriage drivers also became obsolete. The kind of person who
didn’t have a stablehand would also not be willing to employ a dedicated driver. So, democratizing
the use of cars required cars to be simple enough to operate that you could do it yourself. You might
look at this and bemoan the loss of all those chauffeur jobs. The better way to look at it is that there
are a lot more cars on the road because you don’t need to be able to afford a driver in order to own a
car, and so all the would-be chauffeurs now drive their own cars. Even the exceptions prove the rule
—this growing democratization of car ownership is only true if driving is easy and not a time sink. In
developing countries where traffic is notoriously congested and labor is cheap, even the middle class
might have chauffeurs. In developed countries, the time sink associated with driving and the high cost
of labor has prompted a lot of research into self-driving cars.
The trend from chauffeured horse-driven carriages to self-driving cars is essentially the trend that we
see in data science—as infrastructure becomes easier and easier, and involves less and less manual
management, more and more data science workloads become feasible because they require a lot less
scaffolding work. This means that more people can now do data science. At Google, for example,
nearly 80% of employees use Dremel (Dremel is the internal counterpart to Google Cloud’s
BigQuery) every month.4 Some use data in more sophisticated ways than others, but everyone touches
data on a regular basis to inform their decisions. Ask someone a question, and you are likely to
receive a link to a BigQuery view or query rather than to the actual answer: “Run this query every
time you want to know the most up-to-date answer,” goes the thinking. BigQuery in the latter scenario
has gone from being the no-ops database replacement to being the self-serve data analytics solution.
As another example of change in the workplace, think back to how correspondence used to be
created. Companies had rows and rows of low-wage workers whose job was to take down dictation
and then type it up. The reason that companies employed typists is that typing documents was quite
time-consuming and had low value (and by this, I mean that the direct impact of the role of a typist to
a company’s core mission was low). It became easier to move the responsibility for typing
correspondences to low-paid workers so that higher-paid employees had the time to make sales calls,
invent products, and drink martinis at lunch. But this was an inefficient way for those high-wage
workers to communicate. Computerization took hold, and word processing made document creation
easier and typing documents became self-serve. These days, all but the seniormost executives at a
firm type their own correspondence. At the same time, the volume of correspondence has greatly
exploded. That is essentially the trend you will see with data science workloads—they are going to
become easier to test and deploy. So, many of the IT jobs involved with these will morph into that of
writing those data science workloads because the writing of data science workloads is also becoming
simplified. And as a result, data science and the ability to work with data will spread throughout an
enterprise rather than being restricted to a small set of roles.
The target audience for this book is people who do computing with data. If you are a data analyst,
database administrator, data engineer, data scientist, or systems programmer today, this book is for
you. I foresee that your role will soon require both creating data science models and implementing
them at scale in a production-ready system that has reliability and security considerations.
The current separation of responsibility between data analysts, database administrators, data
scientists, and systems programmers came about in an era when each of these roles required a lot
more specialized knowledge than they will in the near future. A practicing data engineer will no
longer need to delegate that job to someone else. Complexity was the key reason that there came to be
this separation of responsibility between the people who wrote models and the people who
productionized those models. As that complexity is reduced by the advent of autoscaled, fully
managed services, and simpler and simpler data science packages, it has become extremely easy for
an engineer to write a data science workload, submit it to the cloud, and have that workload be
executed automatically in an autoscaled manner. That’s one end of the equation—as a data scientist,
you do not need a specialized army of IT specialists to make your code ready for production.
On the other side, data science itself has become a lot less complex and esoteric. With well-designed
packages and easy-to-consume APIs, you do not need to implement all of the data science algorithms
yourself—you need to know only what each algorithm does and be able to connect them together to
solve realistic problems. Because designing a data science workload has become easier to do, it has
come to be a lot more democratized. So, if you are an IT person whose job role so far has been to
manage processes but you know some programming—particularly Python—and you understand your
business domain well, it is quite possible for you to begin designing data processing pipelines and to
begin addressing business problems with those programming skills.
In this book, therefore, we’ll talk about all these aspects of data-based services because data
engineers will be involved from the designing of those services, to the development of the statistical
and machine learning models, to the scalable production of those services in real time.
The Cloud Turbocharges Data Science
Before I joined Google, I was a research scientist working on machine learning algorithms for
weather diagnosis and prediction. The machine learning models involved multiple weather sensors,
but were highly dependent on weather radar data. A few years ago, when we undertook a project to
reanalyze historical weather radar data using the latest algorithms, it took us four years to do.
However, more recently, my team was able to build rainfall estimates off the same dataset, but were
able to traverse the dataset in about two weeks. You can imagine the pace of innovation that results
when you take something that used to take four years and make it doable in two weeks.
Four years to two weeks. The reason was that much of the work as recently as five years ago
involved moving data around. We’d retrieve data from tape drives, stage it to disk, process it, and
move it off to make way for the next set of data. Finding out what jobs had failed was time consuming,
and retrying failed jobs involved multiple steps including a human in the loop. We were running it on
a cluster of machines that had a fixed size. The combination of all these things meant that it took
incredibly long periods of time to process the historical archive. After we began doing everything on
the public cloud, we found that we could store all of the radar data on cloud storage, and as long as
we were accessing it from virtual machines (VMs) in the same region, data transfer speeds were fast
enough. We still had to stage the data to disks, carry out the computation, and bring down the VMs,
but this was a lot more manageable. Simply lowering the amount of data migration and running the
processes on many more machines enabled us to carry out processing much faster.
Was it more expensive to run the jobs on 10 times more machines than we did when we did the
processing on-premises? No, because the economics are in favor of renting rather than buying
processing power. Whether you run 10 machines for 10 hours or 100 machines for 1 hour, the cost
remains the same. Why not, then, get your answers in an hour rather than 10 hours?
As it turns out, though, we were still not taking full advantage of what the cloud has to offer. We
could have completely foregone the process of spinning up VMs, installing software on them, and
looking for failed jobs—what we should have done was to use an autoscaling data processing
pipeline such as Cloud Dataflow. Had we done that, we could have run our jobs on thousands of
machines and brought our processing time from two weeks to a few hours. Not having to manage any
infrastructure is itself a huge benefit when it comes to trawling through terabytes of data. Having the
data processing, analysis, and machine learning autoscale to thousands of machines is a bonus.
The key benefit of performing data engineering in the cloud is the amount of time that it saves you.
You shouldn’t need to wait days or months—instead, because many jobs are embarrassingly parallel,
you can get your results in minutes to hours by having them run on thousands of machines. You might
not be able to afford permanently owning so many machines, but it is definitely possible to rent them
for minutes at a time. These time savings make autoscaled services on a public cloud the logical
choice to carry out data processing.
Running data jobs on thousands of machines for minutes at a time requires fully managed services.
Storing the data locally on the compute nodes or persistent disks as with the Hadoop Distributed File
System (HDFS) doesn’t scale unless you know precisely what jobs are going to be run, when, and
where. You will not be able to downsize the cluster of machines if you don’t have automatic retries
for failed jobs. The uptime of the machines will be subject to the time taken by the most overloaded
worker unless you have dynamic task shifting among the nodes in the cluster. All of these point to the
need for autoscaling services that dynamically resize the cluster, move jobs between compute nodes,
and can rely on highly efficient networks to move data to the nodes that are doing the processing.
On Google Cloud Platform, the key autoscaling, fully managed, “serverless” services are BigQuery
(for SQL analytics), Cloud Dataflow (for data processing pipelines), Google Cloud Pub/Sub (for
message-driven systems), Google Cloud Bigtable (for high-throughput ingest), Google App Engine
(for web applications), and Cloud Machine Learning Engine (for machine learning). Using autoscaled
services like these makes it possible for a data engineer to begin tackling more complex business
problems because they have been freed up from the world of managing their own machines and
software installations whether in the form of bare hardware, virtual machines, or containers. Given
the choice between a product that requires you to first configure a container, server, or cluster, and
another product that frees you from those considerations, choose the serverless one. You will have
more time to solve the problems that actually matter to your business.
Case Studies Get at the Stubborn Facts
This entire book consists of an extended case study. Why write a book about data science, not as a
reference text, but as a case study? There is a reason why case studies are so popular in fields like
medicine and law—case studies can help keep discussion, in the words of Paul Lawrence, “grounded
in upon some of the stubborn facts that must be faced in real-life situations.”5 A case study, Lawrence
continued, is “the record of complex situations that must be literally pulled apart and pulled together
again for the expression of attitudes or ways of thinking brought into the classroom.”
Solving a real-world, practical problem will help cut through all the hype that surrounds big data,
machine learning, cloud computing, and so on. Pulling a case study apart and putting it together in
multiple ways can help illuminate the capabilities and shortcomings of the various big data and
machine learning tools that are available to you. A case study can help you identify the kinds of datadriven decisions that you can make in your business and illuminate the considerations behind the data
you need to collect and curate, and the kinds of statistical and machine learning models you can use.
Case studies are unfortunately too rare in the field of data analysis and machine learning—books and
tutorials are full of toy problems with neat, pat solutions that fall apart in the real world. Witten and
Frank, in the preface to their (excellent) book on data mining,6 captured the academic’s disdain of the
practical, saying that their book aimed to “gulf [the gap] between the intensely practical approach
taken by trade books that provide case studies on data mining and the more theoretical, principledriven exposition found in current textbooks on machine learning.”7 In this book, I try to change that:
it is possible to be both practical and principled. I do not, however, concern myself too much with
theory. Instead, my aim will be to provide broad strokes that explain the intuition that underlies a
particular approach and then dive into addressing the case study question using that approach.
You’ll get to see data science done, warts and all, on a real-world problem. One of the ways that this
book will mirror practice is that I will use a real-world dataset to solve a realistic problem and
address problems as they come up. So, I will begin with a decision that needs to be made and apply
different statistical and machine learning methods to gain insight into making that decision in a datadriven manner. This will give you the ability to explore other problems and the confidence to solve
them from first principles. As with most things, I will begin with simple solutions and work my way
to more complex ones. Starting with a complex solution will only obscure details about the problem
that are better understood when solving it in simpler ways. Of course, the simpler solutions will have
drawbacks, and these will help to motivate the need for additional complexity.
One thing that I do not do, however, is to go back and retrofit earlier solutions based on knowledge
that I gain in the process of carrying out more sophisticated approaches. In your practical work,
however, I strongly recommend that you maintain the software associated with early attempts at a
problem, and that you go back and continuously enhance those early attempts with what you learn
along the way. Parallel experimentation is the name of the game. Due to the linear nature of a book, I
don’t do it, but I heartily recommend that you continue to actively maintain several models. Given the
choice of two models with similar accuracy measures, you can then choose the simpler one—it makes
no sense to use more complex models if a simpler approach can work with some modifications. This
is an important enough difference between what I would recommend in a real-world project and what
I do in this book that I will make a note of situations in which I would normally circle back and make
changes to a prior approach.
A Probabilistic Decision
Imagine that you are about to take a flight and just before the flight takes off from the runway (and you
are asked to switch off your phone), you have the opportunity to send one last text message. It is past
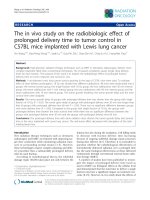
the published departure time and you are a bit anxious. Figure 1-2 presents a graphic view of the
scenario.
Figure 1-2. A graphic illustration of the case study: if the flight departs late, should the road warrior cancel the meeting?
The reason for your anxiety is that you have scheduled an important meeting with a client at its
offices. As befits a rational data scientist,8 you scheduled things rather precisely. You have taken the
airline at its word with respect to when the flight would arrive, accounted for the time to hail a taxi,
and used an online mapping tool to estimate the time to the client’s office. Then, you added some
leeway (say 30 minutes) and told the client what time you’d meet her. And now, it turns out that the
flight is departing late. So, should you send a text informing your client that you will not be able to
make the meeting because your flight will be late or should you not?
This decision could be made in many ways, including by gut instinct and using heuristics. Being very
rational people, we (you and I) will make this decision informed by data. Also, we see that this is a
decision made by many of the road warriors in our company day in and day out. It would be a good
thing if we could do it in a systematic way and have a corporate server send out an alert to travelers
about anticipated delays if we see events on their calendar that they are likely to miss. Let’s build a
data framework to solve this problem.
Even if we decide to make the decision in a data-driven way, there are several approaches we could
take. Should we cancel the meeting if there is greater than a 30% chance that you will miss it? Or
should we assign a cost to postponing the meeting (the client might go with our competition before we
get a chance to demonstrate our great product) versus not making it to a scheduled meeting (the client
might never take our calls again) and minimize our expected loss in revenue? The probabilistic
approach translates to risk, and many practical decisions hinge on risk. In addition, the probabilistic
approach is more general because if we know the probability and the monetary loss associated with
missing the meeting, it is possible to compute the expected value of any decision that we make. For
example, suppose the chance of missing the meeting is 20% and we decide to not cancel the meeting
(because 20% is less than our decision threshold of 30%). But there is only a 25% chance that the
client will sign the big deal (worth a cool million bucks) for which you are meeting her. Because
there is an 80% chance that we will make the meeting, the expected upside value of not canceling the
meeting is 0.8 * 0.25 * 1 million, or $200,000. The downside value is that we do miss the meeting.
Assuming that the client is 90% likely to blow us off if we miss a meeting with her, the downside
value is 0.2 * 0.9 * 0.25 * 1 million, or $45,000. This yields an expected value of $155,000 in favor
of not canceling the meeting. We can adjust these numbers to come up with an appropriate
probabilistic decision threshold.
Another advantage of a probabilistic approach is that we can directly take into account human
psychology. You might feel frazzled if you arrive at a meeting only two minutes before it starts and, as
a result, might not be able to perform at your best. It could be that arriving only two minutes early to a
very important meeting doesn’t feel like being on time. This obviously varies from person to person,
but let’s say that this time interval that you need to settle down is 15 minutes. You want to cancel a
meeting for which you cannot arrive 15 minutes early. You could also treat this time interval as your
personal risk aversion threshold, a final bit of headroom if you will. Thus, you want to arrive at the
client’s site 15 minutes before the meeting and you want to cancel the meeting if there is a less than
70% of chance of doing that. This, then, is our decision criterion:
Cancel the client meeting if the likelihood of arriving 15 minutes early is 70% or less.
I’ve explained the 15 minutes, but I haven’t explained the 70%. Surely, you can use the
aforementioned model diagram (in which we modeled our journey from the airport to the client’s
office), plug in the actual departure delay, and figure out what time you will arrive at the client’s
offices. If that is less than 15 minutes before the meeting starts, you should cancel! Where does the
70% come from?
It is important to realize that the model diagram of times is not exact. The probabilistic decision
framework gives you a way to treat this in a principled way. For example, although the airline
company says that the flight is 127 minutes long and publishes an arrival time, not all flights are
exactly 127 minutes long. If the plane happens to take off with the wind, catch a tail wind, and land
against the wind, the flight might take only 90 minutes. Flights for which the winds are all precisely
wrong might take 127 minutes (i.e., the airline might be publishing worst-case scenarios for the
route). Google Maps is publishing predicted journey times based on historical data, and the actual
journeys by taxi might be centered around those times. Your estimate of how long it takes to walk
from the airport gate to the taxi stand might be predicated on landing at a specific gate, and actual
times may vary. So, even though the model depicts a certain time between airline departure and your
arrival at the client site, this is not an exact number. The actual time between departure and arrival
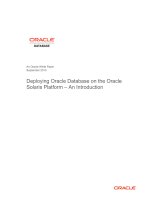
might have a distribution that looks that shown in Figure 1-3.
Figure 1-3. There are many possible time differences between aircraft departure and your arrival at a client site, and the
distribution of those differences is called the probability distribution function
Intuitively, you might think that the way to read this graph is that given a time on the x-axis, you can
look up the probability of that time difference on the y-axis. Given a large enough dataset (i.e.,
provided we made enough journeys to this client site on this airline), we can estimate the probability
of a specific time difference (e.g., 227 minutes) by computing the fraction of flights for which the time
difference is 227. Because the time is a continuous variable, though, the probability of any exact time
is exactly zero—the probability of the entire journey taking exactly 227 minutes (and not a
nanosecond more) is zero—there are infinitely many possible times, so the probability of any specific
time is exactly zero.
What we would need to calculate is the probability that the time lies between 227 – ɛ and 227 + ɛ,
where the epsilon is suitably small. Figure 1-4 depicts this graphically.
In real-world datasets, you won’t have continuous variables—floating-point values tend to be
rounded off to perhaps six digits. Therefore, the probability of exactly 227 minutes will not be zero,
given that we might have some 227-minute data in our dataset. In spite of this, it is important to
realize the general principle that the probability of a time difference of 227.000000 minutes is
meaningless.
Instead, you should compute the probability that the value lies between two values (such as 226.9 and
227.1, with the lefthand limit being inclusive of 226.9 and the righthand limit exclusive of 227.1).
You can calculate this by adding up the number of times that 226.90, 226.91, 226.92, and so on
appear in the dataset. You can calculate the desired probability by adding up the occurrences.
Addition of the counts of the discrete occurrences is equivalent to integrating the continuous values.
Incidentally, this is what you are doing when you use a histogram to approximate a probability—a
histogram implies that you will have discretized the x-axis values into a specific number of bins.
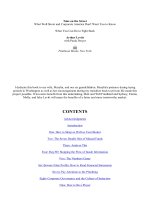
Figure 1-4. The probability of any exact time difference (such as 227 minutes) is zero. Therefore, we usually think of the
probability that the time difference is within, say 30 seconds of 227 minutes.
The fact that you need to integrate the curve to get a probability implies that the y-axis value is not
really the probability. Rather, it is the density of the probability and referred to as the probability
density function (abbreviated as the PDF). It is a density because if you multiply it by the x-axis
value, you get the area of the blue box, and that area is the probability. In other words, the y-axis is
the probability divided by the x-axis value. In fact, the PDF can be (and often is) greater than one.
Integrating probability density functions to obtain probabilities is needed often enough and PDFs are
unintuitive enough (it took me four paragraphs to explain the probability distribution function, and
even that involved a fair amount of hand-waving) that it is helpful to look around for an alternative.
The cumulative probability distribution function of a value x is the probability that the observed value
X is less than the threshold x. For example, you can get the Cumulative Distribution Function (CDF)
for 227 minutes by finding the fraction of flights for which the time difference is less than 227
minutes, as demonstrated in Figure 1-5.
Figure 1-5. The CDF is easier to understand and keep track of than the PDF. In particular, it is bounded between 0 and 1,
whereas the PDF could be greater than 1.
Let’s interpret the graph in Figure 1-5. What does a CDF(227 minutes) = 0.8 mean? It means that 80%
of flights will arrive such that we will make it to the client’s site in less than 227 minutes—this
includes both the situation in which we can make it in 100 minutes and the situation in which it takes
us 226 minutes. The CDF, unlike the PDF, is bounded between 0 and 1. The y-axis value is a
probability, just not the probability of an exact value. It is, instead, the probability of observing all
values less than that value.
Because the time to get from the arrival airport to the client’s office is unaffected by the flight’s
departure delay,9 we can ignore it in our modeling. We can similarly ignore the time to walk through
the airport, hail the taxi, and get ready for the meeting. So, we need only to find the likelihood of the
arrival delay being more than 15 minutes. If that likelihood is 0.3 or more, we will need to cancel the
meeting. In terms of the CDF, that means that the probability of arrival delays of less than 15 minutes
has to be at least 0.7, as presented in Figure 1-6.
Thus, our decision criteria translate to the following:
Cancel the client meeting if the CDF of an arrival delay of 15 minutes is less than 70%.