Architecting for access
Bạn đang xem bản rút gọn của tài liệu. Xem và tải ngay bản đầy đủ của tài liệu tại đây (2.9 MB, 29 trang )
Strata + Hadoop World
Architecting for Access
Simplifying Analytics on Big Data Infrastructure
Rich Morrow
Architecting for Access
by Rich Morrow
Copyright © 2016 O’Reilly Media, Inc. All rights reserved.
Printed in the United States of America.
Published by O’Reilly Media, Inc., 1005 Gravenstein Highway North,
Sebastopol, CA 95472.
O’Reilly books may be purchased for educational, business, or sales
promotional use. Online editions are also available for most titles
(). For more information, contact our
corporate/institutional sales department: 800-998-9938 or
Editor: Tim McGovern
Production Editor: Kristen Brown
Copyeditor: Rachel Monaghan
Interior Designer: David Futato
Cover Designer: Karen Montgomery
Illustrator: Rebecca Demarest
July 2016: First Edition
Revision History for the First Edition
2016-08-19: First Release
The O’Reilly logo is a registered trademark of O’Reilly Media, Inc.
Architecting for Access, the cover image, and related trade dress are
trademarks of O’Reilly Media, Inc.
While the publisher and the author have used good faith efforts to ensure that
the information and instructions contained in this work are accurate, the
publisher and the author disclaim all responsibility for errors or omissions,
including without limitation responsibility for damages resulting from the use
of or reliance on this work. Use of the information and instructions contained
in this work is at your own risk. If any code samples or other technology this
work contains or describes is subject to open source licenses or the
intellectual property rights of others, it is your responsibility to ensure that
your use thereof complies with such licenses and/or rights.
978-1-491-96025-7
[LSI]
Architecting for Access:
Simplifying Analytics on Big
Data Infrastructure
Designing systems for data analytics is a bit of a trapeze act — requiring you
to balance frontend convenience and access without compromising on
backend precision and speed. Whether you are evaluating the upgrade of
current solutions or considering the rollout of a brand new greenfield
platform, planning an analytics workload today requires making a lot of
tough decisions, including:
Deciding between leaving data “in place” and analyzing on the fly, or
building an unstructured “data lake” and then copying or moving data
into that lake
Selecting a consolidated analytics and visualization frontend tool that
provides ease of use without compromising on control
Picking a backend processing framework that maintains performance
even while you’re analyzing mountains of data
Providing a full end-to-end solution requires not only evaluating a dozen or
so technologies for each tier, but also looking at their many permutations.
And at each juncture, we must remember we’re not just building technology
for technology’s sake — we’re hoping to provide analytics (often in near real
time) that drive insight, action, and better decision making. Making decisions
based on “data, not opinions” is the end game, and the technologies we
choose must always be focused on that. It’s a dizzying task.
Only by looking at the past, present, and future of the technologies can we
have any hope of providing a realistic view of the challenges and possible
solutions.
This article is meant to be both an exploration of how the analytics ecosystem
has evolved into what it is, as well as a glimpse into the future of both
analytics and the systems behind it. By starting from both ends, we hope to
arrive in the middle — the present — with a pragmatic list of requirements
for an analytics stack that will deal with anything you can throw at it today
and tomorrow. Before we can look at the requirements for a frontend
analytics tool, however, it’s paramount that we look at the reality of the
backend.
Why and How Data Became So Fractured
It’s sometimes hard to believe that distributed systems design is a relatively
new phenomenon in computing. The first experience many of us might have
had with such a system was by downloading the popular SETI@Home
screensaver in the late 90s.
The Search for Extraterrestrial Intelligence (SETI) project is focused on
finding alien intelligence by analyzing massive amounts of data captured
from the world’s radio telescopes. Before SETI@home, the analytics SETI
had been doing on radio wave telescope data required expensive
supercomputers, but the growth of the home PC market and the consumer
Internet in the mid to late 90s meant that the world was inundated with
connected compute capacity.
By spreading their analytics out to “the grid” (tens of thousands of individual
PCs), SETI was able to perform massive parallel analysis of their data
essentially for free. Although SETI was groundbreaking at the time, even
they missed the boat on the actionable possibilities and insights that could
have come from giving open access to their data.
After the data sharing of the early Web in the 90s, and the glimpses of
distributed computing that projects like SETI@home gave us, the early 2000s
was the next great time of upheaval in storage, compute, and connectivity.
Companies like Google, Facebook, Amazon, and others, with data coming
from both users and publishers, began encountering limitations in relational
database management systems (RDBMSes), data warehouses, and other
storage systems. Because these tools didn’t meet the needs of the day for
reliable storage and fast recall, these companies each began building and
open-sourcing systems that offered new storage and processing models.
Baked into these systems was the notion of “linear horizontal scale,” first
conceptualized decades earlier by the brilliant American computer scientist
Grace Hopper.
Hopper was phenomenal at simplifying complex concepts, as evidenced by
the way she described linear horizontal scale, years before it was on anyone’s
radar:
In pioneer days they used oxen for heavy pulling, and when one ox
couldn’t budge a log, they didn’t try to grow a larger ox. We shouldn’t be
trying for bigger computers, but for more systems of computers.
It took about 40 years for Moore’s Law to catch up to her vision, but the
needs of the Internet began appearing right around the same time (the late
80s) that commodity x86 architectures began providing cheap compute and
storage.
The “web scale” of the early 2000s brought us NoSQL engines, MapReduce,
and public cloud — systems that all would have been impossible to build
without utilizing linear horizontal scale to provide high-volume concurrent
access. These systems addressed the problems of the day, typically
summarized as the “three Vs of big data”:
Volume
The ability to deal with very large storage amounts — hundreds of
terabytes or even petabytes
Velocity
The ability to handle massive amounts of concurrent read and write
access — hundreds of thousands or even tens of millions of concurrent
hits
Variety
The ability to store multiple types of data all in a single system — not
only structured data (as rows/columns in an RDBMS), but also
semistructured (e.g., email with “to,” “from,” and the open field of
“body”) as well as unstructured (raw text, images, archive files, etc.)
Some also now refer to a “fourth V” — veracity, referring to the
trustworthiness of the data, especially important when data becomes
replicated throughout an organization.
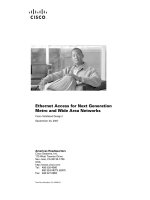
By scaling “out” or “horizontally” (adding more individual computers to
provide more storage or processing) rather than scaling “up” or “vertically”
(adding more resources like CPU or RAM to a single machine), these
systems also deliver assurances for future growth, and provide a great amount
of fault tolerance because the loss of a single compute node doesn’t take the
whole system down (see Figure 1-1).
Figure 1-1. Vertical vs. horizontal scaling
The NoSQL movement brought us distributed storage and analysis engines
like Cassandra and MongoDB. The public cloud movement brought us lowcost, utility-based “infinitely” scalable platforms like Amazon Web Services
(AWS) and Google Cloud Platform, and Google’s MapReduce and GFS
papers heavily influenced the development of Hadoop.
The innovation of the last decade has been an amazing gift to those of us
doing system architecture and software development. Instead of custombuilding tools and systems to meet some need, we can now simply define
requirements, evaluate systems that meet those requirements, and then go
straight to proof-of-concept and implementation.
The Tangled Data Web of Modern Enterprises
But this wide range of options brings with it a new problem: how to properly
evaluate and choose the tools needed for individual storage and analytics
tasks as well as holistic storage and analytics across the organization. Even
more than implementation, correct tool selection is perhaps the biggest
challenge architects and developers face these days.
System selection is tough enough when you’re starting with a blank slate, but
even harder when you have to integrate with preexisting systems. Few of us
get the luxury to design everything from scratch, and even if we did, we
would still find an appropriate place for RDBMSes, data warehouses, file
servers, and the like.
The reality for most companies today is one of great diversity in the size,
purpose, and placement of their storage and computing systems. Here are just
a few you’ll find almost anywhere:
Relational database management systems
These systems serve up the OLTP (online transaction processing) need
— large numbers of small transactions from end users. Think of
searches and orders on the Amazon website, performed by MySQL,
Oracle, and so on.
Data warehouses
OLAP (online analytics processing) systems used by a few internal BI
(business intelligence) folks to run longer-running business queries on
perhaps large volumes of data. These systems are used to generate
answers to questions like “What’s our fastest-growing product line? Our
worst-performing region? Our best-performing store?” Although this
used to be the exclusive domain of expensive on-premise proprietary
systems like Oracle Exadata, customers are rapidly moving to batch
analysis systems like Hadoop/MapReduce, or even public cloud
offerings like AWS Redshift.
NoSQL engines
Used to move “hot” (low latency, high throughput) access patterns out
of the RDBMS. Think of a “messages” table in a social media platform:
an RDBMS would be unable to deal with the sheer number of messages
on Facebook from all the users. This is exactly why Facebook uses a
modified version of the NoSQL engine HBase for the backend of the
Facebook Messenger app.
Data lakes/object stores
Low-cost, infinitely expandable, schemaless, very durable data stores
that allow any and all types of data to be collected, stored, and
potentially analyzed in place. These systems are used as dumping areas
for large amounts of data, and because of the parallelized nature of the
storage, they allow for the data to be summoned relatively quickly for
analytics. Systems like the Hadoop Distributed File System (HDFS) or
AWS’s S3 service fulfill this purpose. These systems are extremely
powerful when combined with a fast processing platform like Apache
Spark or Presto.
It’s no coincidence that one finds Hadoop-ecosystem projects like HBase and
Spark mentioned frequently in a list of modern storage and processing needs.
At its core, Hadoop is a very low-cost, easy-to-maintain, horizontally
scalable, and extremely extensible storage and processing engine. In the same
way that Linux is used as a foundational component of many modern server
systems, Hadoop is used as the foundation for many storage, processing, and
analytics systems.
More than any other factor, Hadoop’s extensibility has been the key to its
longevity. Having just celebrated its 10th birthday, Hadoop and its rich
ecosystem are both alive, well, and continuing to grow thanks to the ability to
easily accommodate new storage and processing systems like the equally
extensible Apache Spark. Hadoop has become somewhat of a de facto
standard for storage and analytics tasks, and Hadoop support is one of the
must-have selection criteria for frontend analytics tools.
Hadoop provides a great deal more than just simple (and slow) MapReduce;
there are dozens of ecosystem projects, like Flume, Sqoop, Hive, Pig, and
Oozie, that make ETL (extract, transform, load) or scripting easier and more
accessible. Without a doubt, one of the most important developments in the
Hadoop world these days is Apache Spark — an extremely fast processing
engine that utilizes system memory (rather than the much slower system disk)
to provide capabilities like native SQL querying capabilities, machine
learning, streaming, and graph analysis capabilities.
Although a great deal of discussion out there positions Hadoop against Spark
(and then goes on to talk about how this signals Hadoop’s demise), Spark is
much more commonly used in conjunction with Hadoop, and it works very
well with the native storage layer of Hadoop (HDFS). Spark brings no native
storage of its own, and it can simply be leveraged as one of the many plug-ins
that Hadoop has to offer. Spark will continue to cannibalize the older, batchoriented MapReduce processing engine, but as for it being the “death knell”
of Hadoop, nothing could be further from the truth.
Combining Spark/Hadoop with public cloud offers even more flexibility and
cost savings. Rather than maintaining an “always on” in-house Hadoop
cluster, many organizations store the raw data in a low-cost data lake like
HDFS or S3, and then spin up the more expensive processing capacity only
when it’s needed, like loading some data into a short-term disposable
Redshift cluster for monthly analytics. The flexibility of public cloud also
means that each processing task can utilize higher or lower amounts of a
specific resource, like high-memory EC2 instances in AWS for Spark
workloads.
It’s also important to highlight that SQL-on-Hadoop technologies like
SparkSQL have matured to the point where strong compliance and fast
queries are both possible. It’s no wonder that SQL-on-Hadoop is becoming a
more cost-effective, expansible alternative to the “one-off” NoSQL engines
popularized just a few years ago. Although still faster than SQL-on-Hadoop
technologies, the NoSQL world introduced some unacceptable tradeoffs for a
lot of organizations: specialized skillsets for both administrators and end
users, maintenance and scaling complexity and cost, and an overly simplified
data access model.
With SQL-on-Hadoop technologies, users get the best of both worlds:
interactive queries that return quickly, and the ability to run rich, SQL-based
ad hoc queries across large, disparate datasets.
Perhaps even more important than Spark is the distributed SQL query engine
Presto. Rather than forcing the processing to run on the same infrastructure
where the data is stored (as Spark does), Presto allows organizations to run
interactive analytics on remote data sources. Presto is the glue that many
modern organizations (e.g., Dropbox, Airbnb, and Facebook) rely on to
quickly and easily perform enterprise-wide analytics. Users evaluating Presto
should take comfort in the fact that Teradata has recently announced a
multiyear commitment to provide enterprise features and support for the
product.
Presto removes a great deal of the complexity involved in coordinating crossengine analytics, but make no mistake: it is simply a backend technology that
simplifies that one task. Just like Spark, it is only a tool to gain lower-latency
responses from the backend. As with Spark (Spark SQL, to be more precise),
its SQL interface allows the necessary and required data
analytics/visualization tools to take advantage of the backend speed and
simplified data access that it provides.
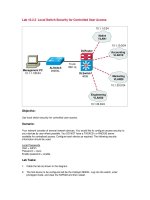
This is pretty much modern reality for many CIOs these days — a mish-mash
of on-premise plus cloud with data being collected and stored in many
systems, potentially using a data lake to replicate the data from those
disparate systems or even act as a single source of truth (see Figure 1-2).
Legacy and proprietary systems like RDBMSes and data warehouses are
mixed in with modern, scalable engines like Hadoop and NoSQL.
Figure 1-2. OLTP, OLAP, data lake, ETL, EDW
Each of these systems performs tasks no other can, and try as we might, a
tangled web of disparate systems is a reality we’ll not soon be able to escape.
Given all the variables that go into modern analytics, it’s no wonder that so
many of us get it wrong. It’s actually a miracle that any of us gets it right!
Requirements for Accessing and Analyzing
the Full Data Web
Now that we understand the mess that is the backend, we can begin to look at
requirements for a frontend analysis tool that can support not only today’s
needs, but tomorrow’s as well. At the top of that list is the requirement that
the tool provide support for a wide variety of data sources. Even if an
organization decides to build a data lake from which all queries can be run,
the reality is that larger organizations will likely still need to run reports or
analytics against the raw data in place as the ETL necessary to move data into
or out of the data lake (or other systems) introduces more complexity,
fragility, and the possibility of “stale” data. Developers long ago coined a
phrase that has great relevance here: “Duplication is the root of all evil.”
Often times, multiple raw data stores may need to be consulted in real time in
a sort of “scatter and gather” pattern, perhaps joining some data from a CRM
(customer relationship management) system with a sales system to determine
customer churn or when to reach out to customers for reengagement to
prevent that churn.
As we’ve seen with the backend world, the use of a platform (like Hadoop or
Spark) is a very powerful tool, and we should look for a true platform in an
analytics engine as well. From the frontend perspective, here are the
requirements we must demand from a modern platform:
Easy, simultaneous access to a wide range of data stores, with a
pluggability layer to accommodate future, unknown storage engines.
The platform absolutely must include rich SQL support for these
backend engines, allowing for complex operations like JOINs across
data sets.
A centralized common data model for disparate business teams.
Company-wide governance, security, and access controls across the
various backend systems.
Collaboration and the ability to generate standardized views that are
shareable, editable, and easily secured.
Accommodating growth by using both industry standard languages and
building on an extensible core.
Flexibility of running in cloud or on premise.
Balance between providing easy self-service/discovery (point and click
for nontechies) and allowing power users the ability to drop down to
SQL and write direct queries whenever needed.
One could certainly argue for any number of additions or edits to this list.
Smaller companies may not yet see the need for governance or collaboration,
but they will when they grow. Enterprises with significant investments in
data centers and/or proprietary systems may not yet be doing public cloud,
but they likely will when the economics of those data centers begin turning
against them.
Analytics/Visualization Vendor Overview
Although it’s become increasingly important in the last decade, the business
intelligence (BI), analytics, and visualization space has been with us for many
decades. Some leaders in the space have been around for 30 to 40 years, with
SAS having been founded in 1976 and MicroStrategy being founded in 1989.
Microsoft, Oracle, SAS, and other tech giants found this market to be
significant profit generators for decades — often selling proprietary software
and hardware as a package.
But the leading products of yesteryear often have a tough time moving to
meet the needs of today, let alone tomorrow. Over the years three BI tools,
Qlik, Tableau, and Looker — founded in 1993, 2003, and 2012, respectively
— have experienced tremendous uptake by focusing on certain modern
requirements. Smaller and more agile than the generation that preceded them,
these companies have been able to listen to customer feedback and pivot to
provide products that better match the needs of today’s companies,
continually and rapidly evolving year after year.
There’s no shortage of papers out there that compare and contrast each
vendor’s product, often losing meaning by providing too many numbers and
not enough context. We’d rather take the opposite approach by providing a
small sampling of the leaders that represent three important cross-sections of
the market: Tableau, MicroStrategy, and Looker. Then we’ll take a deep dive
into a Looker use case, showing how a comprehensive approach to data
access plays out in the organization.
Tableau is no doubt the product with the most traction today. Their guiding
principle from day one has been to focus on the visualization piece, and they
consistently receive top marks for ease of use as well as raw beauty of the
visualizations. End users are fanatical about the product, and Tableau is
fanatical about supporting them and making better and better visualization
capabilities.
But that focus on the end user has come with a price. Tableau started as a
desktop application, and only recently have they begun to answer the demand
for data governance, collaboration, and multiplatform (phone and tablet)
support. Tableau Server is the answer to those requirements, but it still has a
long way to go to catch up to its competitors in these areas.
Tableau is also playing catch-up in the performance arena. Having been
founded at a time when many modern horizontally scaled data engines didn’t
exist (and so couldn’t be accessed in parallel fashion), Tableau moves the
data from the source into the application, thus requiring lots of resources for
the application, and limiting the ability to query across silos in real time.
Despite many recent improvements, Tableau begins to bog down at even
modest amounts of real-time data being accessed unless the data has been
heavily preaggregated or summarized.
At the other end of the spectrum we have MicroStrategy, which has focused
on strong governance, schema development and maintenance, and scalability
from the beginning. MicroStrategy happily eats up large complex data sets
and enables admins to easily and securely create shareable objects that end
users can leverage without needing to know where the data lives.
Having gotten a 14-year head start on Tableau, MicroStrategy represents the
“old guard” of vendors, which historically focused heavily on enterprises.
MicroStrategy brings some of the most advanced features for enterprises,
including multisource, performant, real-time analytics; statistical modeling
via the R programming language; and strong support for cloud BI.
Tableau’s strengths — ease of use, self-service access, and beautiful
visualizations — are MicroStrategy’s weaknesses. In essence the Tableaus
and MicroStrategies of the world have been heavily focused on doing
different tasks very well, and only in the last few years have they started
bridging weaknesses toward each other.
Looker represents a new breed of analytics and visualization tools — one that
benefits from being founded at a time of modern, horizontally scalable
storage engines, disparate data silos, strong governance, and real-time
analytics. Functionally, what Looker and recent products like it aim to do is
marry the pros of Tableau and MicroStrategy without bringing the cons
along.
Trying to provide self-service data discovery without hampering governance
(and vice versa) is a tough nut to crack, but since Looker is offered only as a
web-based product (deployed either in public cloud or on premise), enterprise
and efficiency features like centralization, governance, and collaboration
have been baked into it from the beginning. Unlike other platforms that have
focused on the UI (and are now trying to add governance) or have focused on
governance (and are now trying to simplify the UI), Looker considered both
of these goals equally from day one, and it shows in the way the platform is
easily accessible to both admins and end users.
Looker’s modeling language, LookML, is yet another big differentiator from
other platforms. Built in the industry-standard YAML language, it provides
admins with the capability to either do point-and-click code generation, or
drop down and edit/override the generated code to take over control (even
down to rich, complex SQL queries) when necessary. Using LookML,
admins can quickly and easily deliver a curated experience for each
individual department, providing every group with their specific “view” of
the data, without sacrificing overall governance.
A comprehensive shared modeling language provides value for both admins
and end users. Where quick data access is needed, a point-and-click
connection can be established in minutes, and where only subsets of the data
are required, admins can easily extend the raw LookML with direct, full SQL
queries using WHERE and LIMIT clauses to filter out specific rows or
columns. Of course, full JOINs are possible as well, meaning that data can be
left in place on the disparate engines, and joined only in realtime when the
query runs.
The ability to run queries on the data “in place” means that Looker brings the
same frontend benefits that Presto brings to the backend. This was one of the
main reasons that Looker was chosen as the core of a self-service data portal
by one of the top five healthcare companies in the US.
Enterprise Health Care: An Analytics Use Case
“Our big win was our architecture. ETL projects are huge investments at this
client, so the idea of not having to go back to the ETL/physical layer every
time they wanted to add more dimensionality to their model was a big
factor,” says the project manager for Looker implementation at one of the top
five healthcare companies in America.
This healthcare company had essentially the same list of requirements we
mentioned before: strong governance, multiple data silos (including Hadoop
and legacy SQL engines), real-time analytics, and scalability. While
evaluating a number of analytics tools, the company found that only Looker
provided the necessary performance for real-time queries, and even among
other web-based, real-time analytics engines Looker’s API and modeling
layer (LookML) pushed the product over the top.
As organizations grow larger and larger, so does the disparity of skill sets
working in the organization. While SQL is relatively simple to learn, writing
SQL that runs fast is an art form requiring both an in-depth knowledge of the
underlying data schemas as well as strong experience with SQL itself. The
top-five healthcare company had a number of issues that became apparent
only when Looker was implemented.
“While taking a closer look at what data sits where, we uncovered many slow
queries and reports, many of which were used as a starting point for some
smaller need,” says the Looker project manager. “Using Looker they are now
able to access the data faster, bypassing many of the previous steps and using
the database resources more efficiently.”
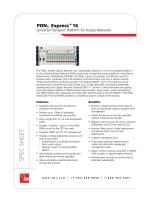
At the core of that efficiency is LookML (see Figure 1-3). By performing
code generation, LookML gives a great “starting point” from which even
those unfamiliar with SQL can easily experiment with, extend, and customize
individual queries. It’s much easier for both admins and end users to simply
modify existing code and queries, and the LookML language is quite
intuitive, using well-thought-out, concise naming conventions and terms. It
all feels familiar and approachable, especially for those with a background in
SQL.
Figure 1-3. LookML interface
Admins can easily connect to any structured (SQL) or unstructured data
exposed either over standard JDBC/ODBC, or any HTTP URL — meaning
that Looker can work with any web-accessible system, whether cloud-based
or on premise. It has native support for over a dozen data sources, including
Spark, Hive, Tez, Presto, Redshift, and even Google’s BigQuery.
For companies like Jet.com, this access to multiple data stores, along with
organization-wide governance, was the most compelling reason Looker was
chosen over competitors.
“Looker’s open architecture let me build a data platform that we can use to
drive, not just report on, Jet.com’s business,” says Nick Amabile, director of
business intelligence at Jet.com.
Being an exclusively web-based product means that there is no “offline” view
of the data — users of the platform have no option but to build their models
and reports in a way that allows for easy collaboration, sharing, and
centralized governance. Generated reports can also be easily shared,
consumed, and integrated into websites via a JavaScript API, and access to
those shared reports can be controlled via a single sign-on leveraging the
Looker identities. Additionally, Looker’s robust APIs and SDKs make it easy
for developers to build applications on top of Looker or integrate data from
Looker into their existing workflow.
Where products like Tableau focus on the frontend, and products like
MicroStrategy focus on the backend, platforms like Looker aim to focus
equally on both. The goal of a modern platform is to provide an organizationwide, single-source-of-truth data and governance model, yet still allow for
self-service and fluid, flexible data discovery and accessibility.
In reality, no single product from any single vendor will likely meet all of
your organization’s needs. Many companies can and do successfully blend
products from many vendors, leveraging each for its individual strengths. As
each individual platform continues to evolve and strengthen, there will no
doubt become fewer and fewer compelling differentiators between them. But
for the near future, the differentiators are large enough that there are
persuasive reasons and use cases for each, and enough differentiators to
validate using multiple platforms in concert.