Embedding analytics in modern applications
Bạn đang xem bản rút gọn của tài liệu. Xem và tải ngay bản đầy đủ của tài liệu tại đây (2.77 MB, 35 trang )
Data
Embedding Analytics in Modern
Applications
How to Provide Distraction-Free Insights to End Users
Courtney Webster
Embedding Analytics in Modern Applications
by Courtney Webster
Copyright © 2016 O’Reilly Media Inc.. All rights reserved.
Printed in the United States of America.
Published by O’Reilly Media, Inc., 1005 Gravenstein Highway North,
Sebastopol, CA 95472.
O’Reilly books may be purchased for educational, business, or sales
promotional use. Online editions are also available for most titles
(). For more information, contact our
corporate/institutional sales department: 800-998-9938 or
Editor: Tim McGovern
Production Editor: Nicole Shelby
Copyeditor: Molly Ives Brower
Interior Designer: David Futato
Cover Designer: Randy Comer
Illustrator: Rebecca Demarest
June 2016: First Edition
Revision History for the First Edition
2016-06-24: First Release
The O’Reilly logo is a registered trademark of O’Reilly Media, Inc.
Embedding Analytics in Modern Applications, the cover image, and related
trade dress are trademarks of O’Reilly Media, Inc.
While the publisher and the author have used good faith efforts to ensure that
the information and instructions contained in this work are accurate, the
publisher and the author disclaim all responsibility for errors or omissions,
including without limitation responsibility for damages resulting from the use
of or reliance on this work. Use of the information and instructions contained
in this work is at your own risk. If any code samples or other technology this
work contains or describes is subject to open source licenses or the
intellectual property rights of others, it is your responsibility to ensure that
your use thereof complies with such licenses and/or rights.
978-1-491-95988-6
Chapter 1. Embedding Analytics
in Modern Applications
Abstract
In our age of “there’s an app for that,” we’re used to having information at
our fingertips. On any given day, people use more than 20 software
applications (cloud, enterprise, or desktop)1 and have approximately 26
mobile applications installed on their smartphones.2 More and more
employees (not just data analysts or C-level execs) are expected to make
data-driven decisions, yet only 20–25% of workers have access to business
intelligence (BI) products.3,4 But when asked, your end users don’t want to
use a “BI tool” — another interface to learn, another login — they want
easily accessible answers. Instead of offering a standalone dashboard, the
new trend is to embed analytics into applications that are already used every
day.
As a software developer or product manager, you know that streamlined
interfaces lead to wider adoption and increased product value. When it comes
to embedded analytics, it’s easy to see the advantages of providing more
intuitive insights (the “why”), but much harder to plan the “how.” This book
provides a guide to delivering analytics within your native application to your
end users.
We’ll review various embedding methods and describe how to select the right
method for your desired interface, including when to custom-build and when
to purchase a BI solution. If you choose a third-party analytics product,
embedded tools present additional challenges for modern applications. For
example, how do you provide best-in-class analytics without sacrificing
product performance? How do you implement needed security boundaries for
your software as a service (SaaS) or multitenant applications? If you use a
third-party BI tool, how can you customize it to match the look and feel of
your custom application? Herein, we’ll review the most common challenges
and best-practice solutions.
Last, we’ll take a deep dive into a case study: Triumph Learning navigated
these obstacles to find the right BI tool for their an innovative educational
tool Waggle. An analytics-first design approach and a quick deployment
phase resulted in a rich, intuitive interface that meets the needs of educators
in the moment.
Drivers for Embedded Analytics
There are a number of factors that have turned the tide toward embedding
(not just offering) analytics. 60% of vendors offer basic reporting capabilities
without extra charge.1 Your users not only expect applications to include
reporting, but in our mobile age, they want that information easily accessible,
no matter what device or browser they’re using to access it.
Embedding analytics in a familiar application allows for a streamlined UI,
leading to wider adoption and product use (“stickiness”). With embedding,
your users are spared a tedious application launch and/or login, allowing you
to provide in-context insights without distraction.
This increases the value of your product through customer retention and a
competitive differentiation that leads to more new customer growth. You can
create varying editions of your product and charge more for advanced
capabilities — on average, software editions that include reports/dashboards
charge $62 more per user.1 Overall, companies using embedded analytics
report a 16% higher annual revenue growth.7
If you’ve already invested resources in analytics, these drivers could indicate
that you’d benefit from an embedded solution:7
Your focus groups report that users value the analytics in your
application
You have an opportunity to monetize the data captured by your
application
You want to offer more sophisticated analytics, or your customers are
reporting some dissatisfaction with the current analytics/reporting your
product provides
You lack sufficient ad hoc or self-service capabilities, resulting in too
much development time providing custom reports or queries
Your competitors’ reporting is superior (and you are losing customers as
a result)
You are planning a migration to SaaS and are not sure your current
analytics solution will meet your needs for a multitenant environment
If one or more of these drivers is true, you may already be discussing what
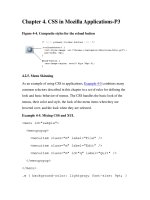
measures you should take to maintain your competitive advantage. A recent
survey by the Aberdeen Group reported that 73% of independent software
vendors (ISVs) have product differentiation as their primary objective for
embedding analytics within their application (as shown in Figure 1-1).8
Updating your product with an embedded solution could provide a product
facelift and best-in-class analytics in a streamlined user interface.
If we’ve sufficiently convinced you that embedding analytics will pay off, the
decision now turns to which embedding method will meet your needs and
whether you should build or buy your tool.
Figure 1-1. Top Objectives of Embedding Analytics: A survey of 61 independent software vendors
currently embedding, or considering embedding, analytics within their solutions8
Interfaces and Methods
Regardless of whether you plan to build or buy an embedded analytics tool,
the desired interface is dependent only on your business needs. Determine
what experience you plan to provide to your users, and then select a method
that can provide that capability. Several interfaces are covered here, along
with methods that pertain to them.
Static Data
This interface provides your users with a simple snapshot in time. The report
can be downloaded (typically as a Microsoft Excel worksheet or a print-ready
PDF) and can be designed for high-volume use. The end user is typically
only allowed to make changes to date ranges and select a downloadable
format. Any changes to the report (or new report requests) must be built by
your developers.
Method: REST APIs or reporting libraries
The most common methods to provide a static data interface are to use a
RESTful API integration to a third-party product or build functionality
around charting libraries, both of which are relatively simple to deploy. To
ensure report queries don’t affect performance, it’s recommended to build or
utilize report scheduling and a report repository as well.9
Interactive Data
An interactive data experience allows users more flexibility in modifying
reports to suit their needs; they can apply filters or select different report
types. This allows them to identify trends and easily flag outliers (features
that are not possible with a static interface). This dashboard approach is a
common way to provide a more customized user experience inside structured
reports.
Method: BI tools offering iFrames (analytics hosted in a separate
tab or page) or custom development
Dashboard interfaces require an orchestration layer, typically managed by a
metadata layer on a reporting server.9 If you purchase a BI solution to create a
dashboard, the product should certainly offer a server interface, and will
likely offer iFrames to support the dashboard framework. If your analytics
solution allows you to customize CSS themes, you can match colors and
styles to the rest of your application for a cohesive interface. Parameters
(such as default values or default settings for filters) are passed directly
through the URL.
iFrames probably meet the needs of most organizations, but may limit future
growth as end users mature and expect more. This method supports
dashboards in a separate portal or tab, and switching from one area of the
portal to a separate reporting tab creates a disconnected user experience.
Additionally, it can be difficult to avoid a scroll bar within the iFrame, adding
to the “clunky” feel.
If you decide to build your own dashboard solution, you have more control;
you can streamline the user experience and fully unify design with the rest of
your application.
Self-Service Exploration
A self-service tool allows users more flexibility to manipulate data in an
easy-to-understand format. Instead of a raw data dump, users can select
clearly named data sets to create their own graphics. A truly exploratory
experience allows users to aggregate data across multiple dimensions and
analyze using drill down, slice and dice, or pivot capabilities.9
Methods: Use an API-based BI tool, use a BI scripting framework,
or custom development
This interface requires a metadata layer (like the dashboard option) and data
integration capabilities. You can find a third-party BI tool to support this
interface (typically through a proprietary API or scripting framework), or this
can be built through custom development.
The Benefits of Building In-Page Analytics
While your analytics interface could be hosted in a separate tab or page (for
example, if you choose a BI tool offering the iFrame method), other products
(like a BI tool that offers an API or scripting framework) could allow you to
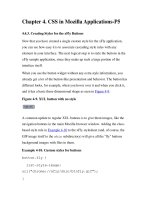
support in-page analytics, as shown in Figure 1-2. This interface can also be
supported with custom development.
Figure 1-2. A mockup of providing static reporting (left) versus hosting analytics in a separate tab or
page (middle), compared to in-page analytics (right)
Users don’t have to be directed to a separate location, but can see data in the
context provided by the rest of the application; this can also offer users the
opportunity to respond immediately to the information they’re digesting. The
term actionable insights is used widely in the BI community, and while most
products provide the insights, it can still be difficult for a user to perform the
action. Consider the cost if you decide to sacrifice that interactivity and build
your analytics in a separate location. IBM showed that productivity increased
by 62% if response times improved.10,11 Analogously, streamlined
interactivity also allows users to act on data without the possibility for
distraction or wandering thoughts. Later on, we’ll discuss how Triumph
Learning built an in-page analytics product that helps teachers identify skill
gaps in real time for grades 2–8.
While in-page analytics is more complex to support, that doesn’t mean it has
to be custom-built or take years to deploy. The time investment depends
largely on whether you decide to build a custom analytics solution in-house
or purchase an embeddable tool.
Build or Buy?
Once you’ve painstakingly designed, built, and optimized your custom
application, it can be hard to imagine an out-of-the-box analytics product
meeting all your needs. If you decide to build your own analytics module,
you do have the advantage of complete control over the functionality and can
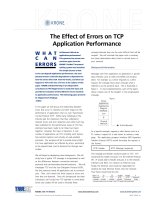
ensure the design is seamless with your product’s branding (Figure 1-3).
Figure 1-3. Why do you build instead of buy BI functionality? A survey of 91 non-BI independent
software vendors12
The Eckerson Group found that 39% of independent software vendors build
their own BI functionality.12 Most (54%) of builders report using open source
libraries, 48% use BI tool APIs, 37% use commercial libraries, and 36%
write their code from scratch.12
This approach works well if you require custom analytic measures or you
have deep in-house BI expertise. But it can be hard to justify the difficulty
and time investment to build your own tool with the recent advances and ease
of embeddable products. Not only does a custom-built solution siphon
resources away from core product development; you may not be able to build
best-in-class functionality nor keep up with (and preconceive) your end
users’ analytics needs.
If the time to deployment or the expertise required deter you from DIY BI,
there are numerous product offerings with embeddable capabilities. This
allows the development team to focus on the core product and let a BI vendor
build best-in-class analytics (Figure 1-4).
Figure 1-4. Why do you buy instead of build BI functionality? A survey of 55 non-BI independent
software vendors12
The obvious concern with buying a solution is whether the product will meet
your business needs, including any custom reporting. Additional challenges
are whether you can customize the design to match the look and feel of your
application, and whether the overhead of an analytics tool will negatively
affect product performance.
Customization challenges are the primary contributor to why only 12% of
ISVs buy an out-of-the-box solution, and the majority (49%) use a mixed
build-and-buy approach.12 Finding a product with an extensible framework
could be key to taking advantage of the quick deployment of a purchased
solution without sacrificing the ability to customize for key metrics or users.
Choosing the Right Tool: Seven Challenges and their
Best-Practice Solutions
Matching a BI product to business needs is one of the most important parts of
the product-selection process. In addition to that key consideration, we’d like
to evaluate additional challenges to the growing field of SaaS and multitenant
applications. For example, can a purchased solution support the complex data
permissions my application requires? Will it work for modern data streams,
like Hadoop? How can I ensure scalability and performance?
While many of these issues used to require a custom-built solution, these
concerns can be mitigated when you find the right product.
THE SEVEN CHALLENGES OF CHOOSING THE RIGHT EMBEDDED
ANALYTICS TOOL
Customization
Will it look like the rest of my application? Can I easily customize it?
Usability
Will it please my customers? Will it provide a seamless experience between the BI and my
application?
Capabilities
Can it meet my business needs?
Multitenancy
Can it support the security and access permissions my product needs?
Scalability
Can it scale with my application?
Data Structure
Will it work for my data structure/support my data streams?
Performance
Will it slow down my application?
Challenge 1: Customization
Will it look like the rest of my application?
You don’t want your users to feel like they are moving between
different applications. Your analytics tool should match the look and
feel of your application as much as possible. Some tools may offer a
selection of themes, but the ability to customize colors, fonts, logos,
buttons, and menu styles offers more opportunity for a seamless user
experience.
A truly “white-labeled” product is more than just the absence of
“Powered By ____” at the bottom of each report. Ensure that URLs,
error messaging, and alerts can be stripped of the vendor brand name so
that your users don’t know they are using a separate product.
Outside of design, it’s important to consider how the tool powers its
visualization. For example, if you have an HTML5 frontend, you want
to select a tool that keeps up with the latest HTML/CSS standards so
that the reporting matches the rest of your product.
Can I easily customize it?
As most (49%) non-BI ISVs choose a hybrid buy-and-build approach,12
selecting a vendor with an open architecture provides you with the
flexibility to adapt the tool to your needs. Customization is cited as the
top challenge ISVs experience when embedding a purchased BI
product.12 Many, many elements could need custom work, such as look
and feel, analytic output, security, and/or deployment scripts (to name a
few).
If the ability to customize the tool is crucial to your product needs, then
your vendor should provide access to a developer community and/or
source code to facilitate development. Do they offer APIs (like
visualization APIs) to provide more flexibility? If the framework is built
from an esoteric or proprietary language, consider the implications that
may have on your ability to customize. In our case study, we’ll discuss
how Triumph Learning customized their analytics using TIBCO’s
Jaspersoft Visualize.js, which is built on an open source library.
Challenge 2: Usability
Will it please my customers?
Getting a product demo will be the easiest way to judge whether the
product interface is clunky or looks outdated. An additional
consideration is whether the product offers mobile or responsive
capabilities: some of your key user personas may interact with your
product primarily through a mobile or tablet interface. Consult your data
for current user-access patterns. If you plan to embed through an iFrame,
iFrames can run in any mobile browser and support most web standards.
For fully embeddable solutions, an SDK would allow you to build a
fully mobile version of your application. (For example, Jaspersoft offers
an open source mobile SDK for iOS and Android.13) This allows you to
modify the UI as needed for an optimal mobile interface.
Will it provide a seamless experience between the BI and my application?
Any embeddable solution will offer single sign-on (SSO) support, so
there will be no interruption between your product and the BI tool. It’s
worth investigating which method(s) are supported to ensure it’s
compatible with your products’ needs. Using common third-party
frameworks (CAS, SAML, Kerberos, LDAP, IWA) is a must, and some
may support custom SSO frameworks through an API as well.
Challenge 3: Capabilities
Can it meet my business needs?
Evaluating analytic capabilities (e.g., types of reports, dashboard
capability, drill down, data exploration, and ad hoc querying) will
already be top-of-mind as part of your product evaluation. The big
question here is, “Will it provide best-in-class analytics?” Because,
frankly, why would you settle for a solution that doesn’t? Even if you
aren’t offering certain functions now (like ad hoc querying or data
exploration), you can future-proof yourself so that a quick pivot or a
response to a competitor can be quickly implemented.
Matching capabilities goes back to the method you choose to embed
your tool. REST APIs allow you to provide buttons within your
application to download static reports; iFrames allow you to host a more
sophisticated report or dashboard in a separate window or tab. Fully
embeddable solutions can provide in-page analytics with interactivity
between the reports and your application. Though iFrames used to be the
predominant method, Eckerson’s survey found that only 18% of non-BI
ISVs used this integration (compared to 38% using REST and 40%
using JavaScript).12 If a vendor only offers REST APIs or iFrames, you
should consider whether these methods are flexible enough to meet your
needs as your product (and your users’ expectations) evolve.
Challenge 4: Multitenancy
Can it support the security and access permissions my product needs?
Currently, more than 50% of new software implementations do not use
an on-premises license.14 By 2018, SaaS is expected to be over 50% of
all enterprise apps sales.15 If you don’t currently offer your product as a
SaaS implementation, you’re probably considering it, making this a key
factor when selecting an embedded analytics vendor.
While cloud-based managed platforms (like GoodData, Domo, and
Birst) are new players in the space, you don’t necessarily have to choose
a SaaS BI product for your SaaS application.
First, consider the structure of your reporting repository for supporting
multitenancy. Do you provide canned reports (where reports are built by
developers and shared by all customers) or custom reports (where
reports built by a developer or the end user are provided to each
customer separately)? In addition, consider how you plan to propagate
resources (e.g., how you deploy a new resource to all customers) and
manage complex user permissions?
To support the complex permissions required in multitenancy, finding a
solution that supports column- and row-level security will be key. This
allows you to specify restrictions for data types (columns) and data
entries (in rows) by user role, tenant, or attribute.16
Lastly, unless you are already fully SaaS, you’ll likely have a planned,
stepwise migration. Look for a vendor with streamlining capabilities to
transition tenants slowly from on-premises to cloud.
Challenge 5: Scalability
Can it scale with my application?
The licensing model used is an important factor in considering