Using TQMS common tools to improve quality performance at garment factory of choishins (VINA) master final project
Bạn đang xem bản rút gọn của tài liệu. Xem và tải ngay bản đầy đủ của tài liệu tại đây (2.16 MB, 83 trang )
HO CHI MINH CITY OPEN UNIVERSITY
UNIVERSITÉ LIBRE DE BRUXELLES
SOLVAY BRUSSELS SCHOOL
OF ECONOMICS & MANAGEMENT
MBQPM 6
NGUYEN NGOC HIEU
USING TQM’S COMMON TOOLS TO IMPROVE QUALITY PERFORMANCE
AT GARMENT FACTORY OF
CHOISHINS(VINA)
MASTER FINAL PROJECT
MASTER IN BUSINESS QUALITY & PERFORMANCE MANAGEMENT
HO CHI MINH
(2018)
STATEMENT OF AUTHENTICATION:
This work has not been submitted for a degree or diploma in any University. To the best
of my knowledge and belief, the project contains no materials published or written by
another person except reference is made in the project itself.
Nguyen Ngoc Hieu
March 20th,2018
ACKNOWLEDGEMENTS:
This projected has been instructed and supervised by Professor Jacques Martin to whom I
would like to extend my sincere gratitude for taking time to guide me from beginning to
the end of this report.
All research, workshops, trial run were carried out at Choishins(Vina) in Tien Giang
Province, Viet Nam with the supports of the management and colleagues there.
I would like to thank Mr. Kwon - General Director, Mr. Leo – Merchandise Manager, Mrs.
Anita – QA manager and Mr. Loc – Production Manager for close coordination.
I would like to thank my family for their encouragement & support.
Academic Tutor and Practical Tutor’s comments:
ACCEPTANCE OF FINAL PROJECT REPORT FOR DEFENSE
Mr Nguyen Ngoc Hieu’s final project report for degree of Master in Business Quality and
Performance Management is official accepted for defense.
The Thesis titled “USING TQM’S COMMON TOOLS TO IMPROVE QUALITY
PERFORMANCE AT GARMENT FACTORY OF CHOISHINS(VINA)”
On ……date…………….
Dr. Jacques M.A. Martin
Academic Director
Master in Master Business in Quality and Performance Management
Solvay Brussels School of Economics and Management – Ho Chi Minh City Open
University.
TABLE OF CONTENTS:
ABSTRACT:.................................................................................................................................................. i
INTRODUCTION ........................................................................................................................................ ii
BACKGROUND OF THE STUDY: ............................................................................................................ ii
OBJECTIVES OF THE STUDY: ................................................................................................................ iii
SIGNIFICANCE OF THE STUDY:............................................................................................................ iii
RESEARCH METHODOLOGY:................................................................................................................ iv
REPORT OVERVIEW: ................................................................................................................................ v
PART I: ASSESSMENT & ANALYSIS CURRENT TQM IMPLEMENTATION STATUS AT
CHOISHINS(VINA)..................................................................................................................................... 1
CHAPTER 1: INTRODUCTION ABOUT CHOISHINS(VINA): .............................................................. 1
1.1
Choishins(Vina) Company:........................................................................................................... 1
1.2
Existing customers: ....................................................................................................................... 2
1.3
Item producing: ............................................................................................................................. 2
1.4
Company organization: ................................................................................................................. 3
CHAPTER 2: REVIEW OF THE EXISTING QUALITY SYSTEM AND MANUFACTURING
PROCESS IN CHOISHINS(VINA). ............................................................................................................ 4
2.1Description of Quality System: ............................................................................................................ 4
2.1.1Quality Policy: .............................................................................................................................. 4
2.1.2 Quality Management System in factory:...................................................................................... 4
2.1.3 Quality Performance Objectives: ................................................................................................. 4
2.1.4 Total Quality Management System: ............................................................................................ 4
2.1.5 Environment management system: follow Buyer’s requirement. ................................................ 5
2.1.6 Factory Quality organization chart .............................................................................................. 5
2.1.7 Internal audit procedures:............................................................................................................. 6
2.2 Introduce about manufacturing flow: .................................................................................................. 7
2.2.1 Fabric and Trim:........................................................................................................................... 8
2.2.2 Sample Room: .............................................................................................................................. 9
2.2.3 Cutting Section: ........................................................................................................................... 9
2.2.4 Sewing Section: ......................................................................................................................... 11
2.2.5 Manufacturing flow in finishing section: ................................................................................... 13
CHAPTER 3: ASSESSMENT OF TQM IMPLEMENTATION AT CHOISHINS(VINA) ...................... 15
3.1 Defining the Quality Management System maturity level:............................................................... 15
3.2
Maturity Diagnostic Instrument Interpretation: .......................................................................... 16
3.3
Score Table: ................................................................................................................................ 22
3.4
TQM practices against TQM ‘s Elements:.................................................................................. 23
3.5
Quality findings: ......................................................................................................................... 24
3.5.1
Quality findings in cutting department: .............................................................................. 24
3.5.2
Defect findings from Endline QC: ...................................................................................... 26
3.5.3
Defect findings from finishing section:............................................................................... 32
PART II: IMPROVEMENT PLAN ............................................................................................................ 38
CHAPTER 1: SOURCES OF IMPROVEMENT: ...................................................................................... 38
1.1Organization maturity ........................................................................................................................ 38
1.2
Outstanding points of TQM adoption and implementation: ....................................................... 39
1.3 Quality Performance pending points: ............................................................................................... 39
CHAPTER2: ACTION PLANS.................................................................................................................. 41
2.1 Suggested action plans: ..................................................................................................................... 41
2.2 Implement action plan: ..................................................................................................................... 42
2.2.1 Set Up Improvement Committee. .............................................................................................. 42
2.2.2 Committee’s Objectives: ............................................................................................................ 42
2.2.3 Conduct training for both management, QC and worker. .......................................................... 43
2.2.4
Traffic Light System application in place: .......................................................................... 46
2.2.5 Revised inline format. ................................................................................................................ 48
2.2.6 Revised Production Quality Tracking Chart: ............................................................................. 49
2.2.7 Action taken from Root Cause Analysis of Physical defect. ..................................................... 50
2.3 Measure the result after implemented: .............................................................................................. 58
2.3.1 Quality control of incoming material: ........................................................................................ 58
2.3.2 Quality control of fabric inspection area:................................................................................... 59
2.3.3 Quality control in cutting area: .................................................................................................. 59
2.3.4 WIP (Work in Process) moving: ................................................................................................ 60
2.3.5 Comparison about Quality Performance Effectiveness. ............................................................ 62
2.3.6 Non-Conformance performance tracking: ................................................................................. 62
2.3.7 Operator Skill Improvement: ..................................................................................................... 63
2.3.8 TQM knowledge of the teams:................................................................................................... 64
2.3.9
Maturity improvement: ....................................................................................................... 65
CONCLUSION: .......................................................................................................................................... 66
References:.................................................................................................................................................. 67
LIST OF FIGURES:
Figure 1 Choishins(Vina) front view. ........................................................................................................... 1
Figure 2 Items factory producing .................................................................................................................. 3
Figure 3 Factory Organization Chart. ........................................................................................................... 4
Figure 4 : QA organization chart. ................................................................................................................. 6
Figure 5: Internal audit flows. ....................................................................................................................... 6
Figure 6: Factory quality flow chart which is updated on May 22nd ,2017. ................................................ 8
Figure 7: Cutting section flows. .................................................................................................................. 10
Figure 8: Sewing Flows .............................................................................................................................. 12
Figure 9: quality control flows in sewing line. ........................................................................................... 13
Figure 10: manufacturing flows in Finishing section. ................................................................................ 14
Figure 11: Illustration of six-level categorization model of Dale and Lascelles (1997) ............................. 16
Figure 12: Fish Bone Analysis of cutting defects ....................................................................................... 25
Figure 13 Pareto chart for endline QC defects. ........................................................................................... 28
Figure 14: fish bone analysis for puckering defect. .................................................................................... 29
Figure 15: fish bone analysis for roping defect........................................................................................... 29
Figure 16: fish bone analysis for Broken Stitch defect. .............................................................................. 30
Figure 17: fish bone analysis for stains defect ............................................................................................ 30
Figure 18: Pareto chart of Finishing section. .............................................................................................. 34
Figure 19: Cause and Effect Diagram of Poor Trimming. .......................................................................... 35
Figure 20: Cause and Effect Diagram of Unstable Measurement............................................................... 35
Figure 21: Cause and Effect Diagram of Oil Stains.................................................................................... 36
Figure 22: Cause and Effect Diagram of Poor Pressing. ............................................................................ 36
Figure 23: defect rate chart among the sections in factory. ........................................................................ 40
Figure 24: Backlog issue in between sections. ........................................................................................... 40
Figure 25: Performance Improvement Consultative Committee. ............................................................... 42
Figure 26: Performance Committee weekly meeting.................................................................................. 43
Figure 27: training again for all QC staffs. ................................................................................................. 44
Figure 28 Training about QC tools usage for all supervisors .................................................................... 44
Figure 29: Traffic Light System Implementation. ...................................................................................... 46
Figure 30: Apply Static chart for all operation. .......................................................................................... 47
Figure 31: New statistical inline QC format application. ........................................................................... 48
Figure 32: Apply Operator’s Quality Graph. .............................................................................................. 49
Figure 33: Suggested form for QA audit defect analysis with goal. ........................................................... 50
Figure 34: Lab Room SOP .......................................................................................................................... 51
Figure 35 Revised sewing line layout ......................................................................................................... 56
Figure 36: Standardize FQA audit SOP ...................................................................................................... 57
Figure 37 Updated incentive scheme .......................................................................................................... 58
Figure 38: changed fabric relaxation method. ............................................................................................ 59
Figure 39: Apply fabric defect library for inspector’s references. .............................................................. 59
Figure 40: Improvement Achievement of Cutting Section. ........................................................................ 60
Figure 41: Eliminated Backlog in between sections. .................................................................................. 61
Figure 42: Merged finishing to sewing line. ............................................................................................... 61
Figure 43: defect rate comparison after improvement. ............................................................................... 62
Figure 44: Non-conformation result from DC audit of before and after improvement. ....................... 63
Figure 45: Employee Performance Summary. ............................................................................................ 64
Figure 46:Maturity level improvement. ...................................................................................................... 65
Figure 47: Maturity score comparison. ....................................................................................................... 66
LIST OF TABLES:
Table 1: Pre-final QA name list .................................................................................................................. 15
Table 2: Maturity assessment table. ............................................................................................................ 21
Table 3: Maturity assessment score table of Choishins(Vina). ................................................................... 22
Table 4: TQM practices against TQM ‘s Elements .................................................................................... 24
Table 5: defect findings table in cutting section. ........................................................................................ 25
Table 6: Five Whys Analysis for cutting defects. ....................................................................................... 26
Table 7: defect findings table in sewing section. ........................................................................................ 27
Table 8: Five Whys analysis for puckering defect. ..................................................................................... 31
Table 9: Five Whys analysis for broken stitches defect. ............................................................................. 31
Table 10: Five Whys analysis for roping defect. ........................................................................................ 32
Table 11: Five Whys analysis for Stains defect. ......................................................................................... 32
Table 12: Defect findings in Finishing section. .......................................................................................... 34
Table 13: Five Whys table for Unstable Measurement issue. ..................................................................... 37
Table 14: Five Whys table for Poor Trimming defect. ............................................................................... 37
Table 15: Five Whys table for Poor Ironing defect..................................................................................... 38
Table 16: Improvement plan. ...................................................................................................................... 42
Table 17: Improvement plan for cutting section. ........................................................................................ 52
Table 18: Acceptable Quality Level table for cutting quality checking. .................................................... 54
Table 19: Improvement plan for sewing section. ........................................................................................ 55
Table 20: TQM improvements achieved. ................................................................................................... 64
ABSTRACT:
The Business environment of Apparel Industry is getting very tough recently. Many
apparel brands were being closed such as Gymboree, Limited, Guess because they can’t
attain their customer’s loyalty. Company tries to cut cost, competition between fashion
companies is being hot than ever and the demand for higher quality with low price is
increasing.
And as an Agent QA, we are paid by customers to work with suppliers to deliver the right
quality of goods to them. As a cost center for customer, how are we still survived in this
context?
The right answer is to try at our best to work closely with manufacturers to improve the
overall quality performance, try to do right first time, deliver the right products to our
customers.
My thesis will discuss about the quality improvement in a fashion garment manufacturer
through practical study. The paper deals with an application of methodology in an industry
which provides a framework to identify, quantify and eliminate sources of variation in an
operational process, to optimize the operation variables, improve and sustain process
performance with well-executed control plans. The application of this paper improves the
process performance of the critical operational process, leading to better utilization of
resources, decreases variations & maintains consistent quality of the process output.
The consequence of my report is to prove that factory can achieve higher quality
performance and enhance customer satisfaction by minimizing reworks activities through
proper utilization of company's internal resources without the need of significant
investment.
i
INTRODUCTION
Quality has become one of the most important decision-making factors for customer
purchasing product. Many companies invested a consider amount of human resources,
capital and time to build the right quality system. However, in many cases, quality system
and improvement models, method and tools are poorly deployed and led too many
frustrated issue for company. Therefore, a smart garment manufacturer will not
underestimate the significance of quality for his business. Garment manufacturing is a
complex industry for many reasons. The product is manually operated, limited knowledge
of the workforce, less data analysis to know where is the root causes. So how to utilize
Total Quality Management (TQM) tools in managing quality performance in existing
sections is the headache challenges to the Middle Management in factory. To support
factory in handling and utilize effectively TQM tools, I here introduce and apply again its
tools in specific control activities to improve and maintain the quality performance in each
section of the factory.
BACKGROUND OF THE STUDY:
Business environment context of fashion industry is changing rapidly, order quantity is
getting smaller, style quantity is increasing. It requires both Li & Fung staff and factory
have to be adapted with this scenario flexibly. More than that, an Agent’s QA, who is
responsible for quality assurance of all shipments delivering to our customers, needed to
persuade factory to look into their current system and flows to see where they are, then
consolidate and improve immediately the pending gaps to consistently provide the good
products to our customer.
And standing in between customer and supplier’s quality performance, I always try to work
with our QAs and suppliers to deliver the goods to our existing customers with acceptable
quality and reasonable price. Choishins(Vina) is one of my in-charge factory and its
performance is not good enough and there are reports of customer receiving goods with
quality issues. Delivery performance also not at that good, merchandise only completed at
the last minutes and factory even doesn’t have enough time to conduct pre-final in prior of
agent’s QA audit. Sometimes we face with difficult situation because of final audit failed
and the goods can’t meet handover date. We can’t continue like this way as it doesn’t
enhance our customer satisfaction at all and it is important to convince factory management
to change.
ii
However, the culture “Fear of Change” is being existed in the mind of the stakeholder from
my in-charge factory. I should prove to them that by seriously applying TQM tools in
inspection, production processes and TQM knowledge training, we can increase accuracy
of operation handling and inspection. Then we will overcome current unexpected
performance and enhance our customer satisfaction.
OBJECTIVES OF THE STUDY:
The objective of this study is to find out how we can improve effectively the quality of
garments by implementing TQM tools (Check sheet, Pareto analysis, Process flow chart,
Cause-Effect diagram). Setting more positive TQM environment in between the teams.
The main possible consequences of this study are:
- Improve TQM knowledge of the teams.
- Reduce non-value-added works from process.
-Quality performance can be improved by solving the problems behind poor quality.
- Productivity can be improved by reducing rework.
SIGNIFICANCE OF THE STUDY:
In today market environment, apparel company is being faced with multiple challenges
such as increasing wage in production countries and Viet Nam is one of the region that is
having high cost, downward pressure on garment prices. Simultaneously, the rise of fast
fashion with reducing order quantity and lead time while increasing order frequency. This
new world of lower volume, higher mix products creates a need for Agent’s QA who is
responsible for quality assurance of all shipments deliver to our customers, to work with
factory to improve and maintain its right first time performance and efficiency.
Quality performance is the vital point to attain the reputation in the eyes of our existing
customers and sustain competition, MY ROLE is to increase the inspection accuracy while
reducing non-value-added works. After worked with me on this project, factory can get
benefits from different categories as below:
-Business result:
Improve customer satisfaction.
Enhances organization’s image and reputation.
iii
-Culture:
Increase quality awareness through all level of organization.
Improve focus and involvement of senior management and staff in Continuous
Improvement.
-Process Management:
Provide a structured and rigorous approach to improve business operations.
Encourage integration of quality oriented initiatives.
Enforce a process management perspective and link processes to results.
-Benchmark:
Help to prioritize improvements,
Help to more effectively measure the progress of organization.
Understand deeply about fore-sewing tasks.
Fully aware of TQM tool’s benefits.
Be able to use TQM tools effectively.
Know how to track daily/hourly production KPIs.
RESEARCH METHODOLOGY:
Initially observe on how factory system works to understand the overall manufacturing &
quality processes. This step helps to understand the plants, what method they follow, how
quality system works. Using benchmark of Dale and Lascelles (1997) model to assess
maturity of factory’s Quality Management System. In the meant time I also checked factory
TQM implement against TQM 8 Elements. Collect quality performance data of Cutting,
Sewing, Finishing. Using TQM’s 7 tools such as Pareto, Check sheet, Cause and Effect
analysis, 5 Whys..etc.. to analyze the collected data and find out the root causes.
Then set up the Performance Improvement Committee, conduct the TQM knowledge,
quality concepts training for all management and workers, introduce of Inline Inspection
on Sewing floor through a pilot line firstly, adjust manufacturing flows to eliminate the
wastes, take corrective actions to solve quality issues from the defined root causes.
iv
REPORT OVERVIEW:
The 1st Part of my report focus about Assessment and Analyze the current quality system
of Choishins(Vina). There are 2 chapters ins Part I, Chapter 1 is reviewing of the existing
flow in different departments such as cutting, sewing and finishing section of the
production floor of factory in order to understand the overall manufacturing & quality
process including materials flow. This step helps to understand the plants, what method
they followed, how it works. And in Chapter 2, I used the benchmarked check sheet to
assess into factory’s system to measure the company maturity and used 8 TQM elements
to check how TQM application in factory. Collect data to identify majorly problems
occurring in factory and utilize the TQM tools of Pareto, Fish Born, Five Whys to analyze
and find out the root causes.
The 2nd Part of my report will mention about Improvement Plan from my findings about
TQM implementation in factory as well as physical defect’s root causes. There are 2
chapters in this part. In Chapter 1, will mention about the source of improvement and
chapter 2 will focus about Action Plan. Tracking of improvements and comparing them
with previous situation in different departments.
v
PART I: ASSESSMENT & ANALYSIS CURRENT TQM IMPLEMENTATION
STATUS AT CHOISHINS(VINA).
CHAPTER 1: INTRODUCTION ABOUT CHOISHINS(VINA):
1.1 Choishins(Vina) Company:
Figure 1 Choishins(Vina) front view.
This is 100% Korea investment company and was set up in May 2013.
It locates in My Tho city, Tien Giang province, it takes 1h30’ travel by car from Ho Chi
Minh City, 2 hours from Tan Son Nhat airport and 2h30’ from sea port.
Land area 16,674m2 or 19,941yard2
21 lines (24 lines after complete)
1,350 employees (1,700 employees)
1
400,000pcs per month capacity (460,000pcs)
100% Export to USA
1.2 Existing customers:
•
•
•
•
•
•
•
•
•
•
Macy’s
Talbots
J. Jill
Michael Kors
Nordstrom
Express
Ann Inc.
White House & Black Market
Anthropologie
Free People
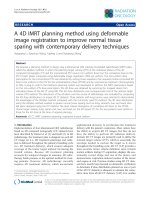
1.3 Item producing:
Company produces Fashion Knit items for famous brands in US.
Lady Top.
Pants.
Dress.
Skirts.
2
Figure 2 Items factory producing
1.4 Company organization:
3
Figure 3 Factory Organization Chart.
From above organization chart, we can see that the administration team is leading by Mr.
K.J Won, Production team is in charge by Mr. K.H. Soo and Quality department is
looking after by Ms. Anita. It is good that quality team is directly reports to General
Director.
CHAPTER 2: REVIEW OF THE EXISTING QUALITY SYSTEM AND
MANUFACTURING PROCESS IN CHOISHINS(VINA).
2.1Description of Quality System:
2.1.1Quality Policy:
Deliver the products with free of defect to customer with reasonable price! And enhance
quality system to satisfy customer expectation.
2.1.2 Quality Management System in factory:
Company has built up quality system and manual but it was not accredited by third party.
And since factory is producing products for different buyers and Choishins is applying
the standards of different buyers into their running system.
2.1.3 Quality Performance Objectives:
It is surprised to me that factory does not have specific goal for each department about
quality performance goals. According to Mr. Kwon, he sets target for the teams to pass
100% final audit by buyer QC.
2.1.4 Total Quality Management System:
Applying 5S tools
Using check sheet to capture the defects but did not see factory doing analysis.
4
2.1.5 Environment management system: follow Buyer’s requirement.
Temperature in production area must be >=200C.
Win speed <=.4m/s
Lighting source in working floor from 70->120lux.
Inspection area >=100 lux.
Noise range: <=90db.
Dust: <= 6,0 mg/m3.
Poison gas <=.1%
Water source for drinking: should be met the test at Pasteur Institute.
Built up environment management system
Declared environment management policy.
Periodically assess environment management system and take action to improve the
pending points to ensure it meets environment set requirement.
2.1.6 Factory Quality organization chart
5
Figure 4 : QA organization chart.
We can see from above chart, QA and QC teams are divided and leaded by different managers who
report to Mr. Kwon, General Manager. Overall, investment for the quality execution manpower is
quite good in this factory.
2.1.7 Internal audit procedures:
Figure 5: Internal audit flows.
Comments: Choishins(Vina) is apparel manufacturer for different retailer brands, he has
his own quality management system and it is not accredited by third party. Quality team
is separated from Production Section and it is leading by General Director, Mr Kwon.
There are two independent teams of QC and QA within the Quality Section. QC team is
6
in charged by Mr. Nhut - QC Manager and QA team is leading by Ms. Anita - QA
Manager.
2.2 Introduce about manufacturing flow:
The research is conducted in garment factory whose major products are fashion top and
dress in various order size. The factory consists of central cutting department, 21
independent sewing lines and centralized finishing and packing. Once fabric received,
factory conduct inspection randomly at 10%. in the meantime, fabric shrinkage, shade
also check in prior of cutting. Factory has relaxation area and fabric is relaxed 24 hours
in prior of cutting. During spreading and cutting, there are 2 QCs to check spreading
quality as well as cut panel accuracy before send them to fusing. Before sending the panel
to sewing line, QC also checks physical defect. Generally, operators are responsible for
the quality of individual work, after that there is quality check at the end of each section
so that there should not be any defective parts passed to the next docks.
Sewing line once received the panels from cutting, they start marking and input
for sewing. One inline QC to randomly check the quality of each operation daily.
Garment after finished sewing, endline QC checks the physical defect, report is signed
daily one time. The current finishing section is separated with sewing lines. Then the
garment after inspected by endline QC is put on a trolley and there is one staff to collect
the garment hourly and move to ironing section. If the Work in Process(WIP) in ironing
section is too much then garment is temporarily put in one place and send to pressing
table gradually until complete.
Garment after ironed, there is one final QC per each ironing table to check the
appearance again before passing the garment to hangtag attachment ..etc..
Overall, Choishins( Vina) Manufacturing Flows is running smoothly but there is some
points that need to be adjusted to achieve better quality ,efficiency as well as manpower.
We will discuss this matter later in the next chapter.
7
Figure 6: Factory quality flow chart which is updated on May 22nd ,2017.
2.2.1 Fabric and Trim:
Once received the fabric and trim from suppliers, factory unloads it from containers and
put on incoming storage racks, there are 2 QCs to be in charge of fabric inspection, based
on 4 points system to check and reported the inspection result to Warehouse Manager.
Factory internal requirement that QC should conduct fabric inspection within 7 days after
fabric arrived. Based on current procedure, once fabric arrived warehouse QC will cut
one yard for color, fabric shrinkage and weight checking. During fabric inspection, QC
8
uses fabric swatch which was dated, chopped and compare the shade between being
checked fabric against standard. QC also checks the shade between left, center, right and
two ends of being checked fabric.
2.2.2 Sample Room:
Factory has one sample room to make Pre-Production sample, Jump Size Set Sample and
TOP sample. There is one QC in sample room, she doesn’t know English. Sample after
finished sewing, QC has checked but there is no inspection record. Since sample room
does have inspection record, unable to see how rejected rate it is. I checked PP checking
record from styles that Li& Fung QA handled and found first pass rate is at 96%. All
machine setting in sample room is being managed by supervisor, no specialized
Mechanic for sample room. IE person to observe the sample making process, measure
and calculate the Sam of bulk.
2.2.3 Cutting Section:
2.2.3.1Process Flow Chart in Cutting Section:
In cutting section fabric rolls are inspected as per work order. These inspected rolls are
segregated on two sides as the quality pass and fail. The pass rolls are taken into the next
operation whereas the fail rolls returned to store with red tags on them. After this,
depending upon the order, size and quantity ratio; the spreader spreads the fabric for
cutting. Depend on the garment construction with fusing or not, the bundles of
approximately 20 to 30 pieces are made and fusing is done simultaneously. After fusing,
all the parts are collected and put in the cutting audit. The bundles which pass the cutting
audit are forwarded to the sewing section (i.e. preparatory section) whereas the fail
bundles were re-worked for correction.
9