Mix Proportions and Properties Assessment of HPC and UHPC Using Low WaterBinder ratios
Bạn đang xem bản rút gọn của tài liệu. Xem và tải ngay bản đầy đủ của tài liệu tại đây (20.05 MB, 5 trang )
rd
The 3 Virtual Multidisciplinary Conference
December, 7. - 11. 2015, www.quaesti.com
Mix Proportions and Properties Assessment of
HPC and UHPC Using Low Water/Binder ratios
Dimirios Konstantindis
Konstantinos Anagnostopoulos
Department of Civil Engineering
Alexander TEI of Thessaloniki
Thessaloniki, Greece
Department of Civil Engineering
Alexander TEI of Thessaloniki
Thessaloniki, Greece
Georgios Sapidis
Athanasios Valmis
Department of Civil Engineering
Alexander TEI of Thessaloniki
Thessaloniki, Greece
Department of Civil Engineering
Alexander TEI of Thessaloniki
Thessaloniki, Greece
Angelos Patsios
Grigorios Grigoriou
Department of Civil Engineering
Alexander TEI of Thessaloniki
Thessaloniki, Greece
Department of Civil Engineering
Alexander TEI of Thessaloniki
Thessaloniki, Greece
Abstract—This paper presents the findings of a research program
aimed at developing a mixture design for high strength and ultra
high strength concrete using locally available materials. Sixteen
different concrete mix designs were examined containing varying
water/binder and coarse/fine aggregate ratios. Concrete mixes
with smaller size aggregates exhibited slightly higher strengths at
a given aggregate content level, while the reduction of
water/binder ratio with a simultaneous increment of
superplasticizer content resulted in a slightly higher strength.
Keywords- High performance concrete, Ultra high performance
concrete, Mixture design
I.
INTRODUCTION
High performance concrete (HPC) and ultra high
performance concrete (UHPC) have been increasingly
attracting industry’s attention worldwide. Reinforced concrete
projects with particular requirements like high rise buildings,
long span bridges, tunnel linings, offshore oil platforms, and
nuclear power plants have employed such materials due to their
superior properties compared to its normal strength
counterparts, such as high compressive strength, modulus of
elasticity, density, and resistance to chemical and physical
deterioration. Durability, economy of long-term maintenance,
economy of construction, opportunity for ergonomical and
better aesthetical solutions by engineers and architects are
among the benefits of utilising HPC and UHPC, but with the
penalty of more stringent quality control requirements.
European Union through the harmonized regulations of the
EUROCODES do not cover neither HPC nor UHPC, thus
creating tremendous competitive limitations for the European
Construction Industry. The European code of practice for the
design of structures for earthquake resistance (EUROCODE 8,
EN1998-Part 1 for buildings and EN1998-Part 2 for bridges)
limits the strength of concrete to C40/50, while EUROCODE 2
1992-Part 1 for the design of concrete buildings (without
earthquake resistance requirements) allow concrete strength of
C90/105. Both EUROCODES 2 and 8 limit the grade of
reinforcing steel to 600 MPa, while the commonly used grade
is 500 MPa (e.g. Greece). Therefore, whenever such materials
are to be utilized in an infrastructure project, the mechanical
properties need to be verified by carrying out relevant
experimental tests thus leading to unavoidable delays and
indirect cost increases. On the other hand, it is unrealistic to
assume that the structural behavior of buildings and bridges
made of high and ultra high strength concrete can be
understood simply by extrapolating the knowledge of current
normal strength counterparts. The proposal to include HPC and
UHPC in the EN version of EUROCODE 8 was put forward,
but the drafting committee decided against it at the time due to
the scarcity of information regarding the performance of
structures using these materials under seismic loading.
From previous experience it is evident that development of
concrete technology mostly relies on empirical approaches [1].
The presented experimental work is part of a broader
experimental program conducted on 120 column specimens to
assess their performance under uniaxial and repeated loading.
The scope of this study was to define the mixture design
method to be used in the production of HPC and UHPC using
locally available materials.
II.
Sixteen different mix proportions, with C1 to C16 notations
were examined for producing HPC in the Concrete Laboratory
at the department of Civil Engineering of the Alexander
Technological Educational Institute of Thessaloniki. The
constituent materials were cement, silica fume, natural crushed
stone sand, natural crushed stone aggregate with a maximum
Civil engineering
10.18638/quaesti.2015.3.1.195
MATERIALS
eISSN: 2453-7144, cdISSN: 1339-5572
- 279 -
ISBN: 978-80-554-1170-5
rd
The 3 Virtual Multidisciplinary Conference
December, 7. - 11. 2015, www.quaesti.com
size of 12.5 mm, tap water for mixing and curing and
superplasticizer. The details of the mixing proportions are
given in Table I. Portland cement type CEM I 52.5 N
according to EN-197-1 was supplied by TITAN cement
producer. The amount of the cement content in the mix ranged
between 550 to 750 Kg/m3. Table II, shows the chemical
composition of the cement used. It has a specific gravity of
3.15 and a blaine fineness of approximately 4.66 m2/Kg. Silica
fume obtained from a ferro-chromite factory was used in all
mix proportions. It has a specific gravity of 2.3 and a blaine
fineness of about 10000 m2/Kg. Its’ chemical composition is
shown in Table III. The amount of Silica fume added in the
mix ranged between 50 to 137.5 Kg/m3. In order to adjust
concrete workability a polycarboxylate ether based
superplasticizer provided by SIKA was selected as high range
water reducer. Its’ properties are summarized in Table IV. The
aggregates used to make HPC were brought from Mount
Olympus. Two size ranges of natural coarse aggregates were
used, the first 12.5 to 6.3 mm and the second 6.3 to 4.75 mm.
Natural fine course aggregate of 4.75 to 0.425 mm was also
used. Table I, also summarizes the amount of water used in the
mix, which ranged between 0.20 to 0.28, along with the
water/binder ratio for each mix proportion, with the binder
including cement and Silica fume. The amount of water
TABLE I.
Mix
C1
C2
C3
C4
C5
C6
C7
C8
C9
C10
C11
C12
C13
C14
C15
C16
The mixing procedure was carried out very carefully in
order to prevent agglomeration and also to promote uniform
distribution of very fine particles. First, all powders and
aggregates were mixed for five minutes at low speed. The
mixing was continued for one more minute, while the required
quantity of water was added, which already contained the
superplasticiser. After five minutes of stirring, the mixture
became fluid. The concrete mix produced was poured into steel
molds and, 24 hours later the specimens were demoulded. All
specimens were cured in water immersion at 20o C until the
day of the test.
The assessment of unconfined compressive strength of the
different concrete mix proportions was performed at 7 and 28
days of curing on cubic specimens (150mm x150mm x150mm)
under a constant strain rate of 0.0043 mm/mm/sec. For the
same curing ages, splitting tensile strength tests were
conducted following the instructions on cylindrical specimens
with a height to diameter ratio of 300 mm/150 mm = 2. The
tests were performed on four specimens and the average values
were recorded. An Instron servohydraulic (model 4500 KPX J4
Static Hydraulic Universal Testing System) compression
testing machine was used for all tests.
MIX PROPORTIONS AND NOTATION
Water/
Binder
ratio
Water
(Kg/m3)
Cement
(Kg/m3)
Silica
Fume
(Kg/m3)
0.284
0.25
0.25
0.25
0.25
0.25
0.25
0.25
0.25
0.20
0.20
0.20
0.20
0.20
0.20
0.20
160
137.4
150
175
187.4
137.4
149
173.6
187.4
97
106.6
124
136
96.9
102
103.8
550
550
600
700
750
550
600
700
750
550
600
700
750
550
550
550
50
50
54.5
63.6
68.2
50
60
70
75
50
60
70
75
50
110
137.5
TABLE II.
Amount (%)
included in the superplasticiser was taken into account in the
water content [2].
Coarse
aggregates
(Kg/m3)
12.5> d > 6.3
(mm)
430
430
421
411
402
430
430
430
Fine aggregates
(Kg/m3)
4.75> d > 0.425
(mm)
Superplasticizer
(Kg/m3)
990
990
981
971
962
1710
1650
1540
1485
1710
1650
1540
1485
990
990
990
15
18
19.63
22.9
24.5
18
23.1
27
29
33
36.3
42.35
41.25
33
42.9
48.13
CHEMICAL COMPOSITION OF THE CEMENT
SiO2
Al2O3
Fe2O3
CaO
MgO
SO3
K2O
Na2O
19.38
4.28
3.24
61.56
3.43
3.09
0.57
0.72
TABLE III.
Amount (%)
SiO2
91
Ignition
loss
3.73
CHEMICAL COMPOSITION OF THE SILICA FUME
Al2O3
1.2
Fe2O3
1.3
Civil engineering
10.18638/quaesti.2015.3.1.195
Coarse
aggregates
(Kg/m3)
6.3> d > 4.75
(mm)
290
290
281
271
262
290
290
290
CaO
0.35
MgO
1.9
SO3
0.95
K2O
2
Na2O
1.3
eISSN: 2453-7144, cdISSN: 1339-5572
- 280 -
ISBN: 978-80-554-1170-5
rd
The 3 Virtual Multidisciplinary Conference
December, 7. - 11. 2015, www.quaesti.com
Aspect
Specific gravity
pH
Chloride ion content
Solid content
Molecular mass
Recommended dosage*
(% by cement weight)
*by supplier
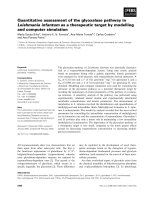
III.
specimens with the fine aggregate’s and water/binder ratio of
0.25 in 7 and 28 days of testing. In Fig. 2 the same trend is
depicted for specimens with water/binder ratios of 0.25 and
0.20.
PROPERTIES OF THE SUPERPLASTISISER
Polycarboxylate ether
Slightly yellow
1.05
6.3 0.5
33 %
44,000 g/mol
0.6 – 1.4
115
110
TEST RESULTS AND DISCUSSION
Table V, summarizes the mechanical properties for all
concrete mix designs. Mix C10, which contained only fine
aggregates of 0.425 to 4.75 mm size, resulted in the highest
compressive strength after 28 days equal to 120.2 MPa, as well
as splitting tensile strength after 7 and 28 days equal to 7.0
MPa and 8.2MPa. The water/binder ratio in the mix was low
and equal to 0.20. However, C13 mix was the one that attained
the highest compressive strength of 104.5 MPa, as well as the
highest splitting tensile strength of 7.2 after 7 days.
C1
C2
C3
C4
C5
C6
C7
C8
C9
C10
C11
C12
C13
C14
C15
C16
Compressive
strength
(28 days)
85.0
91.7
82.2
79.4
81.5
97.8
97.3
93.3
86.6
101.1
98.0
93.0
104.5
96.4
93.5
92.8
98.0
106.0
99.0
97.4
95.1
110.0
107.2
102.0
99.4
120.2
115.0
110.0
116.4
111.7
108.7
104.7
Splitting
tensile
strength
(7 days)
5.2
5.8
5.4
5.1
5.3
6.9
6.7
6.5
6.0
7.0
6.8
6.7
7.2
6.8
6.6
6.5
C8
C9
C6
100
C7
C8
95
90
C9
80
500
550
600
650
700
750
800
Cement content (Kg/m3)
Splitting
tensile
strength
(28 days)
6.6
6.7
6.2
5.9
5.8
7.7
7.4
7.1
6.9
8.2
7.9
7.7
8.0
7.6
7.4
7.2
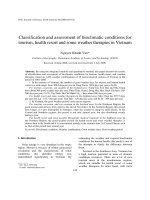
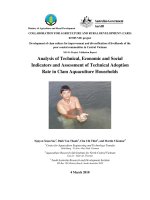
Figure 1. Effect of cement content on compressive strength
125
w/b = 0.25 - 28 days
w/b = 0.20 - 28 days
w/b = 0.25 - 7 days
w/b = 0.20 - 7 days
C6
120
C7
115
C6
110
C8
C9
C7
C8
105
C9
100
95
90
In general, concrete mixing proportions with smaller size
aggregates exhibited slightly higher strengths at a given
aggregate content level. This is evident by comparing C2 - C5
mixes with C6 - C9. The increase of the cement content beyond
550 Kg/m3 appeared to result in a reduction of strength for all
concrete mixes. By comparing C2 with C3 - C5, this strength
reduction is more evident in the case of concretes incorporating
coarse aggregates than in the case of concretes containing finer
aggregates (compare C10 with C11-C13). Fig. 1 depicts the
strength reduction due to the increase of cement content in
85
500
550
600
650
700
750
800
Cement content (Kg/m3)
Figure 2. Effect of cement content on compressive strength for different
water/binder ratios
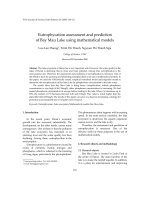
Fig. 3, shows the relation between concrete compressive
strength and water binder ratio. As the water binder ratio
reduces concrete compressive strength increases for both 7 and
28 days of testing. The same trend was observed for splitting
Civil engineering
10.18638/quaesti.2015.3.1.195
28 days
105
MECHANICAL PROPERTIES OF HPC AND UHPC
Compressive
strength
(7 days)
C7
85
Compressive strength (MPa)
TABLE V.
7 days
C6
Compressive strength (MPa)
TABLE IV.
eISSN: 2453-7144, cdISSN: 1339-5572
- 281 -
ISBN: 978-80-554-1170-5
rd
The 3 Virtual Multidisciplinary Conference
December, 7. - 11. 2015, www.quaesti.com
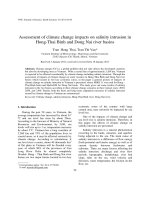
tensile strength as shown in Fig. 4. This is almost linear for
specimens tested after 7 days.
115
C1
7 days
Reduction of water/binder ratio with a simultaneous
increment of superplasticizer content resulted in slightly higher
strengths (Compare C1 with C2, C14 and C6-C9 with C10C13).
28 days
C2
105
8
100
C14
C6
C1
Splitting tensile strength (MPa)
Compressive strength (MPa)
110
from 78.9 to 91 % of the one obtained at 28 days. In addition,
the splitting tensile strength values of all concrete specimens at
28 days of curing ranged from 6 to 7 % of the compressive
strength values.
95
C2
90
C14
85
80
0.15
0.2
0.25
0.3
water/binder ratio
7 days
C7
7.5
28 days
C8
C9
C6
7
C7
C8
6.5
C9
6
5.5
Figure 3. Effect of w/b ratio on the compressive strength
5
8
Splitting tensile strength (MPa)
500
7 days
C1
600
650
700
750
800
Cement content (Kg/m3)
28 days
7.5
550
Figure 5. Effect of cement content on splitting tensile strength
7
C1
C2
IV.
C14
A comprehensive laboratory study was undertaken to
investigate the effect of specific mix design parameters on the
strength behavior of HPC and UHPC specimens. Taking into
account the data and results obtained in this study, the
following conclusions can be drawn:
6.5
C2
6
5
0.15
1. Increasing the silica fume content beyond 10 % by weight
of cement appeared to reduce compressive and splitting
tensile strengths.
C14
5.5
CONCLUSIONS
2. Reduction of water/binder ratio with a simultaneous
incremental increase of superplasticizer content resulted in
a slightly higher strengths.
0.2
0.25
0.3
3. Concrete mixes with smaller size aggregates exhibited
slightly higher strengths at a given aggregate content level.
water/binder ratio
Figure 4. Effect of w/binder ratio on splitting tensile strength
The addition of silica fume in the mix (see C14, C15 and
C16) in excess of 10 % by weight of cement resulted in the
reduction of both compressive and splitting tensile strength.
The compressive strength development of all concrete
mixes after 7 days ranged from 81.4 to 91.4 % of that obtained
after 28 days. Similarly the splitting tensile strength ranged
4. Increasing cement content beyond 550 Kg/m3 appeared to
result in a reduction of strength for all concrete specimens.
The reduction of strength is more obvious in the case of
concrete mixes incorporating coarse aggregates than in the
case of concrete mixes containing finer aggregates.
5. The early strength development (7 days) of all concrete
mixes did not seem to be affected by any of the
aforementioned parameters. It ranged from 81.4 to 91.4 %
and from 78.9 to 91 % of the one obtained at 28 days for
Civil engineering
10.18638/quaesti.2015.3.1.195
eISSN: 2453-7144, cdISSN: 1339-5572
- 282 -
ISBN: 978-80-554-1170-5
rd
The 3 Virtual Multidisciplinary Conference
December, 7. - 11. 2015, www.quaesti.com
compressive strength and splitting tensile strength,
respectively.
6. Splitting tensile strength values of all concrete mixes at 28
days of curing ranged from 6 to 7 % of the compressive
strength values.
National Strategic Reference Framework (NSRF) - Research
Funding Program: ARISTEIA (Excellence) II. The authors
would also like to thank the companies TITAN Cement,
Sidenor S.A. and SIKA Hellas for providing materials.
REFERENCES
ACKNOWLEDGMENT
[1]
This research has been co-financed by the European Social
Fund, European Union and Greek national funds through the
Operational Program "Education and Lifelong Learning" of the
[2]
Civil engineering
10.18638/quaesti.2015.3.1.195
P – C. Aitcin, High Performance Concrete. E & FN SPON, London and
NY, 1998.
C. A. Anagnostopoulos, “Effect of superplasticiser type on the
properties of cement grouts”, in Advances in Cement Research, Vol. 27
(5), 2015, pp. 297-307.
eISSN: 2453-7144, cdISSN: 1339-5572
- 283 -
ISBN: 978-80-554-1170-5