Mans activities and natural disasters have led to a reductions in our natural reef systems. Recreationally, growth in sports fishing, scuba diving, and boating has increased the pressures on these systems. Commercially, our seafood industry is dependent o
Bạn đang xem bản rút gọn của tài liệu. Xem và tải ngay bản đầy đủ của tài liệu tại đây (258.13 KB, 9 trang )
Indian Journal of Marine Sciences
Vol. 33(4), December 2004, pp. 329-337
Wave pressure reduction on vertical seawalls / caissons due to an
offshore breakwater
M G Munireddy
Department of Ocean Engineering, Indian Institute of Technology Madras, Chennai 600 036, India
and
*S Neelamani
Coastal Engineering and Air Pollution Dept, Environmental and Urban Development Division,
Kuwait Institute for Scientific Research, P.O. Box : 24885, 13109 Safat, Kuwait
*[E-mail: / ]
Received 30 January 2004; revised 2 September 2004
The technique to reduce the wave loads on seawalls/caissons is gaining momentum around the world. Placing an
offshore structure in front of seawall/caisson is expected to reduce the loads on these structures. A series of physical model
tests were carried out to examine the order of wave pressure reduction for different height of the breakwater related to the
local water depth. One has to be careful, when the crest of the breakwater is immersed with about 17% of the water depth,
during which, water jetting effect is found to increases the pressures. Modification factor in association with Goda`s formula
is proposed to estimate the shoreward pressures on the seawall in the presence of the offshore breakwater. Statistical
analysis is carried out on the measured pressure data and the wave pressures for 2% probability of exceedence for different
breakwater heights w.r.t. the water depth are given in this paper.
[Key words: Dynamic pressures, seawalls, low-crested breakwater, pool length, piling-up of water]
[IPC Code: Int. Cl.7 E02B 3/06]
Introduction
Vertical coastal structures such as seawalls have
been used for protecting the coastal against wave
induced erosion and caissons are used as breakwaters
of harbors for many years. However, a large number
of these structures are still being damaged by storms
and sometimes can be catastrophic1,2. Extreme wave
actions cause either displacement or overturning of
caissons or progressive damage of structural
components or foundation failures due to liquefaction
or excessive base pressures. The damages are mainly
associated with the impact of breaking waves during
unexpected cyclones. The breaking wave induced
shock pressure intensity on concrete caissons can be
as high as 10 times that of the pulsating non breaking
wave pressures for almost same wave height.
Blackmore & Hewson3 recorded impact pressure of
48.6 kN/m2 with rise time of 0.3 sec. Cyclone induced
waves also cause severe toe scour and cause failures
of seawalls/caissons by sinking or forward tilting.
Scientific community in the coastal engineering area
has thought of various possibilities to reduce the
action of extreme waves on caissons and seawalls in
order to reduce the possibility of above mentioned
failures and also to increase the service life of these
structures. The following methods are proposed:a. Introduction of additional porous wall on the
seaside of the caisson/seawall in order to reduce
the effective exposed area for wave attack and to
accelerate more energy dissipation by turbulence.
b. Construction of horizontally composite caissons,
in which the sea side of the caisson is packed with
rubble stones and hence they take the load and the
caisson/seawall is relatively free from severe
impact. Sometimes during severe wave climate,
the rubble stones are lifted and thrown off by
waves, which may cause structural damage to the
caisson or the properties.
c. Construction of caissons with reduced/submerged
crest level. In this case, the crest level is expected
to submerge well during cyclone wave activity
and hence the load will reduce. However, this will
result in severe overtopping of water mass on the
harbor side.
d. Construction of offshore breakwater as protection
structure for the existing caisson to improve its
330
INDIAN J. MAR. SCI., VOL. 33, NO. 4, DECEMBER 2004
service life or for new seawall/caisson structure
(Fig.1). The offshore breakwater will be located
at an appropriate distance away from the
caisson/seawall towards the sea.
The influence of the presence of the offshore
breakwater, of a certain height with respect to the
local water depth, on the wave pressure reduction on
the caisson is not studied in detail so far. There are
many reports available on studies related to stability,
wave transmission, overtopping etc on offshore
breakwaters4−11. Gonzelz & Prud`homme12 carried out
limited studies on the reduction of forces on vertical
breakwater protected by a seaward submerged
breakwater. The resonating effect of waves in
between the vertical wall and a protecting structure
was studied theoretically by Yip et al.13 using linear
wave theory concepts. The theory did not consider the
energy dissipation character of the protecting
structure, which is one of the factors for controlling
the wave energy transmission. Theoretical estimation
of wave pressure on seawalls/caissons in the presence
of an offshore breakwater is cumbersome and the
results will not be certain for steep and breaking wave
conditions. The best way in such situation is to carry
out the physical model investigation with a suitable
model scale, even though it is time consuming and
strenuous. This is accomplished and reported in this
paper.
Material and Methods
Physical model experiments were carried out in a
wave flume 30 m length, 2 m wide and 1.7 m deep
(Fig. 1). A caisson model of 1.96 m length, 1.20 m
high and 0.87 m wide was firmly fixed with steel
frames on the flume floor. Incident waves were
measured by capacitance type wave gauges in the
absence of the model. Pressure transducers (HBM
P11) were used to measure the wave pressures at
different points on the vertical seaward face of the
caisson. Rubble mound breakwater was designed and
constructed towards the seaward side of the caisson
with two layers, primary and core layer. The armour
weight was calculated using the Van der Meer14
formulae for low-crested and submerged breakwaters.
Water depth (d) of 0.30 m and breakwater crest width
(B) of 0.40 m were kept constant throughout the
experiment. The height of the breakwater varied from
0.20 m to 0.40 m with an increment of 0.05 m.
Two ranges of pool length ratio, Lp/L (0.035 - 0.32
and 0.07-0.64) were chosen. Pool length, Lp is the
distance between the caisson/seawall and the leeward
side toe of the offshore breakwater (Figure 1). L is the
local wave length. For the present study, Lp = 0.5 m
and 1.0 m were selected. Incident wave steepness,
Hi/L and relative wave heights, Hi/d of regular
monochromatic waves were varied from 0.003-0.06
and 0.15-0.51 respectively, where Hi is the incident
wave height. Five different relative height of the
breakwater, h/d were used, where h is the height of
the offshore breakwater (Fig. 1).
Results and Discussion
Prediction of simple pulsating wave loads on
vertical walls is relatively easy, but prediction of the
occurrence and magnitude of more intense wave
impact loads on such structures is more complicated
and calculations of such pressures are often uncertain.
Methods to calculate the wave pressures for vertical
wall type structures for pulsating wave conditions are
described by Goda15. As on day, this is the most
Fig. 1⎯Experimental set-up for the present study
MUNIREDDY & NEELAMANI: WAVE PRESSURE ON SEAWALLS / CAISSONS
widely used prediction method for wave pressures on
vertical walls. The important assumptions made in
Goda's formula are:- a) It takes care of both breaking
and non-breaking wave forces simultaneously in a
single equation, b) The wave pressure from still water
level to the sea bed assumed varies linearly, but in
reality, the variation is cos hyperbolic, c) The formula
also assumes linear variation of pressure from still
water level upward and becomes zero at an elevation
* = 1.5 Hmax, where * is the height above still water
level at which the wave pressure intensity is zero and
Hmax is the design wave height.
The Goda's formula is written as follows:-
p1 = 0.5 (1 + cos β ) (α1 + α 2 cos 2 β ) ρ w g H max
… (1)
p 2 = p1 /[cosh(2πh' ' / L )]
… (2)
p3 = α 3 p1
… (3)
α1 = 0.6 + 0.5 ⎡⎣( 4π h ''/ L) /sinh ( 4π h ''/ L)⎤⎦
{
α 3 = 1 – h /h'' [1- 1 / cosh (2ph''/L)]
'
a. Significant non-linear contribution of waves at
SWL in the depth limited shallow waters.
b. Absence of rubble mound base below the upright
section of caisson which is expected to help some
energy dissipation and percolation.
c. The additive term (α2 cos2β) in Eq. (1) is zero.
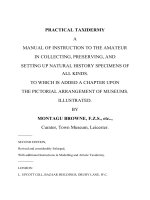
The time histories of the measured wave pressures
at SWL on the seawall in the presence of offshore
breakwater with different relative height of the
breakwater, h/d is shown in Fig. 4. This figure is for d
= 0.30, Hi = 0.11 m and T = 1.4 s, where T is the wave
period. The measured wave pressure, especially in the
presence of the breakwater can be divided into two
… (4)
}
… (5)
… (6)
Pressure coefficient α2 represents the tendency of
the pressure to increase with the height of the rubble
mound foundation. The coefficient α2 in Eq. (5)
becomes zero, when hb and d are equal, as in the case
of present study. Hence the Eq. (1) can be written as
p1 mod = 0.5 (1 + cos β ) α1 ρ w g H max
high measured wave pressures on the caisson
compared to Goda's15 theory are:
2
α 2 = min ⎡⎣ ( hb − d ) / 3 hb ⎤⎦ ( H max / d ) , 2 d / H max
2
331
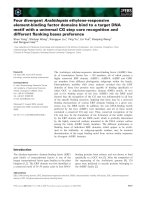
Fig. 2⎯Comparison of the measured wave pressure on the
seawall [pressure at still water level without breakwater]
… (7)
p1mod is < p1 in Eq. (1) because the additive term
(α2 cos2β) vanishes. Measured shoreward wave
pressure ratio at still water level (SWL) on the seawall
without breakwater are compared (Fig. 2) with wave
pressures predicted by the Eq. (7). The x-axis in Fig. 2
is relative water depth, d/L. The measured pressures
are higher than the values obtained by using Goda's15
formula. Sharp peaks of wave pressures are seen
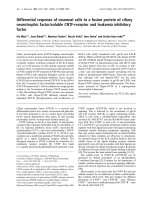
(typical wave pressure time series at the SWL of the
seawall is shown in Fig. 3), which indicates the
impact pressure due to wave breaking on the seawall.
The probable reasons, which can be attributed to these
Fig. 3⎯Typical wave pressure time series at still water level
(SWL) on the seawall [without breakwater, d=0.30 m]
332
INDIAN J. MAR. SCI., VOL. 33, NO. 4, DECEMBER 2004
Fig. 4⎯Typical wave pressure time series at SWL on the caisson for different relative breakwater heights
h/d [d=0.30 m, Hi =0.11 m and T=1.4 s]
MUNIREDDY & NEELAMANI: WAVE PRESSURE ON SEAWALLS / CAISSONS
components. One is the quasi-static pressure and the
other is the dynamic pressure. The quasi-static
pressure component is due to the raising of water
level in between the seawall and breakwater,
compared to the mean water level of the far field. The
piling-up of water inside the pool area is a state of
quasi-equilibrium reached between the mean rate of
water flowing into the protected zone by waves
breaking over the low or submerged breakwater, and
that of water flowing out of the protected zone as a
result of difference in mean water levels inside the
pool and in the seaward side of offshore breakwater.
The two flows are unsteady and periodic. The period
of inflow is about 0.20 to 0.25 T, and that of out flow
is of the order of 0.75 to 0.80 T (Diskin16). Drei &
Lamberti17 have described this as pumping effect of
submerged barriers. The actual dynamic pressure
oscillates above the quasi-static pressure with its own
mean value. This quasi-static pressure effect is more
prominent for the case of low and submerged
breakwater (h/d = 0.66, 0.83 and 1.0). For the case of
emerged breakwater (h/d =1.33), this component is
negligible due to lesser wave overtopping. The value
of the quasi-static pressure can be obtained by
drawing a line parallel to the x-axis through the
lowest value of the pressure time series. It is
interesting to note the following:- a) The pressure
time series without the presence of offshore
breakwater has only a monochromatic component and
the pressure are almost regular; b) The pressure time
series in the presence of offshore breakwater is
irregular and the time series is no more
monochromatic. This is the major physical influence
of the presence of the offshore breakwater. For h/d =
1.33, the wave pressure on the seawall is mainly due
to the waves generated on the pool side by the
percolating energy of the incident waves through the
porous breakwater.
Table 1 shows the normalized SWL pressure ratios
on the seawall Pb/P, where Pb is the average
maximum wave pressure (sum of quasi-static and
dynamic pressure) on the wall in the presence of the
offshore breakwater and P is the average maximum
pressure on the wall in the absence of the offshore
breakwater. Wave pressures corresponding to all wave
heights and periods are used for obtaining the value of
Pb/P. (Pb/P)shore is the shoreward pressure which
occurs during the highest run-up on the seawall and
(Pb/P)sea is the seaward wave pressure, which occurs
during the maximum run-down on the seawall. For
333
example, for h/d = 1.00, and Lp/L = 0.035 – 0.32, the
value of (Pb/P)shore is 0.46. This means that the
presence of the offshore breakwater of this
configuration has reduced the shoreward wave
pressure on the seawall to an average extent of 54%.
For Lp/L = 0.07 - 0.64, the reduction of shoreward
pressure ratio is about 58%. An important observation
is that when h/d=0.83, the average shoreward pressure
ratio (Pb/P)shore increased, compared to h/d=1.0 and
h/d=0.66, especially for Lp/L=0.035-0.32. This is due
to projectile action of jetting waters over the crest of
the breakwater and its direct impact on the seawall
surface below the SWL due to the gravitational action
(Fig. 5), which has resulted in high pressures.
The reason for this is the wave power concentration
due to funneling effect during the wave propagation
over the submerged barriers for this particular
submerged condition of the breakwater. This
phenomenon of submerged barriers is used as
artificial wave breaking simulators in the field for
surfing sports activities, especially in Australia. This
is expected to occur only for a certain range of
relative submergence. This range needs to be avoided
if we adopt submerged structure for force reduction.
This may be the reason, why the submerged pressure
sensors receive higher pressure than the one near still
water level. The effects of breakwater slope and
Table 1⎯Effect of the relative breakwater height (h/d) and
non-dimensional pool length (Lp/L) on average shoreward and
seaward wave pressure ratios at SWL
h/d
1.33
1.16
1.00
0.83
0.66
Lp/L=0.035-0.32
[Pb/P]shore [Pb/P]sea
0.11
0.12
0.46
0.65
0.52
0.15
0.14
0.51
0.51
0.42
Lp/L=0.07-0.64
[Pb/P]shore [Pb/P]sea
0.22
0.32
0.42
0.57
0.67
0.44
0.50
0.40
0.50
0.56
Fig. 5⎯Illustration of water pumping effect of offshore
breakwater for a small submergence of the crest level
334
INDIAN J. MAR. SCI., VOL. 33, NO. 4, DECEMBER 2004
Influence of the relative submergence depth h/d on
wave pressures
Figure 6 provides the effect of h/d on shoreward
pressure ratio at still water level (Pb/ρgHi)shore for
different relative wave heights, Hi/d. The value of the
pressure ratio lies between 0.0 and 1.0. Oscillating
nature of pressure ratio (Pb/ρgHi)shore is observed
when h/d is varied from 0.66 to 1.33. This oscillating
nature of the pressure ratio is mainly due to reflected
and re-reflected waves between the seawall and the
offshore breakwater. The high value of pressure ratio
for h/d = 0.83 is due to the wave pumping/jetting
effect as described in Fig. 5. As can be seen from this
figure that for h/d=1.0, (when top level of the offshore
breakwater is at still water level) the performance of
the detached breakwater is reasonably good, where
the breakwater crest induces significant wave energy
dissipation. For h/d > 1.0, the wave energy is
effectively dissipated and reflected, which results in
significant wave pressure reduction on the seawall.
The following wave-structure interaction processes
are identified during the experimental investigations,
which are explained below for the type of normalized
wave pressure trend observed in Fig. 6:
a. For offshore breakwater with more submergence
(say h/d = 0.66), the waves transmit freely and
reflect from the seawall. These reflected waves
contribute significantly for the wave pressures on
the caisson/seawall.
b. For offshore breakwater with smaller crest
submergence (say h/d = 0.83), the breakwater
induces significant pumping/jetting effect and the
overtopping jet of mass acts on the
seawall/caisson kept behind the breakwater and
impart higher order of pressures (Fig. 5).
c. For the case of the offshore breakwater with crest
level flushing with the still water level (h/d = 1.0),
more of the interacting energy is expected to be
dissipated on the crest of the structure and hence
the wave pressure reduction is significant.
d. For the offshore breakwater with less emergence
(h/d = 1.16), the waves run over the breakwater
and predominantly overtops, and the energy
available with this overtopping water mass
imparts pressures on the seawall. The wave
energy dissipation due to the interaction with the
breakwater reduces due to the significant
overtopping processes.
e. For the offshore breakwater with significant
emergence of the crest (h/d = 1.33), overtopping
will be prevented for most of the waves and the
waves may be allowed to transmit through the
pores of the breakwater. The energy available
with this transmitted wave imparts pressures on
the rear side structures.
Figure 6 with this understanding, gives a clear
picture why the pressure ratio variation is oscillatory
in nature with increased h/d.
Figure 7 shows the effect of non-dimensional pool
length (Lp/L) on the variation of average shoreward
pressure ratio (Pb/ρgHi)shore at SWL for h/d=1.0. The
value of pressure ratio is fluctuating with increased
Lp/L, and making any solid conclusion is doubtful.
The only useful information obtained is that the value
of pressure ratio varies from 0.5 to 1.5. Figure 8 is a
similar plot but for average seaward pressure ratio
Fig. 6⎯Effect of relative height of breakwater, h/d on wave
pressure ratio at SWL [Lp/L=0.15, d/L= 0.092, d/B=0.75]
Fig. 7⎯Variation of shoreward pressure ratio with nondimensional pool length, Lp/L [pressures are at still water level]
amour diameter on the wave transformation were
found to be relatively unimportant18. Hence these two
parameters were kept constant in the present study.
MUNIREDDY & NEELAMANI: WAVE PRESSURE ON SEAWALLS / CAISSONS
Fig. 8⎯Variation of seaward
Lp/L [z/d=1.0, h/d=1.0 and d/B=0.75]
pressure
ratio
with
(Pb/ρgHi)sea. Here, the maximum value of the seaward
pressure ratio is only about 0.3. It shows that the
seawall is pushed by the wave more rigorously than
pull, in the presence of an offshore breakwater. The
significant oscillating trends in Figs 7 and 8 are due to
the resonating behavior of the water mass in between
the seawall and the offshore breakwater. The
interaction between the incident wave and reflected
waves from vertical wall and submerged breakwater
is expected to increase the pore water pressure
amplitude within the seabed19, which is another
important research area in connection with the
foundation design of the present system. Such an
interaction will create a shorter wave. The chaotic
pressure fluctuations on the seawall in the presence of
the offshore breakwater even for regular waves
warrant statistical analysis of the measured data to
obtain meaningful conclusions for the purpose of
design.
It is important to see how the pressure is varying
along the depth of the seawall in the presence of
offshore breakwater. Figure 9 gives the vertical
distribution of shoreward pressure on the
seawall/caisson for different relative breakwater
heights, h/d for a typical d/L of 0.092 and Hi/d = 0.46.
In this figure, the y-axis is z/d, where z is zero at SWL
and positive upward. It is found that the increase in
h/d has reduced the value of wave pressures
significantly. The maximum value of (P/ρgHi) is
about 2.10 for the case of without breakwater and is
only 0.6 for the case of with the breakwater for the
h/d of 1.33.
Effect of the relative pool length (Lp/L) on the
pressure ratio
As mentioned in the previous sections, two ranges
of pool lengths (Lp/L=0.035-0.32 and Lp/L=0.07-0.64)
335
Fig. 9⎯Vertical distribution of shoreward pressure for different
relative breakwater height, h/d. [Lp/L=0.3, d/L=0.092,
Hi/d=0.46 and d/B=0.75]
Fig. 10⎯Comparison of probability of non-exceedence of
shoreward pressure ratio [P/ρgHi] for two different pool lengths
and without breakwater. [Thick line is for Lp/L=0.035-0.32,
thin line for Lp/L=0.07-0.64]
were studied in the present investigation. In order to
get meaningful design information, a statistical
analysis of all pressure values for a particular pool
length range is required. Figure 10 gives the
probability of non-exceedence of shoreward pressure
ratio at still water level (Pb/ρgHi)shore. Each probability
of non-exceedence plot includes all wave heights,
wave periods and all h/d values considered in the
study. It is clear from this plot that the average
shoreward pressure ratio is more when the pool length
is more. Further study is needed to substantiate the
influence of the pool length for wider ranges. An
optimized case should be chosen for the site-specific
conditions. When the pool length is small, i.e., closer
to the primary structure (seawall), it may be
economical because of lesser depths available, but the
hydrodynamic performance of the defense structure
should be evaluated carefully. On the other hand,
larger the pool length in general mean larger local
water depth in the actual coastal water and hence
requires large quantity of rubbles.
336
INDIAN J. MAR. SCI., VOL. 33, NO. 4, DECEMBER 2004
Fig. 12⎯Comparison of observed and estimated modification
factor for the pressures at still water level
Fig. 11⎯Cumulative probability of shoreward average Pressure
ratio [P/ρgHi] for different relative breakwater heights
[z/d=1.0 and Lp/L=0.07-0.64]
Probability analysis
Statistical analysis of shoreward pressure ratio was
carried out to propose appropriate design value of the
wave pressures on the caisson/seawall protected by an
offshore breakwater. The cumulative probability or
probability of non-exceedence of (Pb/ρgHi)shore for the
measured wave pressures at still water level for all Hi
(Hi/d=0.15 - 0.51) and wave periods for Lp/L = 0.07 to
0.64 and for different relative height of the offshore
breakwater is shown in Fig. 11. The normalized
pressure value corresponding to 98% non-exceedence
(i.e. 2% exceedence) can be taken for the purpose of
design of the caisson/seawall. It is seen that when the
caisson is without breakwater, the 2% exceedence
value of (P/ρgHi)shore is 2.75, whereas this value is
reduced to 2.26, 1.98, 1.27, 1.11 and 1.15 when h/d is
varied to 0.66, 0.83, 1.0, 1.16 and 1.33 respectively.
This clearly brings out the relative benefit of
increasing the height of breakwater in a given water
depth.
Modification factor (Sn) for shoreward force
Modification factor is proposed to estimate the
shoreward pressure on the seawall protected by
offshore breakwater. After analyzing the influence of
the non-dimensional parameters on shoreward
pressure a modification factor is derived from
multiple regression analysis. The multiplication of the
modification factor with Goda's formula will give the
pressure on the seawall, when it is protected by the
offshore breakwater.
[ P ]shore = S n [ P ]Goda
… (8)
[ S n ]shore = 0.312 ( h d )
− 1.45
⎛ Hi ⎞
⎜
d ⎟⎠
⎝
− 0.184
⎛ Lp ⎞
⎜
L ⎟⎠
⎝
− 0.185
… (9)
[P]shore is the shoreward wave pressure on the seawall
in the presence of the offshore breakwater, Sn is the
modification factor and [P]Goda is the wave pressure
on the seawall based on Goda's formula. Equation (9)
is the result of the multiple regression analysis. It is
seen that the modification factor is more sensitive for
the change of relative breakwater height, h/d. In the
above equation Lp/L takes care of the effect of wave
period since Lp has taken as constant. Figure 12 shows
the comparison of the observed and estimated [using
Eq. (9)] modification factor for different runs
(different wave heights, periods and h/d) for pressures
at still water level. For most of the runs, the
modification factor is less than 1.0 indicating the
effect of the presence of offshore breakwater. Only
for few runs, the modification factor is more than 1.0,
indication the water jetting effects on the offshore
breakwater.
Conclusion
The effect of the presence of an offshore
breakwater on wave pressures on a vertical seawall is
investigated using physical model studies. The
following conclusions are obtained:a. The measured pressures on the seawall in the
absence of any protection structure are in general
higher than that predicted by Goda`s formulae15.
b. The presence of the breakwater in front of the sea
wall induces irregular wave pressures on the
seawall even for regular wave inputs.
c. Normally it is expected that the wave pressure on
the seawall reduces when the height of the
protecting breakwater is increased for a given
MUNIREDDY & NEELAMANI: WAVE PRESSURE ON SEAWALLS / CAISSONS
water depth. However, when the relative height of
the breakwater h/d is closer to 0.83, and for
certain hydrodynamic input conditions, the
average shoreward pressure ratio is more than
when h/d=1.0 due to water jetting effect over the
breakwater. Such a condition need to be avoided
in order to reduce the wave load on the seawall in
the actual prototype case.
d. The Shoreward wave pressure on the seawall is
higher by at least 4 times compared to the
seaward pressure in the presence of offshore
breakwater. Hence shoreward pressure governs
the design of such system.
e. 2% exceedence value of shoreward pressure ratio,
(P/ρgHi)shore at SWL on the seawall without
breakwater is 2.83. When the breakwater is
introduced with relative breakwater heights
h/d=0.66, 0.83, 1.0, 1.16 and 1.33 the pressure
ratio become 2.26, 1.98, 1.27, 1.11 and 1.15
respectively. This result can be used for design of
prototype system.
f.
A cost benefit analysis by using the present
results is required to select the optimum relative
breakwater height.
g. The results of this study can be used for
rehabilitation of partially damaged seawalls or
design of new seawall with offshore breakwater
as protecting structure.
h. Empirical formula for pressure modification
factor is proposed to estimate the shoreward
pressure on the seawall, when it is protected by
the low-crested breakwater. This modification
factor, when multiplied with Goda's formula
yields the shoreward wave pressure on the
seawall protected by the offshore breakwater.
2
3
4
5
6
7
8
9
10
11
12
13
14
15
16
17
18
References
1
CIRIA, Seawalls: Survey of performance and design
practice, Technical Note 125, (Coastal Industry Research
and Information Association, London, England), 1986.
19
337
Oumeraci H, Review and analysis of vertical breakwater
failures- lessons learned, Coastal Engg, 22 (1994) 3-29.
Blackmore P A & Hewson P, Experiments on full-scale
impact pressures, Coastal Engg, 8 (1984) 331-346.
Müller G U, Hull P, Allsop N W H, Bruce T, Cooker M &
Franco L, Propagation of wave impact pressures into
joints/cracks of block work breakwaters and seawalls, Conf.
Coastal Structures, 99, (2000) 479-483.
van der Meer J W & Daemen I F R, Stability and
transmission at low-crested rubble mound structures,
J Waterw Port Coastal and Ocean Engg, 1 (1994) 1-19.
Allsop N W H, Low-crested breakwaters, studies in random
waves, Proc. Coastal Structure (Arlington, Virginia), 83
(1983) 94-107.
Ahrens J P, Stability of reef breakwaters, J Waterw Port
Coastal and Ocean Engg.,115 (1989) 221-234.
van der Meer J W & d`Angremond K, Wave transmission at
low-crested structures. Proc. Coastal structures and
breakwaters, Institution of Civil Engineers, (1991), 25-41.
Yamashiro M, Yoshida A, Irie I, Experimental study on
wave field behind a submerged breakwater, Proc Coastal
Structures (Balkema, Rotterdam), 99 (2000) 675-682.
Twu S W, Liu C C & Hsu W H, Wave damping
characteristics of deeply submerged breakwaters, J Waterw
Port Coastal and Ocean Engg, 127 (2000) 97-105.
Dean R G, Chen R & Browder A E, Full scale monitoring
study of a submerged breakwater, Palm Beach, Florida,
USA, J Coastal Engg,129 (1997) 291-315.
Gonzalez madrigal B & Olivares prud`home J, Reduction of
wave forces and overtopping by submerged structures in
front of a vertical breakwater in Proc. Coastal Engg, Vol. I
& II, edited by Billy L. Edge (1990) 1349-1361.
Yip T L, Sahoo T & Chwang A T, Trapping of surface waves
by porous and flexible structures, J Wave Motion, 35 (2002)
41-54.
Van der Meer J W, Stability of breakwater armour layersdesign formulae, J Coastal Engg, 11 (1987) 219- 239.
Goda Y, Random seas and design of marine structures,
(University of Tokyo Press, Tokyo, Japan), 1985.
Diskin M H, Piling-up behind low and submerged permeable
breakwaters, J Waterw and Harbour Division, 96 (1970) 359372.
Drei E & Lamberti A, Wave pumping effect of a submerged
barrier, Proc Coastal Structures, 99 (2000) 667-673.
Seabrook S R & Hall K R, Effect of crest width and
geometry on submerged breakwater performance, in 26th Intl.
Conf. on Coastal Engg, June 22-26 (Copenhagen, Denmark)
(1998), pp. 144-145.
Schacht C, Jeng D S & Lemckert C, Experimental study on
waves propagating over submerged breakwater, Proc Coast
& Port (2001), (Gold Coast, Australia), 2001, pp. 539-544.