Nghiên cứu hiệu quả giảm đau sau mổ phổi của gây tê cạnh cột sống ngực liên tục dưới hướng dẫn siêu âm bằng hỗn hợp bupivacain – fentanyl tt tiếng anh
Bạn đang xem bản rút gọn của tài liệu. Xem và tải ngay bản đầy đủ của tài liệu tại đây (433.37 KB, 28 trang )
MINISTRY OF EDUCATION AND TRAINING
MINISTRY OF DEFENCE
108 INSTITUTE OF CLINI CAL M EDICAL AND PHARMACEUTICAL SCIENCES
--------------------------------------------------------
TRAN THANH TRUNG
STUDYING ON THE ANALGESIC EFFICACY
AFTER LUNG SURGERY OF ULTRASOUND - GUIDED
CONTINOUS THORACIC PARAVERTEBRAL BlOCK
WITH BUPIVACAIN - FENTANYL
Speciality: Ane sthesiology
Code: 62.72.01.22
ABSTRACT OF MEDICAL PHD THESIS
Hanoi – 2019
THE THESIS WAS DONE IN: 108 INSTITUTE OF CLINICAL
MEDICAL AN D PHARMACEUTICAL SCIENCES
Supervisor:
1. Ass. Prof. PhD. Trinh Van Dong
2. PhD. Dang Van Khoa
Reviewer:
1.
2.
3.
This thesis will be presented at Institute Council at: 108 Institute of
Clinic al Medical and Pharmaceutical Scienc es
Day
Month Year
The thesis can be found at:
1. National Library of Vietnam
2. Library of 108 Institute of Clinical Medical and
Pharmaceutical Sciences
1
INTRODUCTION
Lung surgery is one of the most painful thoracotomy, so
treatment of postoperative pain is needed. Many methods of pain
relief after lung surgery have bee n studied and applied, of which
epidural anesthesia is considered the "Gold Standard". However,
epidural anesthesia can cause hypotension, nerve dama ge, and is
contraindicated in patients with coagulopathy.
In recent years, thoracic paravertebral block as well as
ultrasound – guided thoracic paravertebral block is being acc epted as
an alternative m ethod for epidural anesthesia. It is becoming
increa singly common and receiving attention from anesthesiologists.
There has also been an increase in studies about thora cic
paravertebral block
all over the world . However, methods
demonstrated in these studies are not homogeneous and the varying
results are causing much debate.
In Vietnam, there are only a few number of studies about
thoracic para vertebra l block and no study about continuous thoracic
paravertebral block as well as the application of ultrasound in the
thoracic paravertebral block for pain after lung surgery. Therefore, we
conduct research on this topic with the aim of:
1.
Comparing
the
postoperative
analgesis
effect
of
ultrasound- guided continous thoracic paravertebral block with
epidural anesthesia using bupivacaine and fentanyl after lung
surgery.
2. Evaluating changes in circulation, respiratory and some
undesirable effects from these two methods of postoperative pain
relief.
2
Chapter 1
OVERVIEW
1.1. Overview of lung surgery
1.1.1. Anatomy summary
1.1.2. Chest opening lines in lung surgery
1.1.3. Methods of lung surgery
1.1.3.1. According to surgery: including cutting one side of the
lungs, one lobe of the lung, two lobes of the lung, a part of the lobe of
the lung or part of the lung, peeled lung surgery.
1.1.3.1. In terms of surgery: including thoracotomy, video
assisted thoracic surgery (VATS) and endoscopic thoracic surgery.
1.2. Pain afte r lung sur gery
1.2.1. Definition of pain: Pain is an unpleasant sensory and
emotional experience associated with actual or potential tissue damage,
or described in terms of such damage.
1.2.2. The degree and duration of pain after lung surge ry
1.2.3. Pathogenesis of pain after lung surgery
1.2.4. Effects of pain after lung surgery
1.2.5. Assess the levels of postoperative pain
There are many ways to assess postoperative pain levels,
such as examining gluc ose, cortisol le vels, using subjective scales,
however, the VAS scale (Visual Analogue Scale) is more used.
1.3. Methods of pain relief after lung surgery
1.3.1. Systemic analgesia
1.3.2. Regional analgesia: continuous infusion of anesthetic
into the incision, intercostal nerve block, intrapleural analge sia,
epidural block and thoracic paravertebral block.
3
1.3.3. Patient Control Analgesia (PCA)
1.3.4.Drug-free technique
1.4. Thoracic paravertebral block
1.4.1. Brief history
1.4.2. Anatomy of the thoracic paravertebral space
The thoracic paravertebral space is a wedge-shaped space tha t
lies on either side of the vertebral column. It is wider on the left than on
the right and ílimited by:
- Front wall: The parietal pleura forms.
- Posterior wall: The superior costotransverse ligament, which
extends from the lower border of the transverse process above to the
upper border of the transverse process below. This ligament connects
with intercostal membrane in the outer.
- Inner wall: the back side of the vertebral body, spinal disc and
split holes between the vertebrae.
1.4.3. Drugs used in the research
1.4.3.1. Bupivacain: There are many drugs used in the
paravertebral block but bupivacain is the most used. It is often combined
with epinephrin to detect mistaken injection into the blood vessels,
reduce circulatory absorption, decrease peak plasma concentrations and
prolong analgesia.
1.4.3.2. Fentanyl: Used in the paravertebral block. The volume of
fentanyl concentration when combined with anesthesia is 1 to 2 µg/ml.
1.4.3.3. The spread of anesth esia in the thoracic paravertebral space
Thoracic paravertebral block takes effect at the corresponding
segments marrow, or it may spread to the contiguous levels above and
below, causing motor, sensory a nd sympathetic blockade on one side,
including primary roots that dominate the abdominal segment of the
abdomen. Eason and Wyatt found that at least four intercostal spaces
could be covered by a single 15-ml injection of 0.375% bupivacain.
4
1.4.4. Methods to identify the thoracic paravertebral space
1.4.4.1. Loss of resistance method: Is the landmark classic
method described by Eason and Wyatt. Anatomical landmark is the
transverse process of the vertebra. Using "loss-of-resistance" technique
to identify the needle that has entered the thoracic paravertebral space,
usually about 1-1.5cm from the shore on transverse process.
1.4.4.2. Pressure measurement method: Pressure monitors are
used to determine the epidural space , which can be used to determine
the thoracic paravertebral space.
1.4.4.3. Neural stimulation method
1.4.4.4. Catheters under ultrasound guidance: Ultrasound can
easily locate and measure the distance from the skin to the transverse
process, the leaves of pleura and the thoracic paravertebral space.
Ultrasound can also show the progress of the needle, determine the
exact location of a needle or catheter whether or not it is within the the
thoracic paravertebral space. Therefore, thoracic paravertebral block
under ultrasound guidance allows for increased safety and efficiency.
1.4.4.5. Ultrasound coordination with nerve stimulation
1.4.4.6. Enter the cavity directly during thoracotomy
1.4.5. Undesirable effects of thoracic paravertebral block
- Undesirable effects related to technical problem: including
blood vessels or pleural puncture, pneumothorax; nerve damage;
pulmonary hemorrhage; hematoma caused by poking into the epidural
space; pain in the anesthesia area; local infection and infection in the
paravertebral space. folding, clogging or slipping of the catheter
- Undesirable effects related to anesthesia: anesthetic intoxication,
anesthetize whole spinal, hypotension, Claude Bernard Horner syndrome.
- Undesirable effects related to morphin: pruritus, vomiting and
nausea, respiratory failure, urinary retention, excessive sedation.
5
Chapter 2
SUBJECTS AND METHODS
2.1. Studying subjects
The study was conducted on 102 patients who received post
opera tive pain relie f after lung surgery, or peeled lung, with the
following criteria:
2.1.1. Selection criter ia for study patients
- Patients with indication to have open lung surgery on one
side according to the program.
- Age: ≥16 year olds.
- Patients who agreed to cooperate with the doctors to conduct
post-operative pain relief methods.
- ASA class I or II (According to the American Society of
Anesthesiologists Classification).
2.1.2. Exclusive crite rial
- Patients do not agree to participate in the study.
- Patients with a history of allergy to anesthesia.
- Patients with diabetes or adrenal insufficiency.
- Drug addicts.
- Patients with a history or currently suffering from mental illness.
- Patients with an infection in anesthesia needle.
- Endoscopic surgery or VATS.
2.1.3. Standard to discontinue the study
- Patients with surgical complications.
- Patients using brea thing machine a fter surgery > 4 hours.
- Reopened.
- Patients do not want to continue to participate in the study.
6
2.2. Times and places of study
From September 2013 to December 2017 a t the anesthesia
department, Central 74 Hospital.
2.3. Research methodology
2.3.1. Research design
The study was conducte d using a randomized, controlle d,
clinical intervention approach.
2.3.2. Sample size and grouping
2.3.2.1. Sample size
Sample size calculated based on the formula for continuous
va riable resea rch has two groups of subjects:
=
C
In which, C is a constant defined from
up the consta nt table C related to
and ß. From looking
and , we choose C = 10.5. ES is
the coefficient of influence.
In this study, we selected each group of 51 patients.
2.3.2.2. Divide the research groups
Patients who had determined eligibility for the study will be
randomly assigned to 2 groups: pa ravertebral block (PVB) and
epidural block (EPB), each group consists of 51 patients.
2.3.3. Instruments, facilities and drugs used in the study
The combination of 0.125% bupivacain - fentanyl 2 µg/ml:
Take 12.5 ml of bupivacain 0.5% + 0.1 mg fentanyl (2ml) to get a
bupivacain and fentanyl mixture. Mix the above mixture of
bupivacain a nd fentanyl with 35.5 ml of 0.9% natricloride to get a 50
mixture of anesthetic bupivacaine 0.125% - fentanyl 2 µg/ml.
7
2.3.4. Method of proceeding
2.3.4.1. Examination, counseling, guiding patients before surgery
2.3.4.2. Prepare patients at the surgery room
2.3.4.3. Conducting anesthesia and surgery
All patients in the study got an endotracheal anesthesia according
to a general regimen.
Maintain a nesthesia with c losed-loop anesthesia system.
When the skin was closed, the patient was given 1 g of paracetamol.
Endotracheal tube withdrawal when qualified.
2.3.4.4. Perform pain relief
* For PVB group
- Insert the catheter into the paravertebral space under
ultrasound guidance
+ Performe when patients finish surgery
+ Patient posture: lying on the side
+ Needle position: T4-5 or T5-6 or T6-7.
+ Use ultrasound to identify anatomical landmarks such as
transverse process, pleural, para vertebral space. Insert needle into
paravertebral space, check the exac t position of the needle tip on the
ultrasound and then proceed with the catheter insertion. Fixed
catheter with optickin and adhesive tape.
- Injection of analgesic
+ Conditions to relieve pain:
ü Patient is alert and endotracheal tube has been withdrawn.
ü Normal pulse, blood pressure, SpO2.
ü Patie nt answere d the question of an asse ssment of pain
level with a VAS pain measurement.
+ Postoperative analgesic injection:
Patients who met the above conditions for pain relie f and have
VAS ≥ 4 points. Inject b upivacaine 0.125% - fentanyl 2 µg/ml with
8
dose of bolus 0.1 ml/kg. Then continuously infuse 0.1 ml/kg/h/24h
first; followed by 0.09 ml/kg/h/24h and lastly 0.08 ml/kg/h/48 - 72h
after surgery.
If VAS < 4 points, examine and evaluate until VAS score ≥ 4,
then proceed to the above pain relie f.
Cases of ineffective pain relief (VAS score > 4): install PCA
morphine intravenously. PCA s ettings: Each press (bolus): 1mg/1ml
morphin; lock time: 15 minutes; maintenance dose: no; total dose
limit: 10 mg/4 hours.
- Time of withdrawal of the catheter: After ge tting the
research data of timestamp H 72 .
- Design for pain relief after catheter withdrawal : If there is
still pain after removing the catheter, install the PCA morphin
intravenously with the above settings
* For EPB group
- Insert the catheter into the epidural space
ü Perform when the surgery is finished
ü Patient posture: lying on the side
ü Needle position: T4-5 or T5-6 or T6-7.
ü Using loss of resistanc e technique
- Injection of analgesic
+ Conditions to relieve pain: similar to PVB group.
+ Postoperative analgesic injection:
Patients who met the above conditions for pain relief and had
VAS ≥ 4 points. Inject bupivac aine 0.125% - fentanyl 2 µg/ml with
bolus dose: (height-100)/10 ml. Maintain dose as PVB group.
Cases of poor or ineffective pain relief: install PCA morphin
intravenously. PCA settings as PVB group.
- Time of catheter withdrawal and design of pain relief
after catheter withdrawal: similar to PVB group.
9
2.3.5. Indicators needing evaluation in the study
2.3.5.1. Indicators of general characteristics
- Indicators of general characteristics of resea rch subjects.
- Indicators of anesthesia - surgery characteristics.
- Indicators of te chniques of the thoracic para vertebral block.
2.3.5.2. Indicators of effeciency of pain relief after surgery
- VASstatic and VASdynamic scores at: H 0, H 1/4 , H 1/2 , H 1, H 2, H 4,
H6, H12, H24 , H48 và H 72.
- Proportion of patients and supplemental morphine used.
- The amount of anesthetic bupivacaine and fentanyl consumed.
- The spread of anesthesia on feeling.
- Index of blood glucose a nd cortisol test.
- Satisfaction level of patients after surgery.
2.3.5.3. Indicators of assessme nt of circulation, respiratory
and some side effe cts
- Heart rate, average blood pre ssure, breathing rate, SpO 2 at
the follow-up time within 72 hours after surgery.
- Respiratory function and arterial blood gas.
- Undesirable effects related to anesthesia techniques, anesthetics and morphine drugs.
2.3.6. Some definitions and standards used in the study
- Waiting time for the effects of anesthesia: from the initial
bolus injection until the pain point of VAS < 4 points.
- Assess the level of postoperative pain relief: based on the
pain rating of VAS.
- Evaluate patient satisfaction according to Subramanian.
- Evaluate the exte nt of diffusion of anesthetic: using the pins
– prick test to stimulate the skin of the chest area of patients from T 1
to T12 on both sides and lower limbs, a sk patie nts about fe eling.
- Evaluate the level of respiratory depression according to Guy.
10
- Evaluate vomiting: 4 levels according to Myles.
- Evaluate the level of motor blocka de on Bromage scale.
- Evaluate Aubrun's secret level.
2.3.7. Some catastrophes and direction of management
- Anesthetic poisoning: stop injecting anesthetic, give
sedation, anticonvulsant, respiratory resuscitation and circulation,
intravenous infusion of 20% lipid solution (intralipid).
- Full spinal a nesthesia: circulatory resusc itation (fluid
infusion, vasoconstrictor) and artificia l re spiration (ball squeezing,
endotracheal intubation).
- Hypotension: ra pid infusion (0.9% natricloride, high
molec ular weight) and e phedrin .
- Bradycardia: atropine sulpha te 0.5 mg intravenously.
- Slow breathing: Monitor breathing, if less than 10 beats
/minute give patient na loxon 0.4 mg intravenous or re spiratory
support.
- Pneumothorax: often self -exacerbated. If there is large air
spill then suck air or dra in the pleura.
2.4. Analyzing and processing data
The research data were analyzed and proce sse d using SPSS
16.0 software .
11
Chapter 3
RESEARCH RESULTS
3.1. General characteristics
3.1.1. Characteristics of the research objects
The average age of PVB group was 48.8 ± 16.2 yea rs, of the
EPB group was 45.0 ± 13.5 years.
There was no difference in age, gender, height, weight, BMI
and ASA levels between the two groups (p > 0.05).
3.1.2. Characteristics of surgery
There was no difference in surgical method, incision line,
le ngth of incision between two groups (p > 0.05).
There was no difference in the dose of drugs used in
anesthesia,
anesthesia
durations,
surgery
times,
pulmonary
ve ntilation times and endotracheal withdrawal time s (p > 0.05).
3.1.3. Characteristics of thoracic paravertebral block
The distance from the skin to the transverse process was 3.0 ± 0.6 cm.
The distance from the skin to the paravertebral space was 4.3 ± 0.64 cm.
First-needle-puncture success rate is 94.1%.
3.2.
Comparing
postoperative
analgesis
effects
of
ultrasound- guided continous thoracic paravertebral block with
epidural anesthesia
3.2.1. Waiting time for analgesic effect
The waiting time for analgesic effects in the PVB group was
11.9 ± 6.02 minutes and in the EPB group was 11.6 ± 6.45 minutes.
There was no difference in waiting time for analgesic effect between
the two groups with p > 0.05.
12
3.2.2. Drug used and spread of anesthetic
The total dose of bupivacaine used for 72 hours after surgery
in the PVB group was 432.4 ± 75.01 mg and in the EPB group was
446.2 ± 74.53 mg. The total dose of fentanyl used for 72 hours after
surgery in the PVB group was 335.8 ± 58.21 µg, in the EPBl group
was: 346.4 ± 57.86 µg. There was no difference in the total dose of
bupivacaine a nd fentanyl between the two groups.
The extent of the anesthetic spread after 15 minutes of injection
in PVB group was 4.6 ± 0.8 vertebra, lower than EPB group: 4,9 ± 1,1
vertebra, the difference was statistically significant with p <0.05.
From after the second injection onwards, the extent of the anesthetic
spread in the two groups did not differ (p > 0.05).
3.2.3. Postoperative pain level in two groups
3.2.3.1. The degree of pain when resting (VAS static ) in two groups
Table 3.1. VAS scores when resting (VAS static ) in two groups
Groups
Times
PVB (n = 51)
X
SD
Min-Max
EPB (n = 51)
X
SD
Min-Max
p
H0
6.9 ± 1.4
4 - 10
6.5 ± 1.2
4-9
> 0.05
H1/4
3.5 ± 1.0*
2-6
3.5 ± 0.9*
2-6
> 0.05
H1/2
2.9 ± 0.8*
2-6
3.1 ± 0.7*
2-5
> 0.05
H1
2.7 ± 0.6*
2-4
2.7 ± 0.5*
2-4
> 0.05
H2
2.6 ± 0.6*
2-4
2.7 ± 0.8*
2-6
> 0.05
H4
H6
2.6 ± 0.6*
2.5 ± 0.9*
2-4
1-5
2.5 ± 0.6*
2.4 ± 0.6*
2-5
1-4
> 0.05
> 0.05
H12
2.1 ± 0.6*
1-5
2.2 ± 0.6*
1-4
> 0.05
H24
1.9 ± 0.5*
1-3
2.0 ± 0.72*
1-4
> 0.05
H48
1.6 ± 0.6*
0-3
1.7 ± 0.7*
0-3
> 0.05
H72
1.4 ± 0.8*
0-3
1.5 ± 0.8*
0-3
> 0.05
Notes: * p < 0.01 versus H0
13
Comment:
The VAS static scores at the times of the study in the two groups
was not statistically significant. The VASstatic scores at the times of
15 minutes after injection was reduced statistically significant
compared to H0.
3.2.3.2. The degree of pain when dynamic (VASdyn ami c) in two groups
Table 3.2. VAS score when dynamic (VAS dynamic ) in two groups
Groups
PVB (n = 51)
X
Time s
SD
EPB (n = 51)
X
Min-Max
SD
Min-Max
p
H0
8.0 ± 1.2
6 - 10
7.8 ± 1.1
6 - 10
> 0.05
H1/4
4.8 ± 0.9*
3-7
4.4 ± 0.9*
3-7
> 0.05
H1/2
3.9 ± 0.9*
3-6
3.7 ± 0.7*
3-5
> 0.05
H1
3.6 ± 0.8*
2-6
3.6 ± 0.7*
3-5
> 0.05
H2
3.4 ± 0.6*
2-5
3.4 ± 1.0*
2-8
> 0.05
H4
H6
3.1 ± 0.6*
3.1 ± 1.1*
2-4
2-7
3.2 ± 0.9*
3.0 ± 0.7*
2-7
2-5
> 0.05
> 0.05
H12
2.6 ± 0.8*
2-6
2.6 ± 0.8*
2-5
> 0.05
H24
2.4 ± 0.5*
2-4
2.5 ± 0.6*
2-5
> 0.05
H48
2.1 ± 0.6*
1-4
2.3 ± 0.6*
2-5
> 0.05
H72
2.0 ± 0.6*
1-3
2.0 ± 0.5*
1-3
> 0.05
Notes: * p < 0 .01 versus H0
Comment:
The VAS dynamic scores at the times of 15 minutes after injection
onward was significantly reduced compared to H0.
The VAS dynamic scores at the times of the study in the two
groups was not statistically significa nt.
3.2.4. Assess the levels of pain relief in two groups
The level of pain relief when the patient remained still at the
14
postoperative time of the two groups was not statistica lly significant
(p> 0.05).
From the time of H24 onwards, the level of pain relief was
good and approximately at 100% in both groups. At H 48 and H 72, the
proportion of patients with good a nalgesia in the PVB group was
highe r than that of the EPB group, but the difference was not
significant (p> 0.05).
3.2.5. Proportion of patients and additional morphin use d
B ng 3.3. Percentage of patients required additional analgesia by PCA
Groups
PVB
EPB
PCA
n
%
n
%
Yes
10
19,6
7
13,7
No
41
80,4
44
86,3
Total
51
100,0
51
100,0
p
> 0,05
Comment:
The percentage of patients required additional analge sia by
PCA with morphin in PVB group and EPB group was not
statistically significa nt.
Table 3.4. Total doses of additional morphin used
Groups
Morphin (mg)
PVB
EPB
(n=10)
(n=7)
Total doses
X ± SD
5.2 ± 3.6
3.7 ± 2.5
in 24 hours
Min - Max
1 - 20
1 - 10
Total doses
X ± SD
8.6 ± 5.2
5.8 ± 4.0
in 48 hours
Min - Max
1 - 23
1 - 15
Total doses
X ± SD
10.1 ± 6.6
8.7 ± 5.2
in 72 hours
Min - Max
3 - 23
3 - 16
p
> 0 .05
>0 .05
> 0 .05
15
Comment:
The total doses of morphin used for additional pain relief in
the two groups was not statistically significa nt.
3.2.6. Characteristics of gluc ose and cortisol levels
Table 3.5. Glucose levels (mmol/l)
Groups
PVB
EPB
Time s
(n = 51)
(n = 51)
Before surgery
5.7 ± 1.0
6.1 ± 2.7
> 0.05
Before injecting drugs
8.5 ± 2.2*
8.5 ± 3.0*
> 0.05
The first day after surgery
7.7 ± 2.4*
7.4 ± 3.1*
> 0.05
The second day after surgery
6.7 ± 1.4*
6.3 ± 1.3
> 0.05
The third da y after surgery
6.3 ± 2.4
5.9 ± 1.3
> 0.05
p
Notes: * p < 0.01 compared to before surgery
Comment:
The glucose leve ls at different times were not statistically
significant. The glucose concentration of the epidural group before
injection and in the first day after surgery increased more than
before surgery (p <0.01).
Table 3.6. Cortisol levels (µg/dl)
Groups
PVB
EPB
(n = 51)
(n = 51)
Before surgery
11.3 ± 6.4
12.0 ± 5.7
> 0.05
Before injecting drugs
26.6±12.2*
28.4±11.5*
> 0.05
The first day after surgery
19.6 ± 6.6*
22.6 ± 6.1*
> 0.05
The second day after surgery
17.1 ± 5.4*
17.5 ± 5.3*
> 0.05
The third day after surgery
15.6 ± 4.8*
14.9 ± 5.1*
> 0.05
Time s
Notes: * p < 0.01 versus before surgery
p
16
Comment:
The cortisol concentration of the two groups before the
injection and after surgery increased significantly compared to
before surgery. At the second day after surgery, cortisol levels were
lower in PVB group than in EPB group.
%
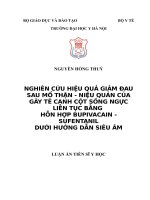
3.2.7. Satisfaction levels of patients of pain relief methods
100
78.5 82.3
PVB
p > 0,05
EPB
80
60
17.6 15.7
40
3.9
20
0
Very satisfied
Satisfied
2
Satisfaction levels
Unsatisfied
Figure 3.1. Satisfaction le vels of pain relief methods
Comment:
The proportion of patients who rated from a bove satisfaction
with PVB group and EPB group were 96.1% and 98% respectively.
There is no difference in satisfaction level between the two groups.
3.3. Changes in circulation, respiratory and unwanted effects
3.3.1. Changes in circulation at the time of postoperative
Heart rate after inj ection of the EPB group was higher than
that of the EPB group. The difference, however, was not statistically
significant (p > 0.05).
The average blood pressure of PVB group is higher than that
of EPB group at H1 time (p < 0.01) and H 2 (p < 0.05). At the
remaining times, the difference was not statistica lly signific ant (p >
0.05).
17
3.3.2. Changes in respiratory at the time of postoperative
3.3.2.1. Changes in breathing rate and SpO2
After injection, breathing rate of EPB group wa s significantly
lower than ve rsus H 0 (p < 0.01).
There was no difference in spO2 after surgery (p > 0.05).
3.3.2.2. Changes in respiratory function
Ventila tion function of both groups was lower than before
surgery (p <0.01).
The re covery of PEF in the second and third days after surgery
of the PVB group was better than the EPB group, the diffe rence was
statistically significa nt with p < 0.01.
3.3.2.3. Changes in arterial blood gas
At the time of the study, the pH, PCO 2, PO 2 and HCO3- inde x
Proportion %
of the two groups did not differ (p > 0.05).
3.3.3. Undesirable effects
10
8
6
4
2
0
9.8
p > 0,05
5.9
PVB
EPB
5.9
3.9
Und esirable effects
Poked into the
blood vessels
Pain at the needle
position
Figure 3.2. Undesirable effe cts related to technical
Comment:
The rate of poked into the blood vessels and pain at the needle
position of the PVB group is lower than that of the EPB group, but
the difference is not statistically significant.
No cases of pneumothorax, fold or occlusion of the catheter or
infection at puncture point.
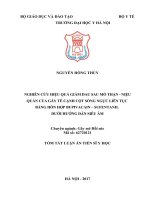
%
18
17.6
20
15
PVB
p < 0,05
11.8
9.8
10
5
0
EPB
3.9
0
Hypotension
0
Und esirable effects
Respiratory
inhibition
Inhibition of
movement
Figure 3.3. Undesirable effects related to anesthetic
Comment:
The prevalenc e of complications of hypotension, respiratory
depre ssion and inhibition of movement of the lower extremities in
the EPB group was higher than versus the PVB group, the difference
was statistica lly significant with p < 0.05.
There were no cases of total spinal anesthesia, epidural
anesthesia due to parave rtebral anesthesia or drug poisoning.
Proportion%
25
20
p > 0 ,05
p > 0,05
15.7
15
7.8
10
p > 0,05
19.6
p > 0,05
15.7
11.8
9.8
5.9
7.8
5
0
Vomiting,
nausea
Tremor
PVB
Urinary
retention
EPB
Undesirable
Pruritus effects
Figure 3.4. Undesirable effects related to morphin
Comment:
The rate of unwanted effects related to morphine family drugs
such as vomiting, nausea, urinary retention, pruritus, tremor of two
groups did not differ significantly.
19
Chapter 4
DISCUSSION
4.1. General char acte ristics
4.1.1. Characteristics of the research objects
Our study found no significant difference in mean age, height,
weight and BMI between the two groups (p> 0.05). Me n a ccount for
a higher proportion than women, with no gender difference between
the two groups (p > 0.05).
This result is consistent with the study of Singh (2017) with
the ra tio of male/female in 2 groups at respectively 19/6 and 16/9.
This is because the rate of patients with lung disease in men is
usually higher than in women.
4.1.2. Characteristics of surgery
The surge ry in our study includes cutting: 41.2% and
decortica tion: 58.8%. There were no differences in the type of
surgery between the two study groups (p> 0.05).
The use of opioid drugs and the characteristics of anesthesia
time, duration of surgery, pulmonary ventilation time and duration of
endotracheal intubation a ffect the postoperative pain level
4.1.3. Characteristics of thoracic paravertebral block
Our studies have used ultrasound-guided to locate the
transverse process, paravertebral space, pleural as well as
determining the distance from the skin to these anatomica l
la ndmarks, therefore the success rate was relatively high.
4.2. The postoperative analgesis effect of ultrasound- guided
continous thoracic paravertebral block with epidural anesthesia
4.2.1. Waiting time for analgesic effect
The duration of the a nalgesic effect varies depending on the
20
anesthetic technique, the conce ntration and volume of anesthesia
used. Acc ording to Nguyen Hong Thuy, the average waiting time for
pain relief is 14.7 minutes (10-20 minutes). Hara found that she
started to reduce the pain after 10 minutes. For Abdallah, the average
la tency is 10 minutes (10.3 - 14.3 minutes).
4.2.2. Drug used and spread of anesthetic
There was no difference in the total dose of bupivacaine and
fentanyl between the two gro ups.
The time from after the second injection onwards, the extent
of the anesthetic spre ad in the two groups did not differ (p > 0.05).
4.2.3. Postoperative pain level in two groups
The VAS score during both resting time and activities at the
time of study of the EPB group was lower than the PVB group.
However, the difference was not statistically significant (p > 0.05).
This result is similar to the s tudies of Pinta ric, Gulbahar. In contrast,
Richardson found that the VAS for rest point and c ough were
significantly lower in the paravertebral anesthesia group compared
with the e pidural group(p = 0.02 and 0.0001, respectively).
4.2.4. Assess the levels of pain relief in two groups
The level of pain relief when the patient remained still at the
postoperative time of the two groups was not statistically significant
(p> 0.05). Doan Kim Huyen did not record a statistically significa nt
difference in mild pain, moderate pain and severe pain between the
two groups a t the study time both at rest and on exertion (p> 0.05).
4.2.5. Proportion of patients and morphin used after surgery
The proportion of patients requiring analgesic supplementation with intravenous PCA morphin in the PVB group was 19.6%
highe r than that of the EPBl group (13.7%), however the difference
was not statistica lly significant with p > 0.05. Me anwhile, the total
dose of morphine used, total times required for PCA and the number
21
of non-response times in the two groups were also not statistic ally
significant (p> 0.05). Gulbahar found no difference in the need for
morphine sulphate supplemental pain between the two groups.
4.2.6. Characteristics of blood gluc ose and cortisol levels
Blood glucose and cortisol c oncentrations at different times
were not statistically significant (p > 0.05). Gulbahar's study s howed
that the mean serum glucose concentration was higher post-surgery
than before surgery with p = 0.001 in the PVB group and p < 0.01 in
the EPB group. El-Hamid sa id that there was an increase in blood
cortisol levels at the postoperative time compared to before surgery
and there was no differe nce in blood cortisol levels between the two
groups at the corresponding times.
4.2.8. Satisfaction levels of patients of pain relief methods
The proportion of patients who rated from above satisfaction
with PVB group was 96.1%; and that of EPB group was 98%. There
was no difference in satisfa ction level between the two groups (p >
0.05).
Our results are consistent with Ria in, the post-opera tive
satisfaction score on the average 10-points scale is 9 points.
4.3. Changes in circulation, respiratory and more undesirable
effects
4.3.1. Changes in about circulation and respiratory at the time
of postoperative
The results of our study show that paravertebra l anesthesia is
more hemodynamically stable than epidural anesthesia, which is also
consistent with studies by Swati Bisht (2015), O Cucu (2005) a nd
Richardson (1999). Pintaric (2011) also has similar conclusions that
paravertebral anesthesia has consistently resulted in similar analgesic
but hemodynamic stability compared to epidural anesthesia in
patients with thoracotomy.
22
After surge ry, lung ventilation function decreased significantly
compared to before surgery (p < 0.01). However, rehabilitation of
postoperative ventilation is better than in the PVB group. This result
is also consi stent with the research results of Bisht and Richardson ,
which state that respiratory function is better preserved in the PVB
group than the EPB group.
Throughout the study, the pH, PCO 2, PO2 and HCO 3- index of
the two groups did not differ (p > 0.05). Our results are consistent
with Aly (2010), the author also commented that pH, PaO 2, PaCO 2 of
PVB group and EPB groups were similar at the postope rative time.
4.3.2. Some undesirable effects
Undesirable effects related to anesthesia technique of PVB
group include poking into the blood vessels: 3.9%, pain at the needle
position: 5.9%. The effects were lower than the EPB group (5.9%
and 9.8%), but the difference was not statistica lly signific ant with p
> 0.05. According to Na ja, the rate of blood vessels was 6.8%, blood
stasis was 2.4%, pain at the nee dle position was 1.3%, pleural
perforation was 0.8% and pneumothorax was 0.5%.
Our ra te of hypotension is similar to that of El-Hamid (no
respiratory depression, hypotension: 3.3% in PVB group compared
to 20% in EPB group), lower than Öztürk (28% in EPB group) and
highe r than the PVB group (p = 0.02).
The rate of unde sirable effects related to morphine family
drugs of the two groups did not differ significantly (p> 0.05). Marret
found that side e ffects (nausea, vomiting, urinary retention) were less
common in PVB group (30% compared with 75%, p <0.005. ElHamid met complications in PVB group such as nausea: 16%;
vomiting: 0%, urinary retention: 0%, pruritus: 6.6% while in the EPB
group the rate was 30%, 10%, 16.6% and 16.6%
23
CONCLUSION
1. Ultrasound - guided continous thoracic paravertebral block for
pain after lung surgery has good efficac y, e quivalent to epidural
anesthesia, as shown in the VAS at resting and dynamic scores at
all timelines; total dose of bupivacain and fentanyl use d for 72
hours after surgery; plasma glucose and cortisol after surgery
increa sed more than before surgery of the two groups were not
different statistically significant (p > 0.05). The percentage of
patients requiring PCA and total doses of supplemental morphin
in the ultrasound- guided continous thoracic paravertebral block
group and the epidural group were not significantly different (p>
0.05): 19.6% and 10.1 ± 6.6 mg versus 13.7% a nd 8.7 ± 5.2 mg,
respectively.
2. Thoracic paraverte bral block was less like ly to affect circulation
and breathing than epidural anesthesia: the perce nta ge of patients
with hypotension and respiratory depression was 3.9 and 0%
ve rsus 17, 6% and 9.8% (p < 0.05). The recovery of FVC, FEV1
and PEF of the thoracic paravertebral block group was better
than epidural anesthesia group (p <0.01). The perc entage of
undesirable effects in the ultrasound- guided continous thora cic
paravertebral
block
group
were
low,
no
dangerous
complications, this perce ntage of unde sirable effects were not
different statistically significant versus epidural anesthesia. (p >
0.05): poke d into the blood vessels (3.9% versus 5.9%); pain at
the needle position (5.9% versus 9.8%); urinary retention (7.8%
ve rsus 19.6%), pruritus (11.8% versus 15.7%), corresponding to
two groups.