ielts writing
Bạn đang xem bản rút gọn của tài liệu. Xem và tải ngay bản đầy đủ của tài liệu tại đây (679.53 KB, 45 trang )
Preparing for the IELTS test with Holmesglen
Institute of TAFE
The writing component
The IELTS writing test takes one hour. In this time you are required to
complete two tasks.
TASK ONE is a report based on some graphic information provided on the
question paper. With few exceptions, the graphic information will come in
one of five forms – a line graph, bar graph, pie chart, table or diagram
illustrating a process. You are required to describe the information or the
process in a report of 150 words. This task should be completed in 20
minutes. It is important that you are familiar with the language appropriate
to report writing generally and to each of the five types of report.
TASK TWO is an essay based on a topic given on the question paper.
You should write at least 250 words in 40 minutes.
It is important that you keep within the advised time limits as Task Two
carries more weight in your final band score than Task One. Remember
that illegible handwriting will reduce your final score.
Writing task one: single line graph
Task description
You will be given a graph with a single line. Your task is to write a 150
word report to describe the information given in the graph. You are not
asked to give your opinion.
You should spend around twenty minutes on the task. Task one is not
worth as many marks as task two and so you should make sure that you
keep within the recommended twenty minute time frame.
What is being tested is your ability to:
♦ objectively describe the information given to you
♦ report on a topic without the use of opinion
♦ use suitable language to describe the graph
© 1999 Holmesglen Institute of TAFE
1
Sample task
You should spend about 20 minutes on this task. Write a report for a
university lecturer describing the information in the graph below. You
should write at least 150 words.
Cases
600
500
400
300
200
100
0
1960
1965 1970 1975 1980 1985 1990
Incidence of X disease in Someland
1995
When you’ve finished the task
How good is your answer? Check the guidelines on the next page and
read the sample answer.
© 1999 Holmesglen Institute of TAFE
2
Guidelines for a good answer
Does the report have a suitable structure?
♦ Does it have an introduction, body and conclusion?
♦ Does it include connective words to make the writing cohesive within
sentences and paragraphs?
Does the report use suitable grammar and vocabulary?
♦ Does it include a variety of sentence structures?
♦ Does it include a range of appropriate vocabulary?
Does the report meet the requirements of the task?
♦ Does it meet the word limit requirements?
♦ Does it describe the whole graph adequately?
♦ Does it focus on the important trends presented in the graphic
information?
Sample answer
The graph shows the number of cases of X disease in
Someland between the years 1960 and 1995. As an overall
trend, it is clear that the number of cases of the disease
increased fairly rapidly until the mid seventies, remained
constant for around a decade at 500 cases before dropping to
zero in the late 80s.
In 1960, the number of cases stood at approximately 100. That
number rose steadily to 200 by 1969 and then more sharply to
500 in 1977. At this point the number of cases remained stable
until 1984 before plummeting to zero by 1988. From 1988 to
1995 Someland was free of the disease.
In conclusion, the graph shows that the disease was
increasingly prevalent until the 1980s when it was eradicated
from Someland.
What do you think?
What is your opinion of this sample answer? How well does it meet the
requirements of the guidelines? Read the next page for a teacher's
comments on this answer.
© 1999 Holmesglen Institute of TAFE
3
Teacher's comments on the sample answer
Here is what an IELTS teacher said about the sample answer.
The report structure is easy to follow and logical with a clear
introduction, body and conclusion. The candidate uses
cohesive words to connect pieces of information and make the
writing flow such as ‘until’and ‘before’in the second sentence.
The candidate uses a variety of grammatical structures and
vocabulary so that the writing is not repetitive.
In terms of task requirements the report is a little short but
this is because the simple graph used as an example does not
have sufficient information for the candidate to describe. In the
real IELTS test the graph will have more information and so
the need to look for trends will be even greater than in this
example.
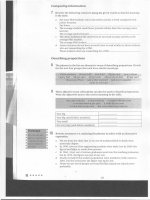
Strategies for improving your IELTS score
Selecting information
It is important that you describe the whole graph fully. However, this does
not mean that you should note every detail. In most cases there will be too
much information for you to mention each figure. You will therefore need to
summarise the graph by dividing it into its main parts. This is what we
mean by describing the trends.
For example, in a chronological line graph it might seem sensible to
describe the information year by year or period by period. The graph
above gives the information in five year sections so we could write our
report like this:
The number of cases of X disease started at 50 in 1965 and
then went up gradually to 100 in 1965 and continued up to
200 in 1970 and then went up more sharply to 380 in 1975.
While this way of describing the information may be accurate, it does not
meaningfully sum up the information in the graph. In fact, the information
in the graph would most meaningfully be described in four chronological
sections following the shape of the graph.
© 1999 Holmesglen Institute of TAFE
4
In the Sample Task, the graph shows four main trends:
♦ first, a gradual increase from 1960 to 1968
♦ second, a steeper increase from 1968 to 1977
♦ third, a plateau from 1977 to 1983
♦ fourth, a drop from 1983 to 1988
The structure of the report must show these four main trends clearly.
Report structure
Your report should be structured simply with an introduction, body and
conclusion. Tenses should be used appropriately.
Introduction
Use two standard opening sentences to introduce your report. These
opening sentences should make up the first paragraph. Sentence one
should define what the graph is about; that is, the date, location, what is
being described in the graph etc. For example:
The graph shows the number of cases of X disease in Someland
between the years 1960 and 1995 …
Notice the tense used. Even though it describes information from the past,
the graph shows the information in the present time.
Notice that the sample opening sentence does not simply copy the words
used on the graphic material. Copied sentences will not be assessed by
the examiner and so you waste your time including them.
Describing the overall trend
Sentence two (and possibly three) might sum up the overall trend. For
example:
It can be clearly seen that X disease increased rapidly to 500
cases around the 1980s and then dropped to zero before
1999, while Y disease fell consistently from a high point of
nearly 600 cases in 1960 to less than 100 cases in 1995.
Notice the tense used. Here we are talking about the occurrence of the
disease in the past.
© 1999 Holmesglen Institute of TAFE
5
Describing the graph in detail
The body of the report will describe the graph or graphs in detail. You will
need to decide on the most clear and logical order to present the material.
Line graphs generally present information in chronological order and so
the most logical order for you to write up the information would, most
probably be from earliest to latest. Bar graphs, pie charts are organised in
different ways and so you need to decide on the organisation of each one.
Concluding sentences
Your report may end with one or two sentences which summarise your
report to draw a relevant conclusion.
Grammar and vocabulary
Avoiding repetition
You will receive a higher mark if your writing uses a range of structures
and vocabulary correctly rather than a limited number. For example, the
candidate who writes:
The number of cases of X disease started at 50 in 1965 and
then went up to 200 in 1970 and then went up to 500 in 1980
and then went down to zero in 1990.
will lose marks for being repetitive. You should therefore practise writing
reports using a wide variety of terms to describe the different movements
in the graphs and different structures to vary your writing.
Describing trends
Trends are changes or movements. These changes are normally
expressed in numeric items, for example, population, production volumes
or unemployment. There are three basic trends:
© 1999 Holmesglen Institute of TAFE
6
Expressing movement: nouns and verbs
For each trend there are a number of verbs and nouns to express the
movement. We can use a verb of change, for example:
Unemployment levels fell
Or we can use a related noun, for example:
There was a fall in unemployment levels
Direction
Verbs
Nouns
Rose (to)
Increased (to)
Went up (to)
Climbed (to)
Boomed
A rise
An increase
Growth
An upward
trend
A boom (a
dramatic rise)
Fell (to)
Declined (to)
Decreased (to)
Dipped (to)
Dropped (to)
Went down (to)
Slumped (to)
Reduced (to)
A decrease
A decline
A fall
A drop
A slump (a
dramatic fall)
A reduction
Levelled out (at)
Did not change
Remained stable (at)
Remained steady (at)
Stayed constant (at)
Maintained the same level
A levelling out
No change
Fluctuated (around)
Peaked (at)
Plateaued (at)
Stood at (we use this phrase to
focus on a particular point,
before we mention the
movement, for example:
In the first year, unemployment
stood at … )
A fluctuation
Reached a
peak (of)
Reached at
plateau (at)
© 1999 Holmesglen Institute of TAFE
7
Describing the movement: adjectives and adverbs
Sometimes we need to give more information about a trend as follows:
There has been a slight increase in the value of the dollar
(degree of change)
Unemployment fell rapidly last year (the speed of change)
Remember that we modify a noun with an adjective (a slight increase)
and a verb with an adverb (to increase slightly).
Describing the degree of change
Adjectives
dramatic
sharp
huge
enormous
steep
substantial
considerable
significant
marked
moderate
slight
small
minimal
Adverbs
dramatically
sharply
enormously
steeply
substantially
considerably
significantly
markedly
moderately
slightly
minimally
Describing the speed of change
Adjectives
rapid
quick
swift
sudden
steady
gradual
slow
© 1999 Holmesglen Institute of TAFE
Adverbs
rapidly
quickly
swiftly
suddenly
steadily
gradually
slowly
8
Exercise
Use the following terms and any others necessary to describe the graph
below.
initially, stood at, dip/dipped, peak/peaked, level/levelled out
450
400
350
300
250
200
150
100
50
0
'83
'84
'85
'86
'87
'88
'89
'90
'91
'92
Number of cases of X disease in Someland between 1983 and 1992
Describing a trend
We can describe a trend by looking at:
♦ the difference between two levels
♦ the end point of the trend
Describing the difference between two levels
This year unemployment has increased by 20,000 cases (the
difference between this year and last year is 20,000 cases).
This year there has been an increase in unemployment of 5%.
Notice the prepositions. We use to increase by (with the verb) and an
increase of (with the noun).
Describing the end point
This year unemployment has risen to 10% (the end result is that
unemployment is up to 10%).
This year there has been a rise in unemployment to 10%.
Notice the prepositions. We use to rise to (with the verb) and a rise to
(with the noun.
Exercise
Write 3 sentences describing the graph below using by, of and to.
© 1999 Holmesglen Institute of TAFE
9
Cases
1600
1400
1200
1000
800
600
400
200
0
'75
'80
Number of children in X orphanage
'85
Expressing approximation
We use words to express approximation when the point we are trying to
describe is between milestones on the graph.
just under
well under
roughly
approximately
about
just over
well over
nearly
around
Writing task one: double line graph
Task description
You will be given a graph with two lines. Your task is to describe the
information given in the graph by writing a 150 word report. You are not
asked to give your opinion.
You should spend around 20 minutes on the task.
What is being tested is your ability to:
♦ objectively d��������������������������������������������������������������������������������������������������������������������������������������������������������������������������������������������������������������������������������������������������������������������������������������������������������������������������������������������������������������������������������������������������������������������������������������������������������������������������������������������������������������������������������������������������������������������������������������������������������������������������������������������������������������������������������������������������������������������������������������������������������������������������������������������������������������������������������������������������������������������������������������������������������������������������������������������������������������������������������������������������������������������������������������������������������������������������������������������������������������������������������������������������������������������������������������������������������������������������������������������������������������������������������������������������������������������������������������������������������������������������������������������������������������������������������������������������������������������������������������������������������������������������������������������������������������������������������������������������������������������������������������������������������������������������������������������������������������������������������������������������������������������������������������������������������������������������������������������������������������������������������������������������������������������������������������������������������������������������������������������������������������������������������������������������������������������������������������������������������������������������������������������������������������������������������������������������������������������������������������������������������������������������������������������������������������������������������������������������������������������������������������������������������������������������������������������������������������������������������������������������������������������������������������������������������������������������������������������������������������������������������������������������������������������������������������������������������������������������������������������������������������������������������������������������������������������������������������������������������������������������������������������������������������������������������������������������������������������������������������������������������������������������������������������������������������������������������������������������������������������������������������������������������������������������������������������������������������������������������������������������������������������������������������������������������������������������������������������������������������������������������������������������������������������������������������������������������������������������������������������������������������������������������������������������������������������������������������������������������������������������������������������������������������������������������������������������������������������������������������������������������������������������������������������������������������������������������������������������������������������������������������������������������������������������������������������������������������������������������������������������������������������������������������������������������������������������������������������������������������������������������������������������������������������������������������������������������������������������������������������������������������������������������������������������������������������������������������������������������������������������������������������������������������������������������������������������������������������������������������������������������������������������������������������������������������������������������������������������������������������������������������������������������������������������������������������������������������������������������������������������������������������������������������������������������������������������������������������������������������������������������������������������������������������������������������������������������������������������������������������������������������������������������������������������������������������������������������������������������������������������������������������������������������������������������������������������������������������������������������������������������������������������������������������������������������������������������������������������������������������������������������������������������������������������������������������������������������������������������������������������������������������������������������������������������������������������������������������������������������������������������������������������������������������������������������������������������������������������������������������������������������������������������������������������������������������������������������������������������������������������������������������������������������������������������������������������������������������������������������������������������������������������������������������������������������������������������������������������������������������������������������������������������������������������������������������������������������������������������������������������������������������������������������������������������������������������������������������������������������������������������������������������������������������������������������������������������������������������������������������������������������������������������������������������������������������������������������������������������������������������������������������������������������������������������������������������������������������������������������������������������������������������������������������������������������������������������������������������������������������������������������������������������������������������������������������������������������������������������������������������������������������������������������������������������������������������������������������������������������������������������������������������������������������������������������������������������������������������������������������������������������������������������������������������������������������������������������������������������������������������������������������������������������������������������������������������������������������������������������������������������������������������������������������������������������������������������������������������������������������������������������������������������������������������������������������������������������������������������������������������������������������������������������������������������������������������������������������������������������������������������������������������������������������������������������������������������������������������������������������������������������������������������������������������������������������������������������������������������������������������������������������������������������������������������������������������������������������������������������������������������������������������������������������������������������������������������������������������������������������������������������������������������������������������������������������������������������������������������������������������������������������������������������������������������������������������������������������������������������������������������������������������������������������������������������������������������������������������������������������������������������������������������������������������������������������������������������������������������������������������������������������������������������������������������������������������������������������������������������������������������������������������������������������������������������������������������������������������������������������������������������������������������������������������������������������������������������������������������������������������������������������������������������������������������������������������������������������������������������������������������������������������������������������������������������������������������������������������������������������������������������������������������������������������������������������������������������������������������������������������������������������������������������������������������������������������������������������������������������������������������������������������������������������������������������������������������������������������������������������������������������������������������������������������������������������������������������������������������������������������������������������������������������������������������������������������������������������������������������������������������������������������������������������������������������������������������������������������������������������������������������������������������������������������������������������������������������������������������������������������������������������������������������������������������������������������������������������������������������������������������������������������������������������������������������������������������������������������������������������������������������������������������������������������������������������������������������������������������������������������������������������������������������������������������������������������������������������������������������������������������������������������������������������������������������������������������������������������������������������������������������������������������������������������������������������������������������������������������������������������������������������������������������������������������������������������������������������������������������������������������������������������������������������������������������������������������������������������������������������������������������������������������������������������������������������������������������������������������������������������������������������������������������������������������������������������������������������������������������������������������������������������������������������������������������������������������������������������������������������������������������������������������������������������������������������������������������������������������������������������������������������������������������������������������������������������������������������������������������������������������������������������������������������������������������������������������������������������������������������������������������������������������������������������������������������������������������������������������������������������������������������������������������������������������������������������������������������������������������������������������������������������������������������������������������������������������������������������������������������������������������������������������������������������������������������������������������������������������������������������������������������������������������������������������������������������������������������������������������������������������������������������������������������������������������������������������������������������������������������������������������������������������������������������������������������������������������������������������������������������������������������������������������������������������������������������������������������������������������������������������������������������������������������������������������������������������������������������������������������������������������������������������������������������������������������������������������������������������������������������������������������������������������������������������������������������������������������������������������������������������������������������������������������������������������������������������������������������������������������������������������������������������������������������������������������������������������������������������������������������������������������������������������������������������������������������������������������������������������������������������������������������������������������������������������������������������������������������������������������������������������������������������������������������������������������������������������������������������������������������������������������������������������������������������������������������������������������������������������������������������������������������������������������������������������������������������������������������������������������������������������������������������������������������������������������������������������������������������������������������������������������������������������������������������������������������������������������������������������������������������������������������������������������������������������������������������������������������������������������������������������������������������������������������������������������������������������������������������������������������������������������������������������������������������������������������������������������������������������������������������������������������������������������������������������������������������������������������������������������������������������������������������������������������������������������������������������������������������������������������������������������������������������������������������������������������������������������������������������������������������������������������������������������������������������������������������������������������������������������������������������������������������������������������������������������������������������������������������������������������������������������������������������������������������������������������������������������������������������������������������������������������������������������������������������������������������������������������������������������������������������������������������������������������������������������������������������������������������������������������������������������������������������������������������������������������������������������������������������������������������������������������������������������������������������������������������������������������������������������������������������������������������������������������������������������������������������������������������������������������������������������������������������������������������������������������������������������������������������������������������������������������������������������������������������������������������������������������������������������������������������������������������������������������������������������������������������������������������������������������������������������������������������������������������������������������������������������������������������������������������������������������������������������������������������������������������������������������������������������������������������������������������������������������������������������������������������������������������������������������������������������������������������������������������������������������������������������������������������������������������������������������������������������������������������������������������������������������������������������������������������������������������������������������������������������������������������������������������������������������������������������������������������������������������������������������������������������������������������������������������������������������������������������������������������������������������������������������������������������������������������������������������������������������������������������������������������������������������������������������������������������������������������������������������������������������������������������������������������������������������������������������������������������������������������������������������������������������������������������������������������������������������������������������������������������������������������������������������������������������������������������������������������������������������������������������������������������������������������������������������������������������������������������������������������������������������������������������������������������������������������������������������������������������������������������������������������������������������������������������������������������������������������������������������������������������������������������������������������������������������������������������������������������������������������������������������������������������������������������������������������������������������������������������������������������������������������������������������������������������������������������������������������������������������������������������������������������������������������������������������������������������������������������������������������������������������������������������������������������������������������������������������������������������������������������������������������������������������������������������������������������������������������������������������������������������������������������������������������������������������������������������������������������������������������������������������������������������������������������������������������������������������������������������������������������������������������������������������������������������������������������������������������������������������������������������������������������������������������������������������������������������������������������������������������������������������������������������������������������������������������������������������������������������������������������������������������������������������������������������������������������������������������������������������������������������������������������������������������������������������������������������������������������������������������������������������������������������������������������������������������������������������������������������������������������������������������������������������������������������������������������������������������������������������������������������������������������������������������������������������������������������������������������������������������������������������������������������������������������������������������������������������������������������������������������������������������������������������������������������������������������������������������������������������������������������������������������������������������������������������������������������������������������������������������������������������������������������������������������������������������������������������������������������������������������������������������������������������������������������������������������������������������������������������������������������������
percentage of
The greatest proportion of
The lowest
number of
women
are employed in the X
cars sold
category
holiday makers are red
come from Spain
The most
A significant
The
smallest
The largest
Starting with the subject:
Red is the
most
popular
car colour
Professional is
second/third most
prevalent
employment category
the
least
common
holiday destination
Spain is the
© 1999 Holmesglen Institute of TAFE
27
Describing two parts of the chart
Starting with the adjective:
As many
as …
Twice as many
Three times as
many
Not as many
red cars
are sold
women
are
holiday makers
employed in
X
More
come from X
than
Far more
Much more
Many more
A lot more
Substantially more
Considerably
more
Significantly more
Slightly more
Fractionally more
© 1999 Holmesglen Institute of TAFE
28
Starting with the subject:
Blue cars are
as
common
Women are
quite as
popular
Spain is
just as
prevalent
as …
nearly as
almost as
not as
more
than …
much more
far more
substantially
more
considerably
more
slightly more
fractionally more
less
much less
far less
considerably less
fractionally less
© 1999 Holmesglen Institute of TAFE
29
Writing task one: tables
Task description
You will be given one table of figures. Your task is to describe the
information given in the graph by writing a 150 word report. You are not
asked to give your opinion. You should spend around 20 minutes on the
task.
What is being tested in your ability to:
♦ objectively describe the information presented in a table
♦ compare and contrast
♦ report on an impersonal topic without the use of opinion
♦ use language appropriate to the description of tables
Sample task
You should spend about 20 minutes on this task. Write a report for a
university lecturer describing the information in the table below. You
should write at least 150 words.
Hours of leisure time per year in Someland
Teens
20s
30s
40s
50s
60s
70s +
1,200
700
400
500
600
700
1,100
Socialising with
4 or less people
150
150
300
250
250
200
200
Socialising with
4 or more
people
350
350
50
50
25
25
25
Individual
exercise
150
100
200
200
50
75
150
Group
exercise/sport
450
350
200
150
50
0
0
Cinema
100
75
50
25
25
50
75
Watching
TV/videos
Your task
Complete the Task One report exercise above. Spend only 20 minutes.
Then look at the notes and the sample answer below.
© 1999 Holmesglen Institute of TAFE
30
Guidelines for a good answer
Does the report have a suitable structure?
♦ Does it have an introduction, body and conclusion?
♦ Does it include connective words to make the writing cohesive within
sentences and paragraphs?
Does the report use suitable grammar and vocabulary?
♦ Does it include a variety of sentence structures?
♦ Does it include a range of appropriate vocabulary?
Does the report meet the requirements of the task?
♦ Does it meet the word limit requirements?
♦ Does it describe the whole report adequately?
♦ Does it focus on the important trends presented in the table?
Sample answers
We will now compare two sample answers, one better than the other. How
well does each one follow the guidelines?
Sample answer one
The table shows how people in different age groups spent
their leisure time in Someland. It can be clearly seen that the
amount of leisure time available varied considerably across
the age groups.
Teenagers in Someland spent 1,200 hours a year watching
TV and those in the over 70s group spent 100 hours less at
1,100. They spent 150 hours on socialising with 4 or less
people compared with 200 hours at the other end of the
scale. They spent 350 hours socialising with 4 or more
people compared with 25 hours. The teenagers spent 450
hours on group exercise but retired people didn’t do any.
In conclusion, we can see that in Someland the teenagers
and retired people prefer to spend their free time in different
ways.
© 1999 Holmesglen Institute of TAFE
31
Teacher's comments on sample answer one
Here is what an IELTS teacher said about the sample answer.
The report structure is clear and well organised with an
introduction, body and conclusion.
The candidate uses repetitive grammatical structures and
vocabulary which would bring the mark down considerably.
The tense used is not appropriate as there is no indication on
the table that the figures refer to the past. Also the reader
doesn’t know who is being referred to in the two sentences
on socialising. The word ‘prefer’in the conclusion is
inappropriate because the table does not give any indication
of people’s reasons for spending their time on one activity
rather than another. Someone may choose indoor rather than
outdoor activities because of their health although they would
prefer to go outside.
In terms of task requirements the report has serious
problems. Although in writing about a table you will have the
difficulty of there being too much information to put into a 150
word report, you can’t solve this problem by ignoring whole
sections of the table. In this case the candidate simply
compared two age levels and ignored the rest.
© 1999 Holmesglen Institute of TAFE
32
Sample answer two
Here is an example of a better answer to this task. Notice how it follows
the guidelines.
The table shows how people in different age groups spend
their leisure time in Someland over the course of a year. It
can be clearly seen that the amount of leisure time available
varies considerably across the age groups and that people of
different age levels have very different ways of spending their
leisure time.
According to the figures, as people age in Someland their
social lives reduce. Teenagers and people in their twenties
spend on average 500 hours per year on socialising and 350
hours of that time is with a group of more than 4 people.
Although the total hours of socialising in their 30s, 40s, 50s
and 60s is fairly constant (between 300-350), socialising with
more than 4 people drops dramatically to 50 hours in the 30s
and 40s age groups and only 25 from 50 years old. Group and
individual exercise follow a similar pattern.
People of all ages spend a good part of their leisure time on
entertainment such as TV/video viewing and cinema. In both
cases, teenagers and retired people spend around twice as
much time as those who are at working age. Home
entertainment ranges from just over a thousand hours for
teenagers and retired people and an average of 600 hours for
everyone else. Cinema accounts for 100 hours of the
teenagers and retired people’s leisure time and 25-50 hours
for the rest.
In conclusion we can see there is a significant trend towards
solitary and smaller group activities as people grow older and
that teenagers and retired people spend a lot more time on
entertainment than those of working age do.
© 1999 Holmesglen Institute of TAFE
33
Strategies for improving your IELTS score
Report structure
Like the line graphs your report should be structured simply with an
introduction, body and conclusion. Tenses should be used appropriately.
Use two standard opening sentences to introduce the table and your
report. These opening sentences should make up the first paragraph.
Sentence one should define what the table is about; that is, the date,
location, what is being described in the graphs etc. For example:
The table shows how people in different age groups spend
their leisure time in Someland over the course of a year.
Notice that the sample opening sentence does not simply copy the words
used on the graphic material. Copied sentences will not be assessed by
the examiner and so you waste your time including them.
Sentence two (and possibly three) might sum up the overall trend. For
example:
It can be clearly seen that the amount of leisure time
available varies considerably across the age groups and
that people of different age levels have very different ways
of spending their free time.
Notice the tense used. In this case there is no date given and so we must
take the table information as being current now.
The body of the report will describe the information presented in the table
in detail. You will need to decide on the most clear and logical order to
present the material. Generally you will choose one of the categories given
in the table; that is, the age or activity in the example task above. Your
choice would depend on whether you could see the most significant trends
occurring by age group or by activity. In this case distinguishing the age
group is your primary concern in describing this table, and you would do
this by highlighting some differences between the activity preferences of
the age groups.
Ideally your report should end with one or two sentences which summarise
your report or draw a relevant conclusion.
Grammar and vocabulary
You will receive a higher mark if your writing uses a range of structures
and vocabulary correctly rather than a limited number.
© 1999 Holmesglen Institute of TAFE
34
Selecting your information
In completing this task it is important that you cover all of the information
given. However, this does not mean that you should note every detail. In
tables there is invariably too much information for you to mention each
figure. You will therefore need to summarise the table in meaningful
segments. In other words, you will describe the significant trends in your
report.
To see the trends in a table, start by finding patterns under the horizontal
and vertical headings. In the sample task you would analyse the age
groups and activities. We can see that at different times in their lives
Someland people have more or less free time and their priorities for how
they spend their free time are different. In analysing the activities we can
look for which age groups spend more time on individual or group, cheap
or expensive, home or outdoor, strenuous or restful activities. By
describing trends in this way, we can avoid having to describe every age
group across every activity.
Writing task one: processes
Task description
You will be given a diagram of a process. Your task is to describe the
information given in the diagram by writing a 150 word report. You are not
asked to give your opinion.
What is being tested
Task one questions asking you to describe a process rarely appear on the
IELTS test. They are different from table, graph and chart description
because they test your ability to:
♦ describe each important stage in the process and expand where
necessary
♦ link your descriptions of each stage
♦ use the present simple passive
As process tasks can vary widely, it is essential that you look at a lot of
examples in IELTS preparation books.
You should spend around 20 minutes on the task.
© 1999 Holmesglen Institute of TAFE
35
Sample task
You should spend about 20 minutes on this task.
The flow chart below shows how national examination papers are marked
in Someland.
Write a report for a university lecturer describing the information below.
You should write at least 150 words.
Reading and
Listening
collected
Writing test
collected
Marked by an
administrator
Marked by an
examiner
Writing answer
paper sent to
an examination
Collated
Stored
Marks sent to
an
administrator
Reassessed
Your task
Complete the Task One report exercise above. Spend only 20 minutes.
Then look at the notes and the sample answer below.
© 1999 Holmesglen Institute of TAFE
36
Guidelines for a good answer
Does the report have a suitable structure?
♦ Does it have an introduction, body and conclusion?
♦ Does it include connective words to make the writing cohesive within
sentences and paragraphs?
Does the report use suitable grammar and vocabulary?
♦ Does it include a variety of sentence structures?
♦ Does it include a range of appropriate vocabulary?
Does the report meet the requirements of the task?
♦ Does it meet the word limit requirements?
♦ Does it describe the whole process adequately?
Sample answer
The sample task given is simplified for the sake of explaining this kind of
report task clearly. In a genuine test you can expect the process to be
more complex.
The flow chart shows the marking procedures for national
exam papers in Someland.
After the papers are collected, the Reading and Listening
papers are marked by an administrator and then collated.
The writing papers are treated differently. After collection,
the writing papers are marked by an examiner. The marks
are then sent to an administrator for collation while the
exam papers are sent to an examination board. The board
either stores the papers or reassesses them.
© 1999 Holmesglen Institute of TAFE
37
Strategies for improving your IELTS score
Meeting the task requirements
When you begin the writing test, look at the illustration (flow chart, diagram
etc) and try to work out what the important stages are, the order they occur
and any obvious reasons for the order. Your report must include every
stage shown in the diagram or flow chart.
When looking at the illustration, be careful to distinguish stages which
happen concurrently. (A is performed at the same time as B) and others
which are alternatives (either A or B is performed). The flow chart given in
the Sample Task demonstrates this problem. Look at the stages for the
writing test. In the second stage we can see that the writing paper is
marked by an examiner. It is then sent to the examination board while at
the same time the marks are sent to an administrator. These events occur
concurrently. In the final stage, the papers are either stored or reassessed.
These events are alternatives.
It may happen that the diagram does not make much sense to you at first
glance. Look for a starting point and follow through the stages in your mind
before beginning to write. If it’s still not making sense, then go on to Task
Two but make sure that you give yourself 20 minutes to complete the
report before the end of the writing test time. It often happens that our
brains can sort problems out for us even when we are focusing on
something else.
Report structure
Like the line graphs, your report should be structured simply with an
introduction, body and conclusion. Tenses should be used appropriately.
Use one standard opening sentence to introduce the report. This opening
sentence will make up the first paragraph. You should state simply what
the process is. For example:
The flow chart shows the marking procedures for national
exam papers in Someland.
Notice that the sample opening sentence does not simply copy the words
used in the task instructions. Copied sentences will not be assessed by
the examiner and so you waste your time including them.
The body of the report will describe the process in a logical order.
A conclusion will generally not be necessary in this kind of report.
© 1999 Holmesglen Institute of TAFE
38
Grammar and vocabulary
You will receive a higher mark if your writing uses a range of structures
and vocabulary correctly rather than a limited number.
If the flow chart is simple and linear then you may be able to link the
stages together by simply using some of the following transition signals.
To begin with
First of all
First
Secondly, thirdly, etc
Then
Next
After that
Finally
If the process is more complex, as in the example above, then you may
need to also use these words
Alternatively
Otherwise
In addition
At the same time
Concurrently
Using the present simple passive
The passive is associated with an impersonal formal style. It is often used
in notices, announcements and describing processes. Compare the
following sentences:
Active:
Passive:
The examiner marks the test paper
The test paper is marked
The two sentences have the same meaning but the emphasis is different.
In the active sentence we are more interested in the person or thing doing
the action (the agent).
In the passive sentence we are more interested in the person or thing
affected by the action. If we want to mention the agent we use by:
The test paper is marked by the examiner
But often the agent is not important.
© 1999 Holmesglen Institute of TAFE
39
The passive is not another way of expressing the same sentence in the
active. We choose the active or passive depending on what we are more
interested in. In the first sentence we are more interested in the examiner.
In the second sentence we are more interested in the test paper.
Subject
The test paper
is / are
is
© 1999 Holmesglen Institute of TAFE
past participle
marked
(by agent)
(by the
examiner)
40
PREPARING FOR IELTS WITH HOLMESGLEN
INSTITUTE
Writing task two
Description of task
You will be given a discussion topic. Your task is to write a 250 word essay
on that topic. You should spend around 40 minutes on the task.
What is being tested is your ability to:
♦ Present a point of view with convincing evidence
♦ Challenge an alternate point of view
♦ Focus on the topic and avoid irrelevancies
♦ Communicate in a style that is easy to follow and cohesive.
♦ Use English accurately and appropriately
Sample task
You should spend about 40 minutes on this task.
Present a written argument to an educated reader with no specialist
knowledge of the following topic:
Television has had a significant influence on the culture of many
societies. To what extent would you say that television has positively
or negatively affected the cultural development of your society?
You should write at least 250 words
Use your own knowledge and experience and support your arguments
with examples and relevant evidence.
Your task
Complete the task 2 exercise above. Spend only 40 minutes on the task,
then look at the notes and sample answer below.
© 1999 Holmesglen Institute of TAFE
41
Sample answer
It has been around forty years since television was first
introduced into Australian households and people today still
have mixed views on whether it has a positive or a negative
influence on the society.
Many people believe that television damages culture. It
promotes the stronger cultures of countries such as Britain
and North America and weakens the cultures of less wealthy
countries. This is because the stronger, wealthier countries
are able to assert their own culture by producing more
programs that are shown widely around the world. These
programs then influence people, particularly young people, in
the countries where they are shown.
Also, because television networks need to attract large
audiences to secure their financial survival, they must
produce programs which are interesting to a broad range of
people. In Australia this range is very broad because we are
a multicultural society and people of all ages like to watch
television. To interest all these different people, most
television programs are short in length, full of action and
excitement, do not require much intelligence or knowledge to
understand, and follow universal themes common to all
cultures, such as love and crime. Television programs which
concentrate on or develop themes pertinent to one particular
culture are not so successful because they interest a smaller
audience.
Nevertheless we much acknowledge that television does
have some positive effects on the cultures within a society as
well. People who do not live within their own culture can, in a
limited way, access it through the multicultural station on the
television. For example, Aboriginal children who have grown
up in white families, or migrants and international students
living in Australia, can watch programs from their own culture
on the television.
In conclusion, I hold the view that television promotes and
strengthens those cultures that are wealthy and influential
while it weakens the cultures that are already in a weakened
position.
© 1999 Holmesglen Institute of TAFE
42