TCDN thanh kinh do joint stock company
Bạn đang xem bản rút gọn của tài liệu. Xem và tải ngay bản đầy đủ của tài liệu tại đây (390.16 KB, 19 trang )
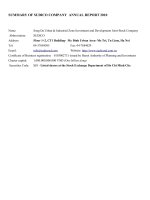
Kinh Do Joint Stock Company
• - Sector: Food and beverage industry
• - Major businesses: sweets and non-alcoholic
beverages, including cookies, cakes, crackers, candies,
moon cakes, beverages and ice cream, merchandise of
operating supplies and real estate...
• - It was established in 1993
• - It was listed on HASTC in 2005 with the ticker KDC
• - Initial chartered capital: VND 150 billion
• Until now, chartered capital: VND 1,195,178,810,000
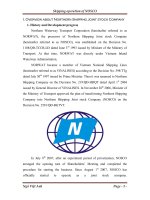
SWOT Analysis
Strengths
-Advantages of a leading food processing company in Vietnam
- Efficient management mechanism
- Property of many attractive real estate projects
Weaknesses
- Potential risks in financial investment activities: the fluctuation of stock market.
- Tariff cut: the higher quality but lower price imports
Opportunities
- Economies of scale
- Huge cash inflow from investing attractive real estate projects in the future
Threats
- Risks caused by extending the product structure.
- Retail operation through the system of Kinh Do Bakery and Kinh Do Café
The relationship between Vietnamese
financial market and TAC’s financial
management
- In 2008, financial crisis and global economic
recession
- In 2009, Vietnam government implemented
expansionary monetary policy
-> The interest rate decreased
Effects:
+ Firms and enterprises to make more bank loans
-> Kinh Do increased more than twice higher than in
2008.
-> The credit outstanding balance of bank system
increased significantly
+ Savings channel: less attractive
-> the cash flows switch into the stock market.
-> OE of KDC increased more than VND 300,000
million in 2009
=> the total assets increase: > 1.5 times
-> * Made financial decisions
- Monitor the market situation and focus the main
business sectors
-Reduce unreasonable costs & optimize the use of
current assets
-Focus on investment activities
+ Minimize short term investments, focus on
real estate projects
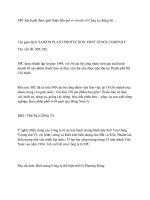
Investment Structure in 2009
2009
2008
Change (%)
Short term investment in securities
23
86
-73%
Long term investmentin same sector companies
490
754
-35%
Long term investment in stragic partners
212
365
-42%
Long term investment in real estate project
295
86
242%
-> Results:
+ Q2 in 2009, profit after tax: 84.8 billion, >
440% same period
+ attracted more and more investors
-> the price of KDC increased dramatically.
-> impact on the stock market: the excitement of
the stock market in 2009
Conclusion: A binding relationship.
Company’s
profitability and risk
Balance sheet
Unit: VND million
Source: website of Tan Viet’s stock exchange
Income statement
Unit: VND million
Source: website of Tan Viet’s stock exchange
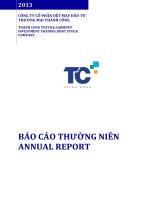
Liquidity ratios
Liquidity ratios
2008
2009
2010
Current ratio (times)
2.22
1.53
2.25
1.58
1.59
1.8
Quick ratio (times)
1.95
1.43
1.83
0.87
0.94
1.06
Source: cophieu68.com & website of Tan Viet’s stock exchange
-> Low liquidity risks
Leverage ratios
Leverage ratios
2008
2009
2010
Total liabilities to Total
Assets (%)
Total liabilities to equity
(%)
Long term debt to assets
(%)
0.28
0.42
0.24
0.47
0.49
0.47
0.40
0.73
0.32
1.16
1.29
1.16
0.06
0.03
0.03
Source: cophieu68.com & website of Tan Viet’s stock exchange
-> Face low risk in insolvency
but not take the advantages of financial leverage.
Efficiency ratios
Efficiency ratios
2008
2009
2010
Inventories Turnover
8.01
9.41
4.45
8.77
6.02
5.73
Receivable Turnover
2.80
1.80
1.90
19.62
25.31
29.94
Total asset Turnover
0.49
0.36
0.38
1.52
1.57
1.52
Source: cophieu68.com & website of Tan Viet’s stock exchange
-> Inventory management: Efficient
Receivable and asset management: Not efficient
Profitability ratios
Profitability ratios
2008
2009
2010
Gross profit margin (%)
25.4
33.05
35.45
Net profit margin (%)
ROA (%)
ROE (%)
23.37
-4.16
8.97
-2.03
11.14
-2.92
20.97
22.77
34.19
9.85
12.31
14.36
21.67
27.71
23.37
29.92
8.97
11.48
11.14
15.48
20.97
Source: cophieu68.com & website of Tan Viet’s stock exchange
Relatively good profitability
Market value ratios
Market value ratios
2008
2009
2010
P/E
-23.43
5.79
6.71
6.29
6.29
6.29
P/B
0.96
1.15
1.12
1.01
1.01
1.01
Source: cophieu68.com & website of Tan Viet’s stock exchange
-> Not very good